Performance Monitor
The Performance Monitor build feature allows you to get the statistics on the CPU, disk I/O, and memory usage during a build run on a build agent. The build feature is enabled by default for build configurations created from a URL. Performance Monitor supports Windows, Linux, macOS, Solaris, and FreeBSD operating systems.
Note that Performance Monitor reports the load of the whole operating system. It will not report proper results if you have more than one agent running on the same host, or if an agent and a server are installed on the same machine.
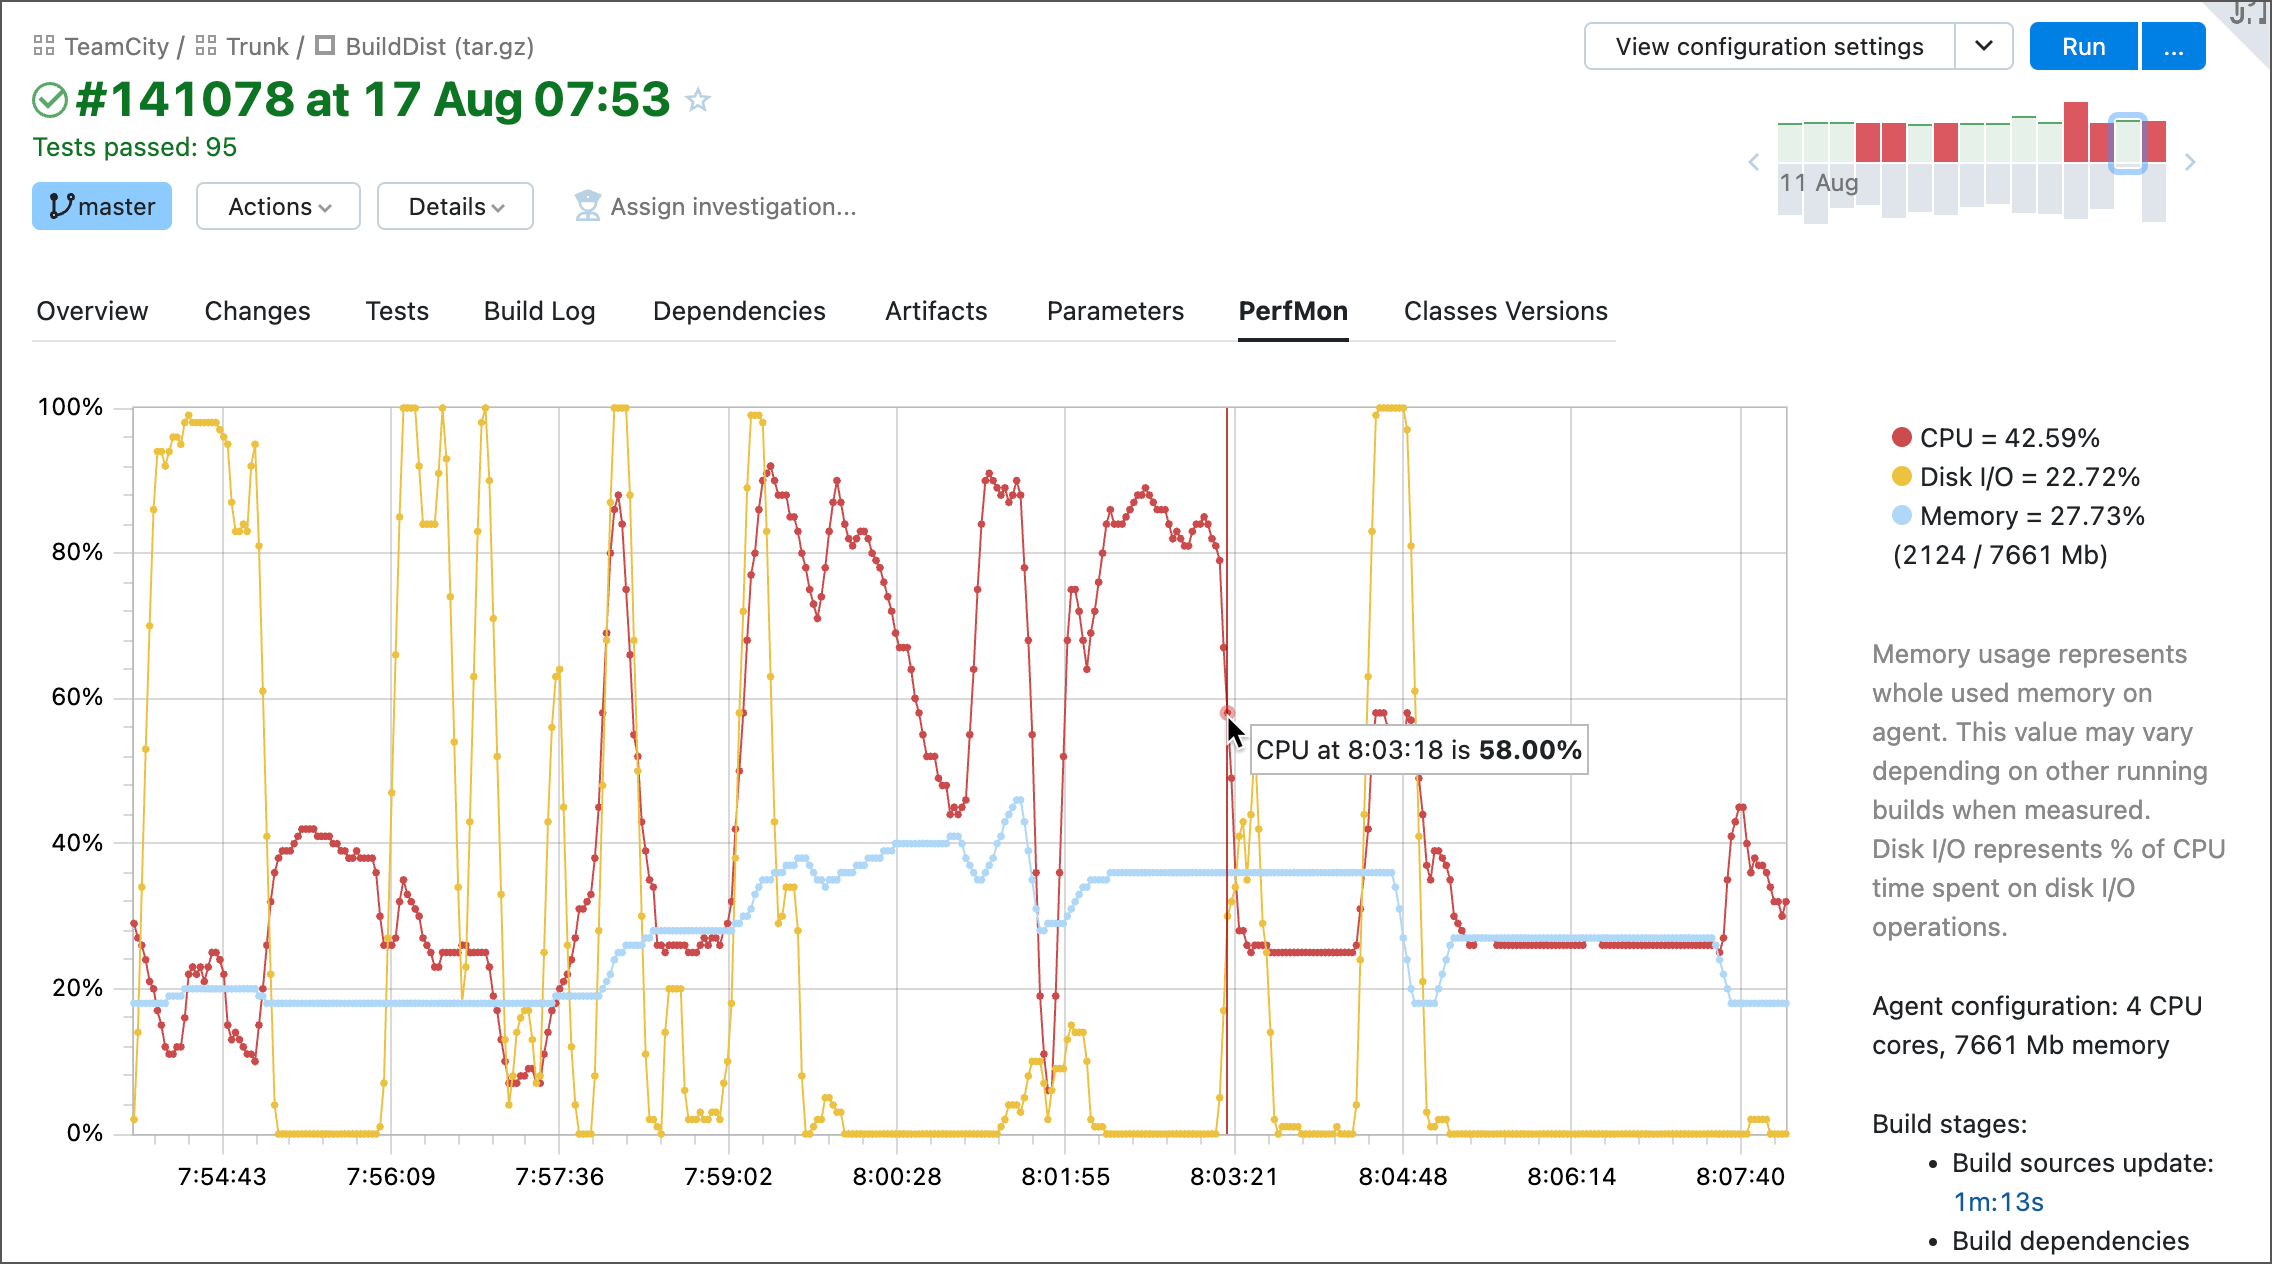
After you enable the Performance Monitor build feature for a build configuration, the Build Results page of each newly run build in this configuration will contain the PerfMon tab with a graph of performance statistics. The CPU value reflects the average CPU load during the build. The Disk I/O shows how much of the CPU time is spent on disk input-output operations. The available Memory value is calculated relatively to the physical memory of the agent machine.
Click any point on the graph to view the corresponding value (CPU on a screenshot below) and view the portion of the build log that corresponds to this timeframe.

External Tools Utilized
On Linux and macOS agents performance monitor obtains statistics from vmstat, /proc/diskstats and /proc/meminfo. Windows agents report performance data using the Windows Management Instrumentation (WMI).
PerfMon requires Perl to be installed on any used OS except Windows.
If a build agent has Telegraf installed, TeamCity automatically detects it and starts using it for collecting performance data. Telegraph allows PerfMon to report the additional "% of free disk space" value.