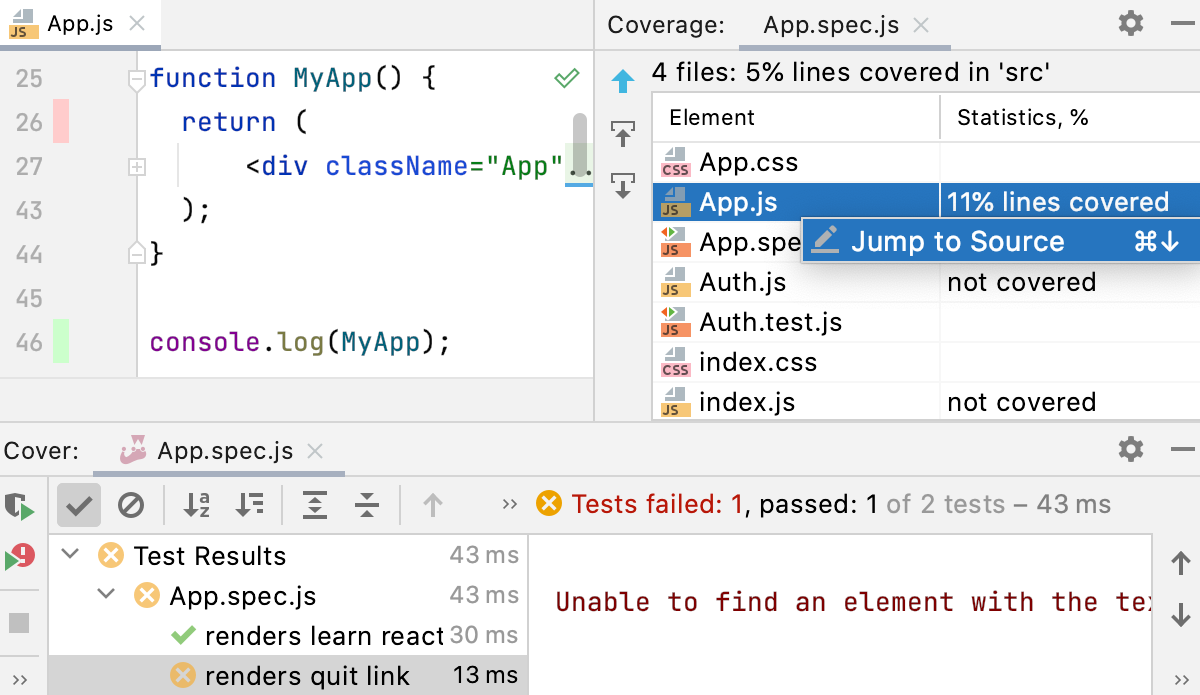
Coverage Tool Window
When you run Jest, Karma, and Mocha tests with coverage, the tool window displays coverage measurement results.

The tool window also opens when you run a client-side application in the special Code Coverage mode to find unused JavaScript, TypeScript, and CSS code. In this mode, the tool window shows how much of code in every file and folder was used.

Toolbar
| Item | Description |
|---|---|
| Click this button to go up one level. | |
| When this button is pressed, source code of the class selected in the tool window, automatically opens in a separate editor tab, and gains the focus. | |
| When this button is pressed, when source code of certain class gets the focus in the editor, the corresponding node is automatically highlighted in the tool window. |
Context menu
| Item | Shortcut | Description |
|---|---|---|
| Jump to Source | F4 | Choose this command to open the selected file in the editor. |
Title bar context menu and buttons
You can right-click the window title bar and use the context menu to configure its viewing mode, associate the window with a different tool window bar, or resize and hide the window.
You can also use the toolbar buttons:
| Item | Shortcut | Description |
|---|---|---|
Automatically sets the focus on the object name in the Project view when the editor area is in focus. | ||
| Shift+Escape | Hide the tool window. To hide all the tool windows, press Ctrl+Shift+F12. |
Last modified: 08 March 2021