Debugging JavaScript Deployed to a Remote Server
Before you start
Make sure the JavaScript Debugger bundled plugin is enabled in the settings. Press Ctrl+Alt+S to open the IDE settings and select . Click the Installed tab. In the search field, type JavaScript Debugger. For more details about plugins, see Managing plugins.
Configure the built-in debugger as described in Configuring JavaScript debugger.
To have the changes you make to your HTML, CSS, or JavaScript code immediately shown in the browser without reloading the page, activate the Live Edit functionality. For more details about the live editing functionality, see Live Edit in HTML, CSS, and JavaScript.
What is a remote web server?
In WebStorm, any server with the document root outside the current project is called remote. This server may be actually running on a physically remote host or on your machine.
For example, if your project is in C:/WebStormProjects/MyProject and the web server document root is C:/XAMPP/htdocs, for WebStorm this web server is remote.
How do I synchronize my application sources on the server with their local copies in my WebStorm project?
To debug an application on a remote web server, you need to have the copies of its sources in a WebStorm project. To synchronize local and remote sources, create a deployment configuration as described in Create a remote server configuration and Configure synchronization with a server.
Debugging an application on a remote server
Set the breakpoints in the JavaScript code, as required.
Create a run/debug configuration of the JavaScript Debug type:
From the main menu, choose , then in the Edit Configurations dialog, in the Edit Configurations dialog that opens, click the Add button (
) on the toolbar and select JavaScript Debug from the list.
In the Run/Debug Configuration: JavaScript Debug dialog that opens, specify the URL address at which the application is running. This URL address should be a concatenation of the Web server root URL and the path to the HTML file relative to the web server document root in accordance with server access configuration. See Configure synchronization with a server for details.
Click OK to save the configuration settings.
Choose the newly created configuration in the Select run/debug configuration list on the toolbar and click the Debug button
. The HTML file specified in the run configuration opens in the chosen browser and the Debug tool window appears.
In the Debug tool window, proceed as usual: step through the program, stop and resume the program execution, examine it when suspended, view actual HTML DOM, run JavaScript code snippets in the Console, and so on. .
Example
Suppose you have a simple application that consists of an index.html file and an App.js file, where index.html references App.js.
Let's now deploy our simple application to a local web server, see Deploy your application. In the following example, it is Apache:
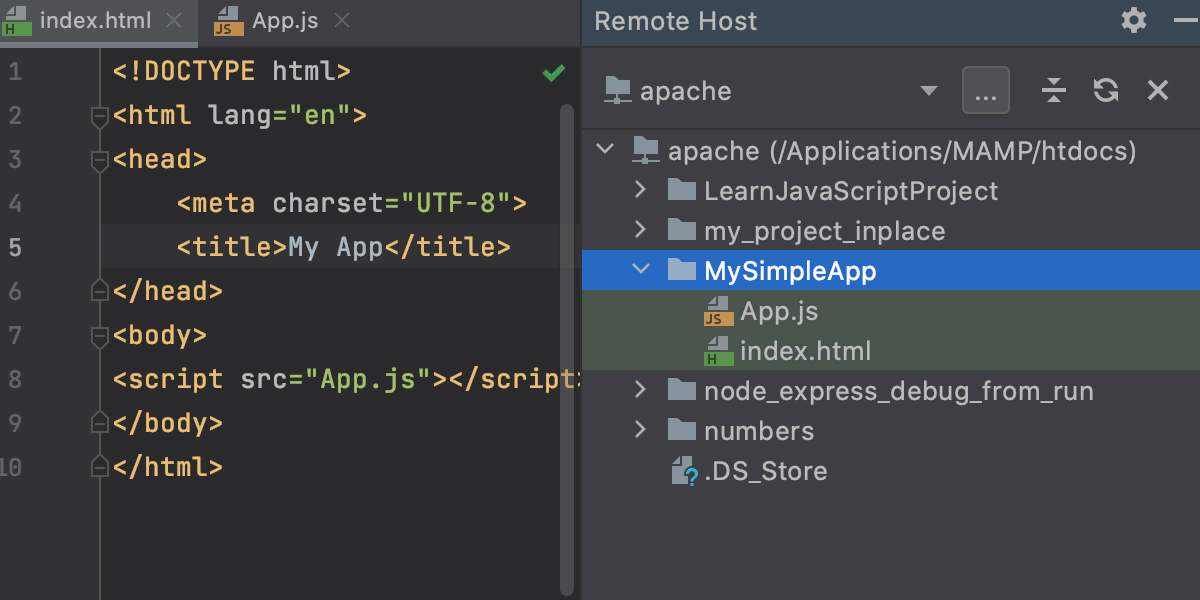
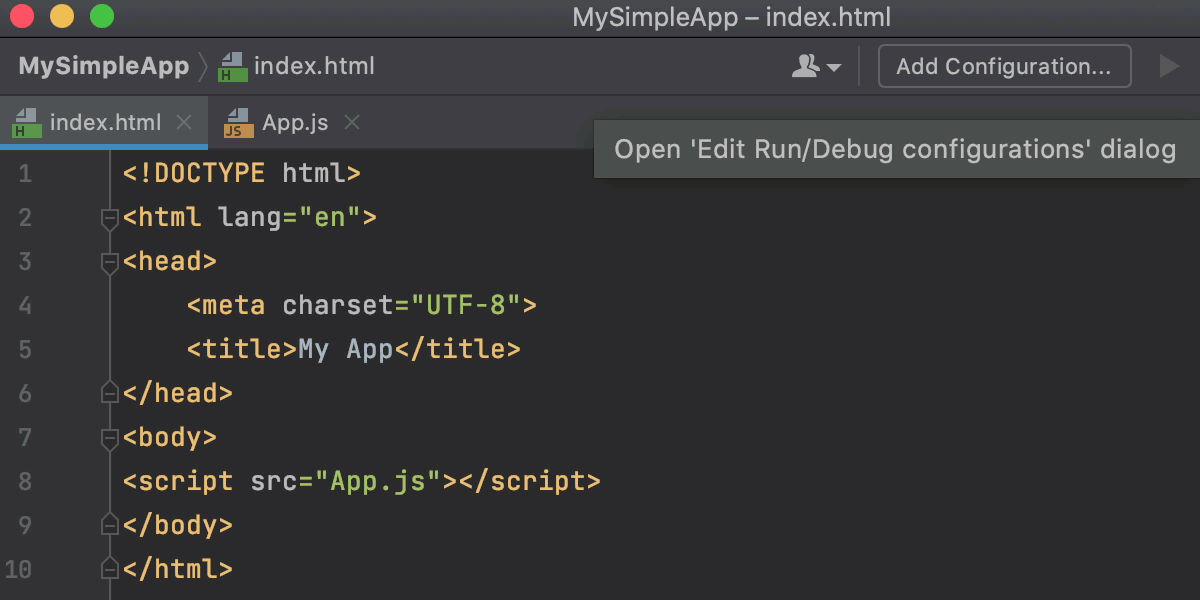
When using a local web server, such as Nginx or Apache, as in our example, or the web server is on a remote host, you need to create a Run/Debug configuration to start the JavaScript debugger. To do that, click the list at the upper right-hand corner of the WebStorm window and choose Edit Configurations. Alternatively, choose from the main menu:
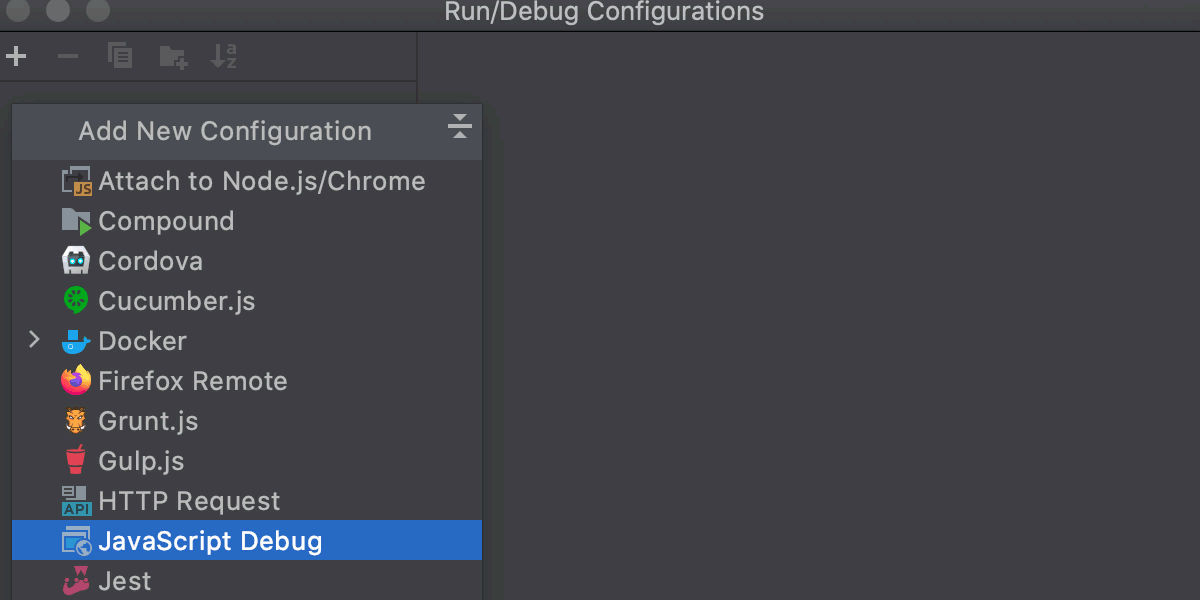
In the Run/Debug Configurations dialog, click
and choose JavaScript Debug from the list:
Specify the URL of your running application:
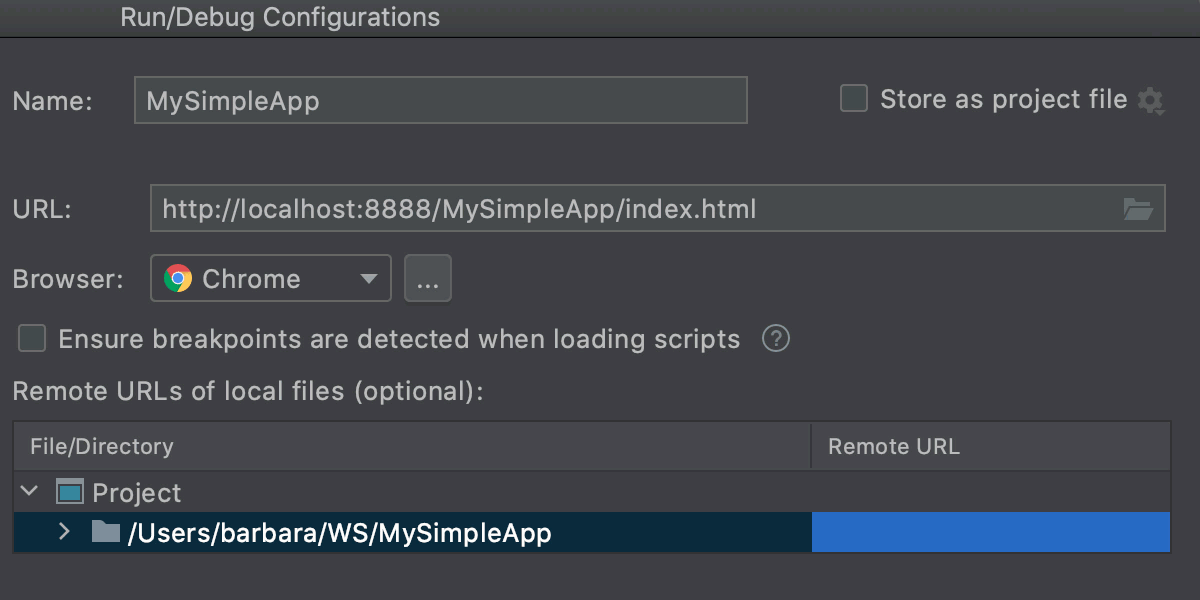
In our example, the local project structure and file structure on the server are the same so no mappings are required.
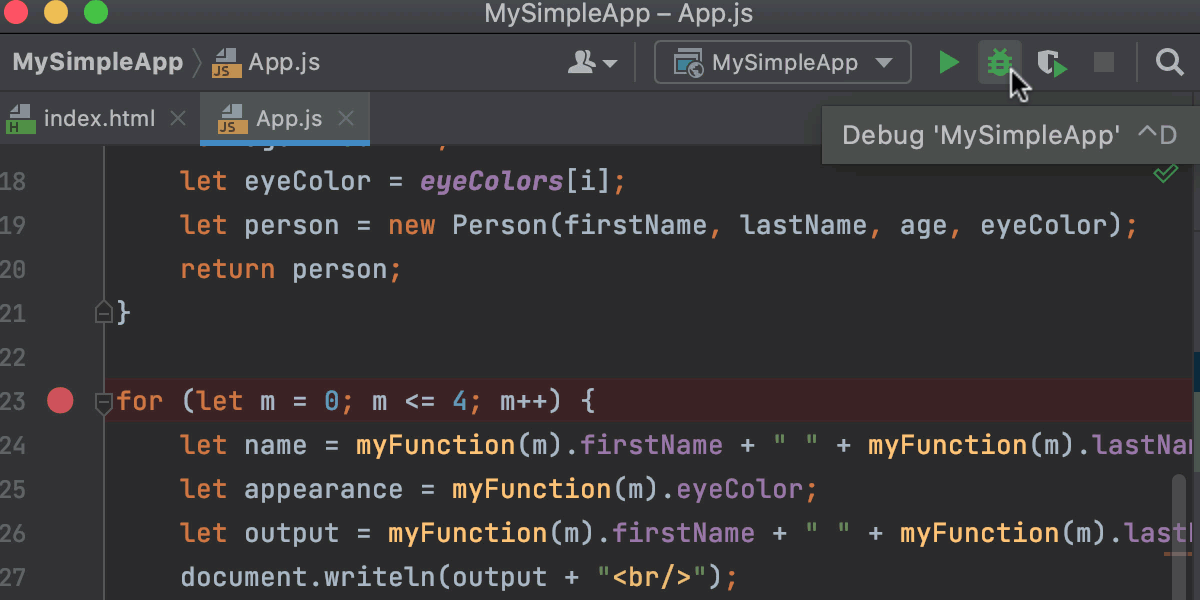
Now we can start debugging: choose the new run/debug configuration from the list in the upper right-hand corner of the WebStorm window, and then click the Debug button (
) to the right of the list:
Configuring mappings
Mappings set correspondence between files on a web server and their local copies. You need mappings:
When your application is deployed and running on a remote web server.
When you have defined several resource root folders in addition to the project root.
In most cases, WebStorm sets path mappings automatically by reusing mappings from the deployment configuration. If your application structure is complicated, additional manual configuration is required.
Configure mappings
Create a debug configuration of the type JavaScript Debug as described in Debugging an application.
In the Remote URLs of local files area, map the files and folders to URL addresses of files and folders on the server according to the currently used deployment configuration, see Mapping local folders to folders on the server and the URL addresses to access them.