Protractor
Protractor is a test framework for Angular and AngularJS applications. Protractor executes tests against your application running in a real browser, which ensures correctness and trustworthiness of test results. WebStorm integrates with Protractor so you can run and debug your tests from inside the IDE. You can see the test results in a treeview and easily navigate to the test source from there.
Before you start
Make sure you have Node.js on your computer.
Make sure the JavaScript and TypeScript and Angular and AngularJS required plugins are enabled on the Settings | Plugins page, tab Installed, see Managing plugins for details.
Installing Protractor
You can install Protractor locally, in your project, or globally. Global installation is preferable.
To install Protractor globally
In the embedded Terminal (Alt+F12) , type:
npm install -g protractorTo download the necessary binaries, type
webdriver-manager update. See also Getting Started on the Protractor official website.
Running tests
Protractor tests are launched only through a run/debug configuration.
To create a Protractor run configuration
Open the Run/Debug Configuration dialog ( on the main menu), click
in the left-hand pane, and select Protractor from the list. The Run/Debug Configuration: Protractor dialog opens.
Specify the Node.js interpreter to use.
If you choose the Project alias, WebStorm will automatically use the project default interpreter from the Node interpreter field on the Node.js page . In most cases, WebStorm detects the project default interpreter and fills in the field itself.
You can also choose another configured local or remote interpreter or click
and configure a new one.
See Configuring remote Node.js interpreters, Configuring a local Node.js interpreter, and Using Node.js on Windows Subsystem for Linux for details.
Specify the location of the protractor package and the path to the protractor.conf.js configuration file. If you followed the standard installation, WebStorm detects all these paths and displays them in the corresponding fields.
Specify the tests to run. This can be a specific test or suite, an entire test file, or a folder with test files.
To run tests via a run configuration
Start the Selenium Server manually or configure it to start automatically in protractor.conf.js. For details, see the Protractor official website.
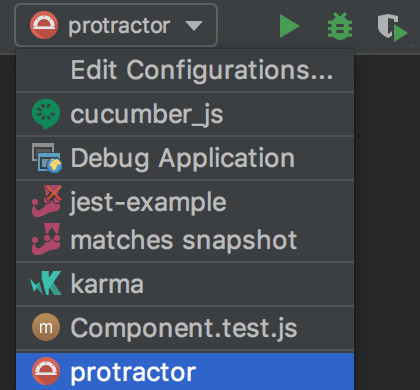
Select the Protractor run/debug configuration from the list on the main toolbar and click
 to the right of the list.
View and analyze messages from the server in the <current_run_configuration_name> tab of the Run tool window.
Navigation
With WebStorm, you can jump between a file and the related test file or from a test result in the Test Runner Tab to the test.
To jump between a test and its subject or vice versa, open the file in the editor and select or from the context menu, or just press Ctrl+Shift+T.
To jump from a test result to the test definition, click the test name in the Test Runner tab twice, or select from the context menu, or just press F4. The test file opens in the editor with the cursor placed at the test definition.
Debugging tests
A debugging session for Protractor tests is started only through a run/debug configuration.
To start debugging tests
Create a Protractor run/debug configuration as described above.
Select the Protractor run/debug configuration from the list on the main toolbar and click
 to the right of the list.
In the Debug tool window that opens, proceed as usual: step through the tests, stop and resume test execution, examine the test when suspended, run JavaScript code snippets in the Console, and so on.