Svelte
WebStorm provides basic Svelte framework functionality such as syntax highlighting, code completion with automatic imports, refactorings, navigation, intentions, code folding, live templates support, and correct formatting.
Before you start
Make sure you have Node.js on your computer.
Install and enable the Svelte plugin on the Settings | Plugins page, tab Marketplace, as described in Installing plugins from JetBrains Marketplace.
Create a Svelte application
The recommended way to create a Svelte application is to use SvelteKit, the official application framework from the Svelte team.
Open your command-line shell or the embedded Terminal (Alt+F12) and type one of the following commands depending on the package manager you are using:
npm create svelte@latest ./<project_name>fornpmpnpm create svelte@latest ./<project_name>forpnpm
Answer the questions in the wizard that starts.
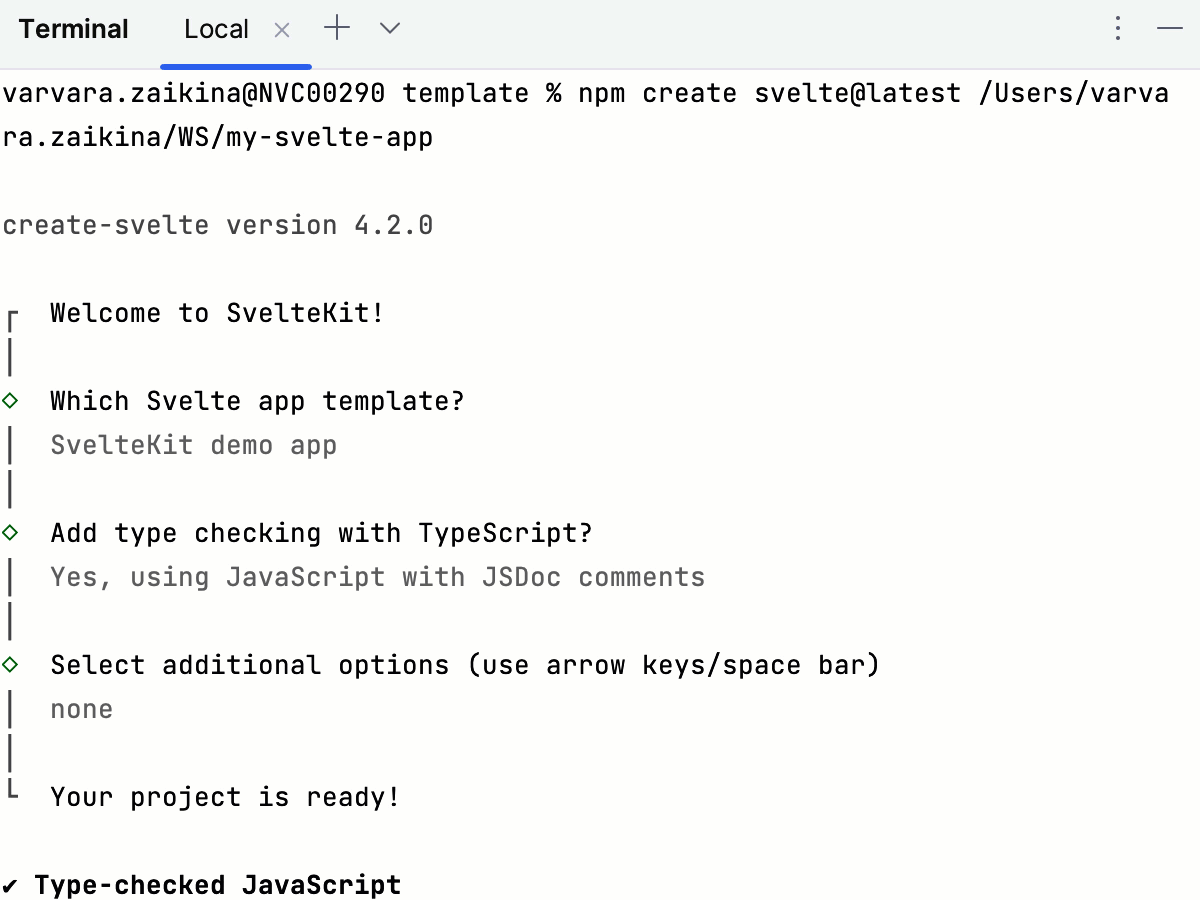
Open the generated application with Svelte-specific structure () and run
npm installto install the dependencies.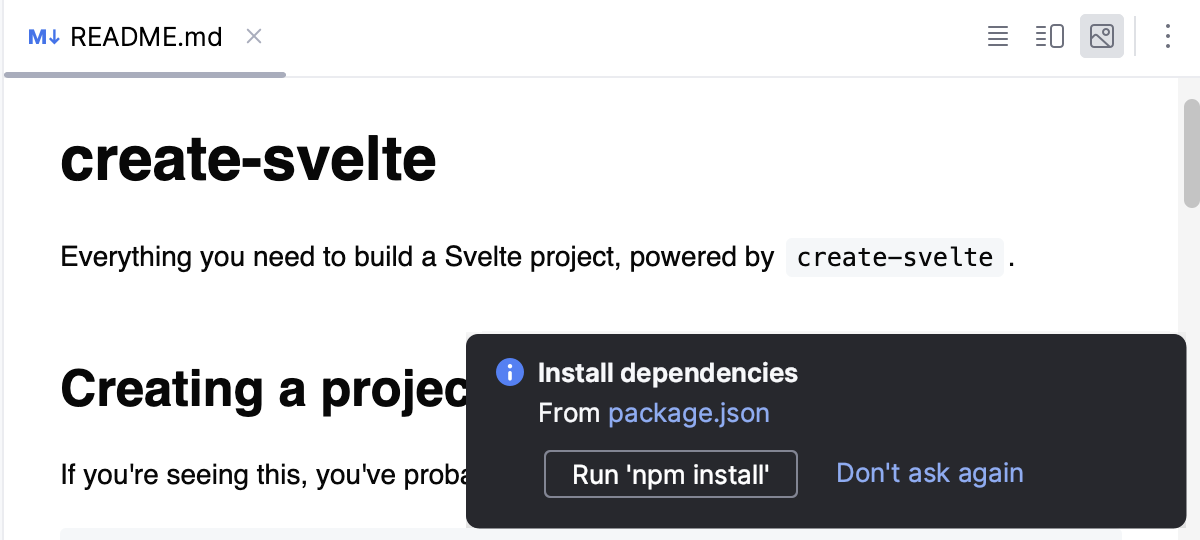
Learn more from the Svelte official website.
Start with an existing Svelte application
To continue developing an existing Svelte application, open it in WebStorm and download the required dependencies.
Open the application sources that are already on your machine
Click Open on the Welcome screen or select from the main menu. In the dialog that opens, select the folder where your sources are stored.
Check out the application sources from your version control
Click Clone Repository on the Welcome screen.
Alternatively, select or or from the main menu.
Instead of Git in the main menu, you may see any other Version Control System that is associated with your project. For example, Mercurial or Perforce.
In the dialog that opens, select your version control system from the list and specify the repository to check out the application sources from. For more information, refer to Check out a project (clone).
Download the dependencies
Click Run 'npm install' or Run 'yarn install' in the popup:

Alternatively, select Run 'npm install' or Run 'yarn install' from the context menu of package.json in the editor or in the Project tool window.
Project security
When you open a project that was created outside WebStorm and was imported into it, WebStorm displays a dialog where you can decide how to handle this project with unfamiliar source code.
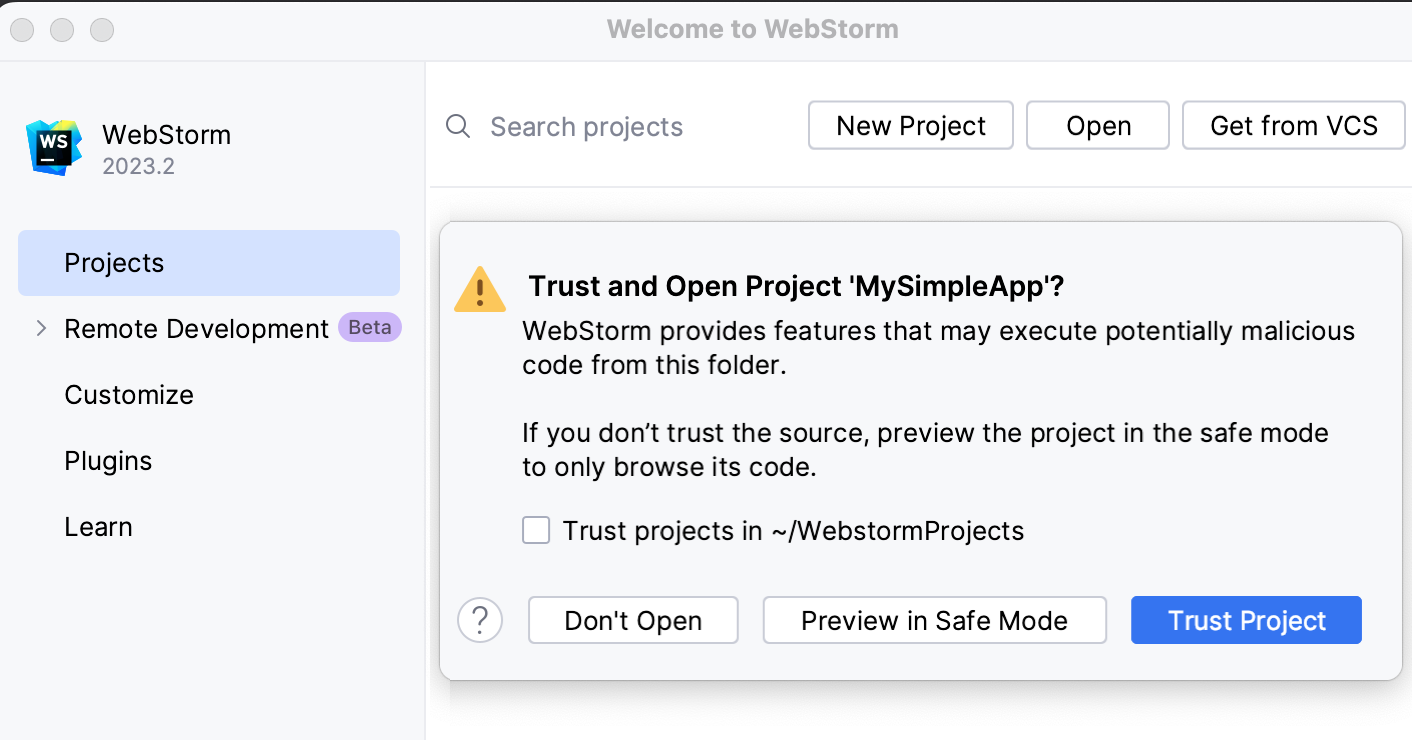
Select one of the following options:
Preview in Safe Mode: in this case, WebStorm opens the project in a preview mode. It means that you can browse the project's sources but you cannot run tasks and script or run/debug your project.
WebStorm displays a notification on top of the editor area, and you can click the Trust project link and load your project at any time.
Trust Project: in this case, WebStorm opens and loads a project. That means the project is initialized, project's plugins are resolved, dependencies are added, and all WebStorm features are available.
Don't Open: in this case, WebStorm doesn't open the project.
Learn more from Project security.
Configure coding assistance in Svelte code
You can get type checking and completion in your Svelte code through integration with the Svelte Language Server. Alternatively, you can use only WebStorm internal inspections and code completion.
In the Settings dialog (Ctrl+Alt+S) , go to .
Specify where to get coding assistance from:
To use the Svelte Language Server, select Enabled.
To use WebStorm internal WebStorm inspections and code completion, select Disabled.
Write and edit your code
In .svelte components and related files WebStorm provides syntax highlighting, code completion with automatic imports, refactorings, navigation, intentions, code folding, live templates support, and correct formatting.
Create Svelte components
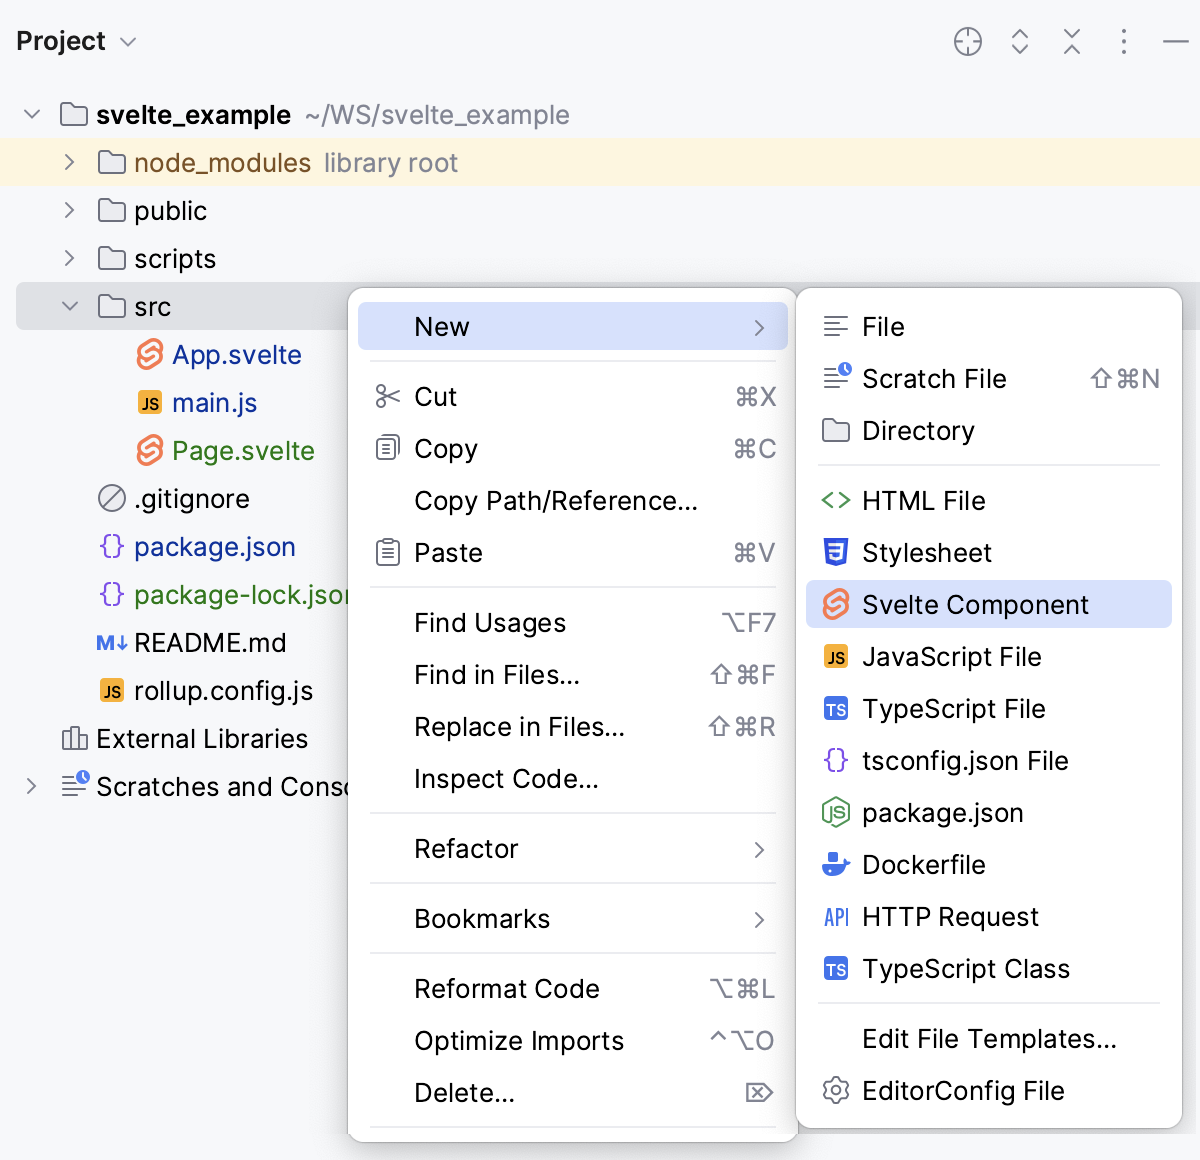
In the Project tool window, select the parent folder for the new component, and then choose Svelte Component from the list.
Code completion
Besides the common completion, WebStorm provides completion for Svelte-specific symbols.
WebStorm shows suggestions for completion as you type. Alternatively, place the caret at the symbol to complete and press Ctrl+Space.
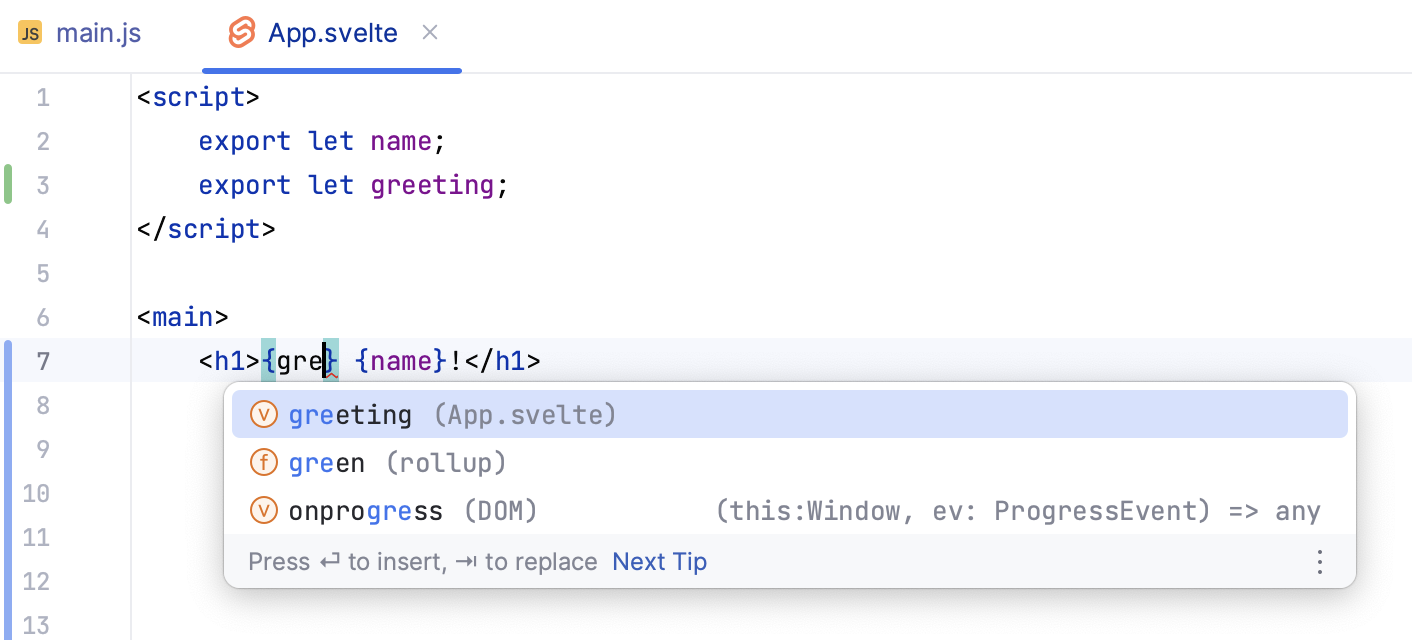
Auto import
WebStorm generates import statements on the fly, as you type or complete your code in .svelte and in JavaScript files.
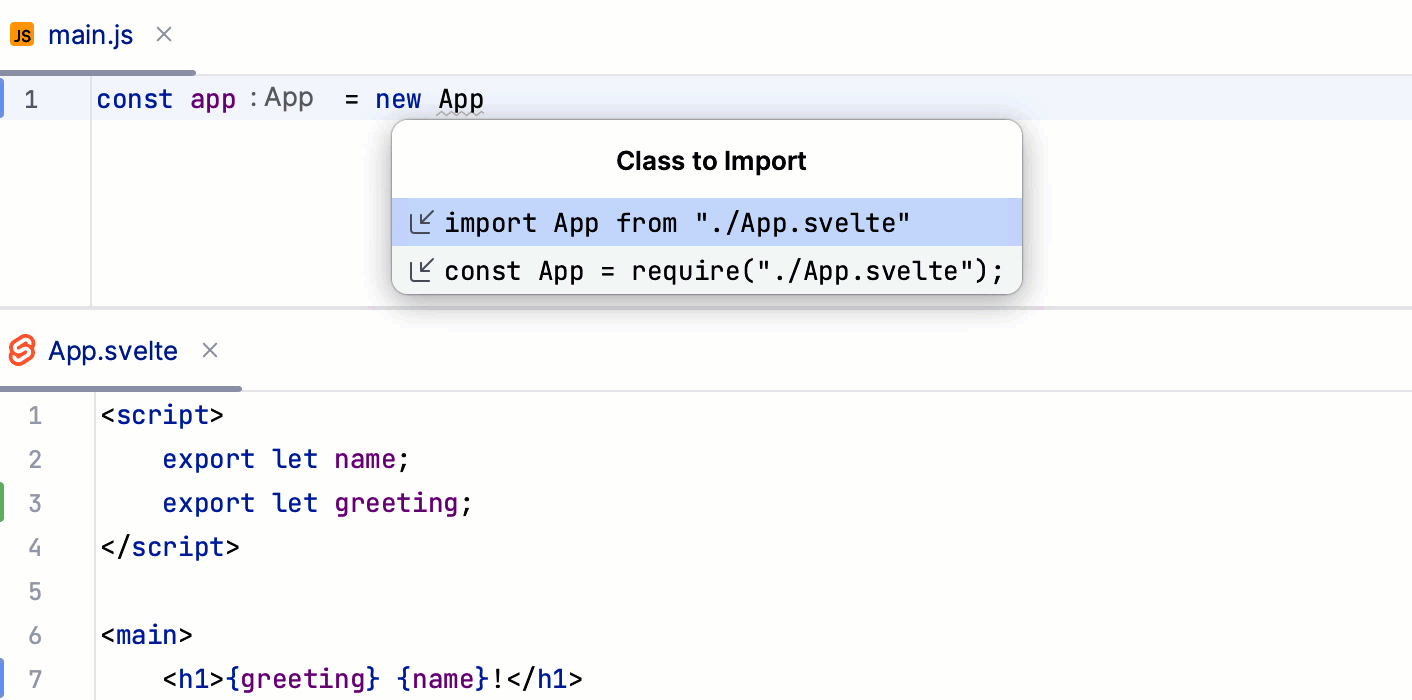
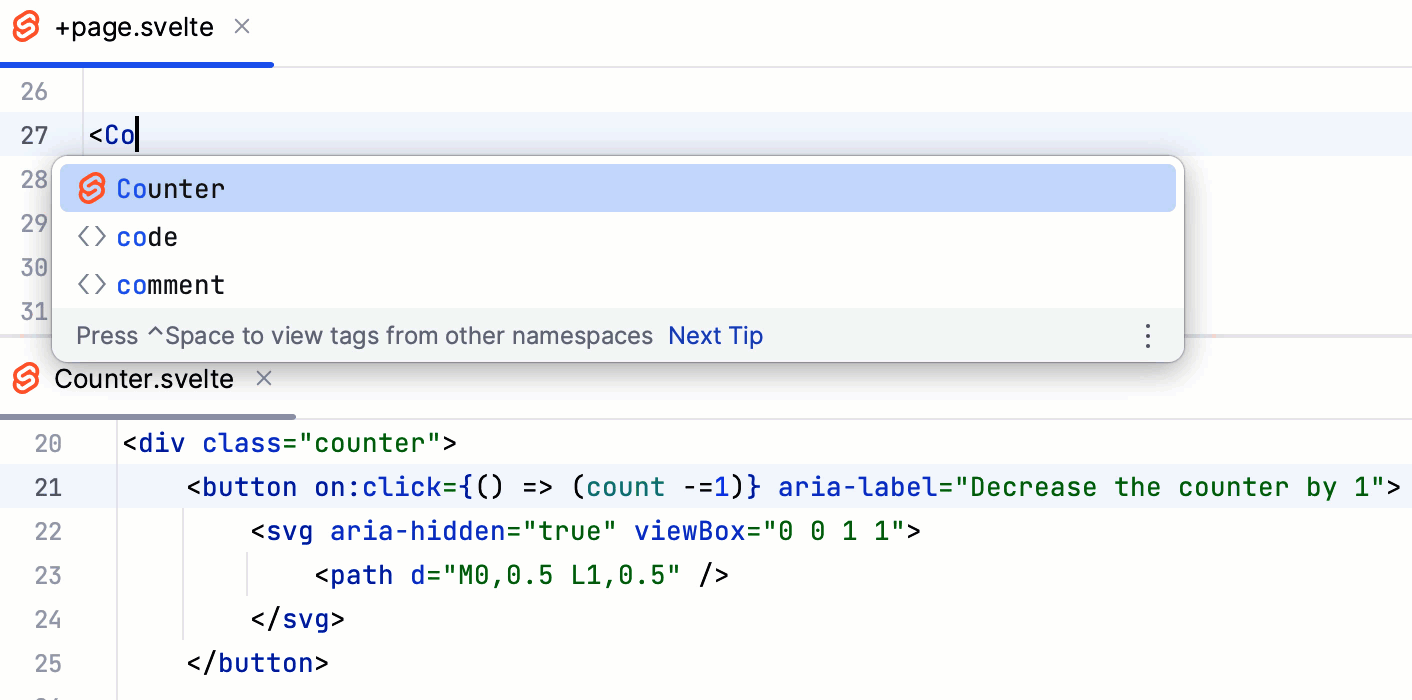
Symbols that have not been imported are marked with an underscore line. To insert an import statement, hover over an underscored symbol, and click the Import <symbol name> link in the popup.


Alternatively, place the caret at the symbol to import, press Alt+Enter, and select Import <symbol name> from the list.
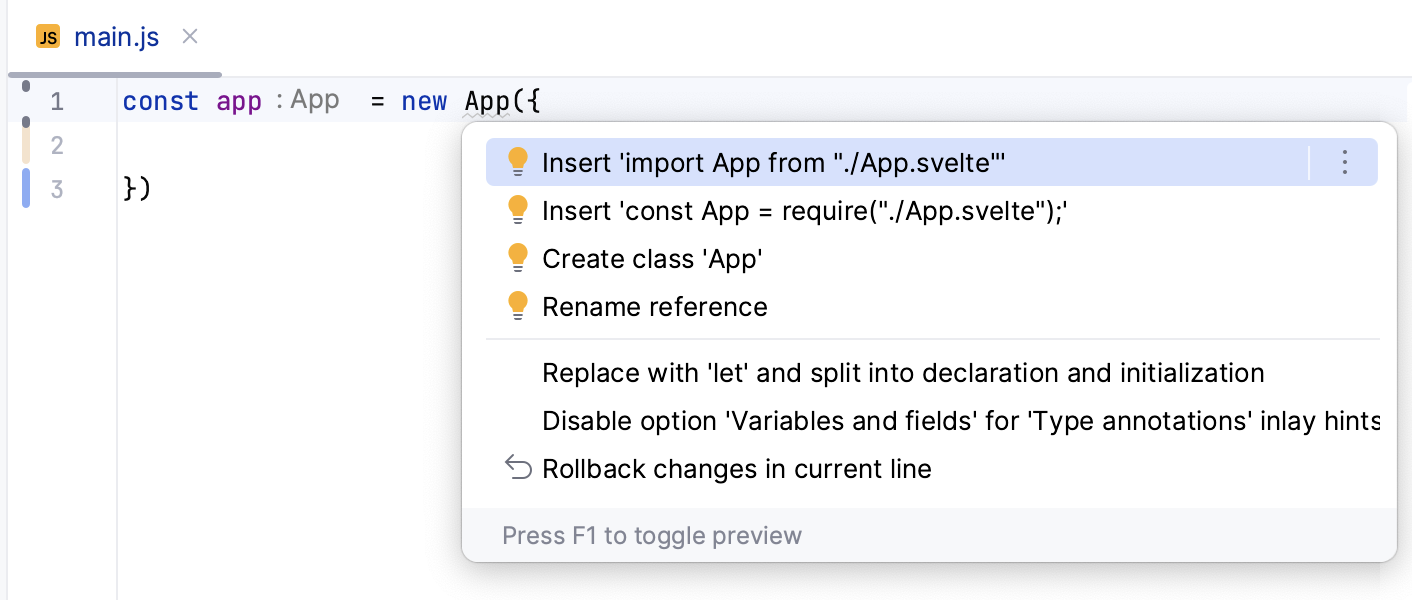

Learn more from Auto import.
Refactoring code
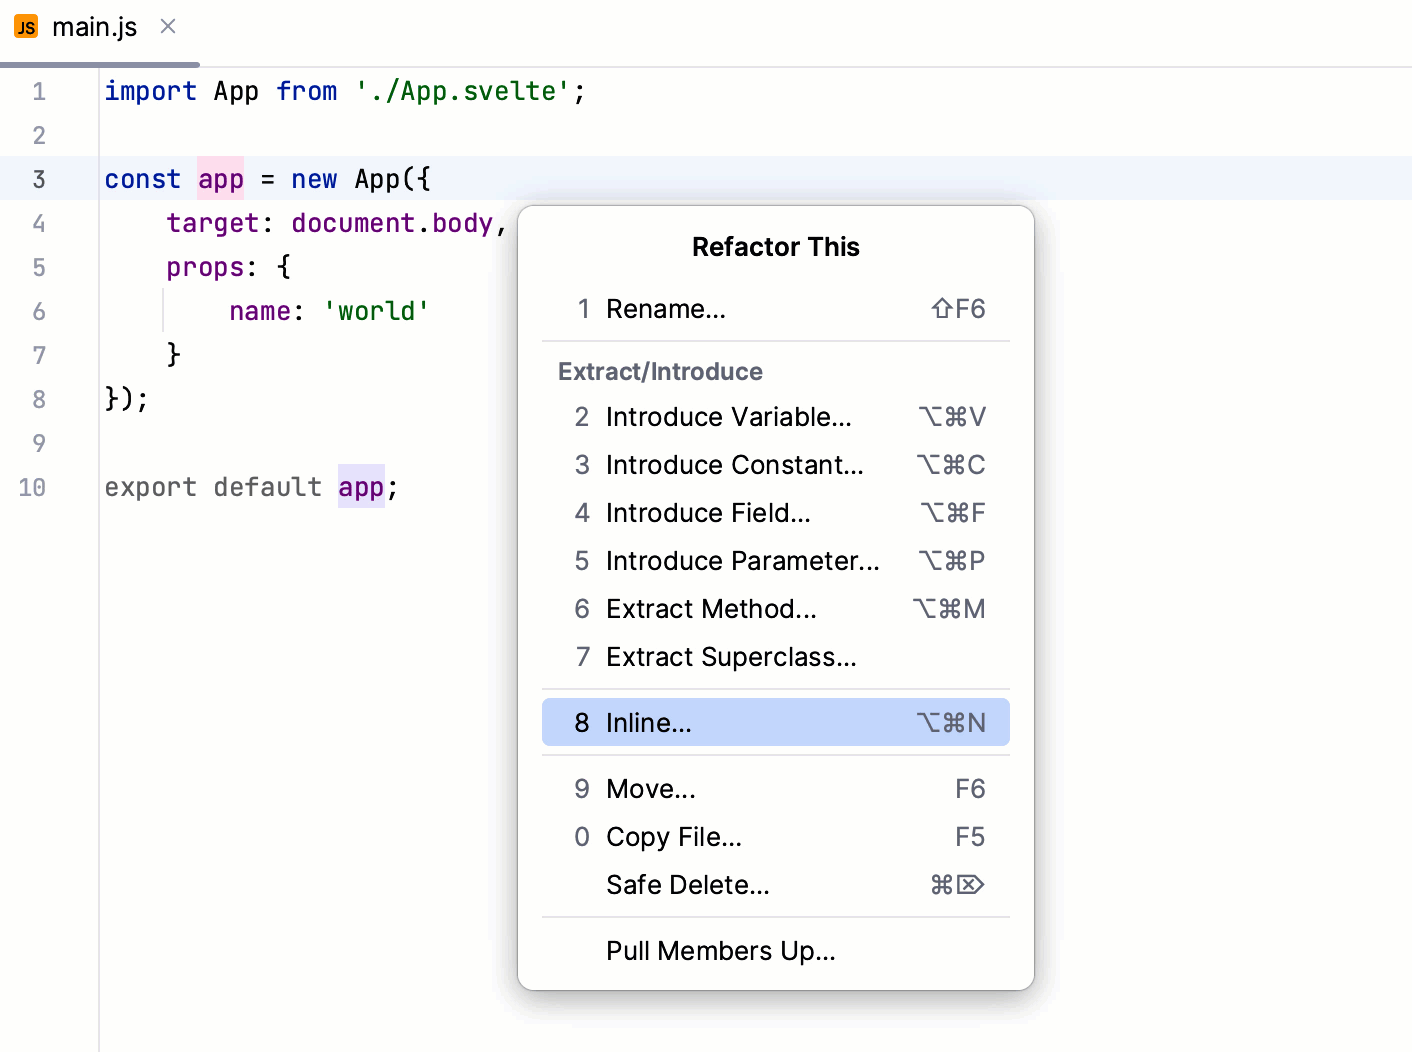
Select a code fragment to refactor or place the caret inside it, press Ctrl+Alt+Shift+T, and select the required refactoring from the list.
Learn more from Code refactoring, Refactoring JavaScript, and Refactoring TypeScript.
Navigate with component usages
Use inlay hints to jump from a component to its usages. If a component is used more than once, WebStorm shows a list of detected usages. Select the relevant usage to jump to it.
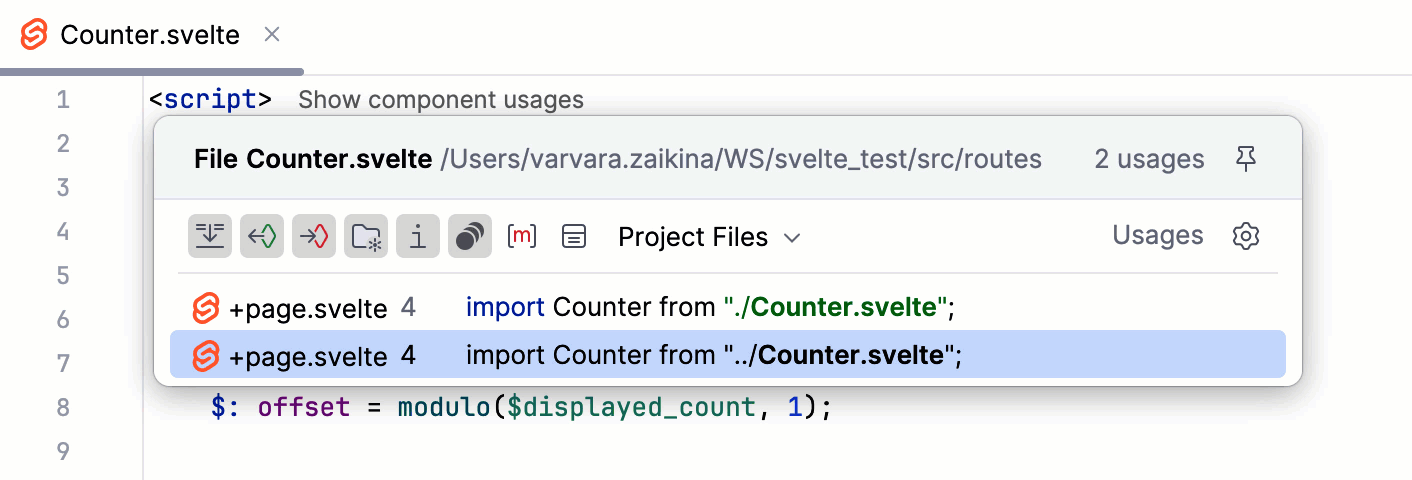
Show component usages hints are displayed by default. To turn them off, press Ctrl+Alt+S to open settings and select Editor | Inlay Hints. Then clear the Component usages checkbox under Code vision.
Alternatively, right-click a Show component usages hint in the editor and select Hide 'Code Vision: Component usages' Inlay Hints.

Run your application
Сlick
in the gutter next to the
devscript in package.json, or runnpm run devin the Terminal Alt+F12, or double-click thedevtask in the npm tool window ().Wait till the application is compiled and the development server is ready.
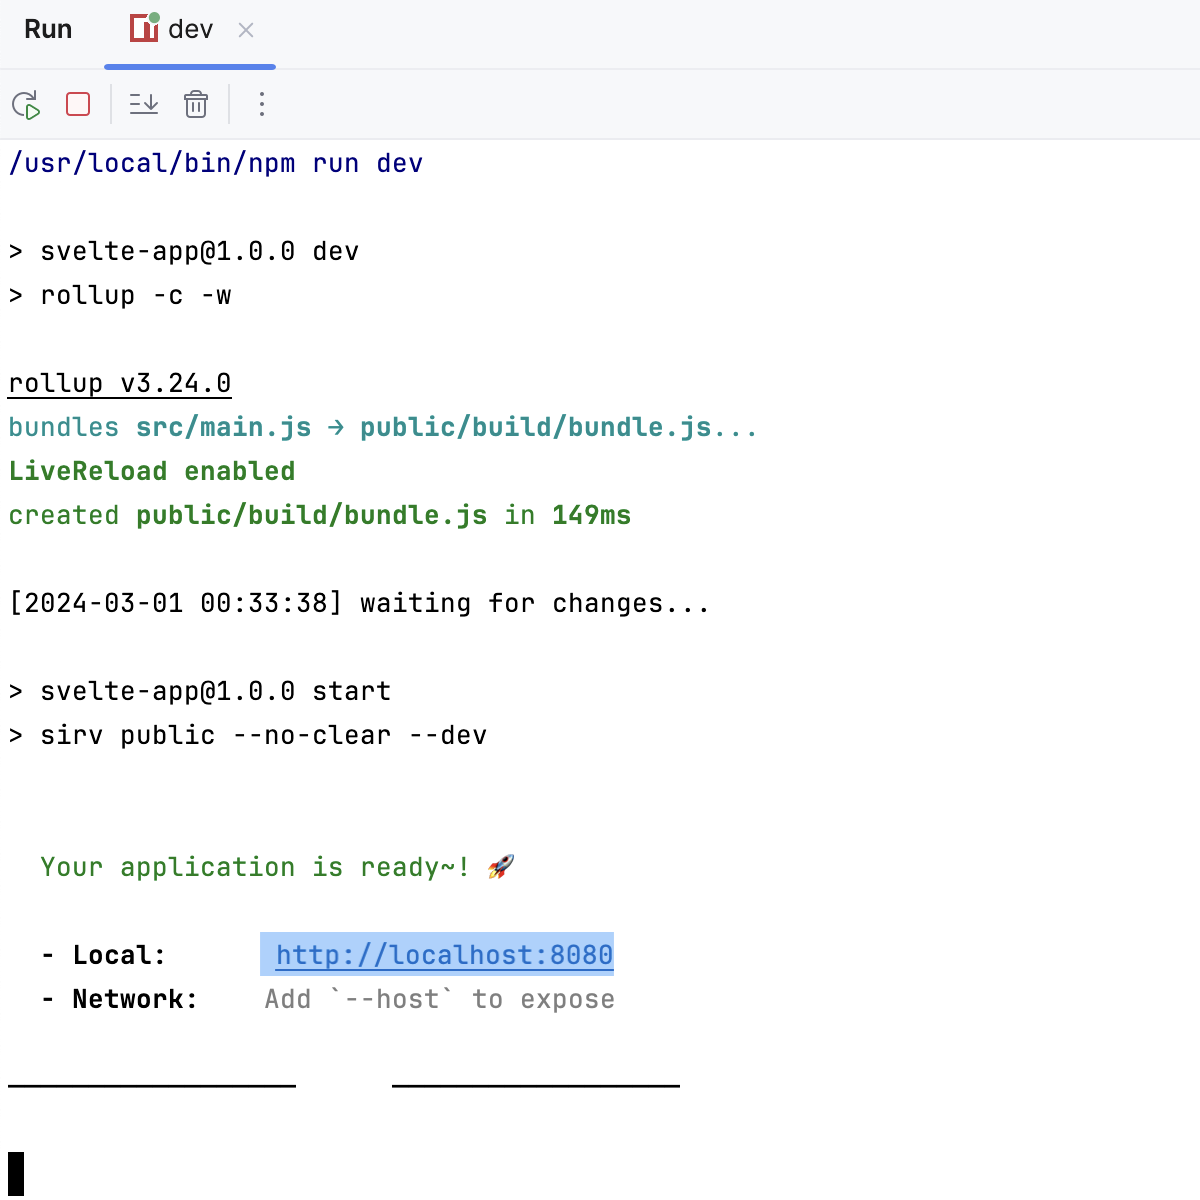
The Run tool window or the Terminal shows the URL at which your application is running. If your application was generated with SvelteKit, the default URL is http://localhost:8080/. Click this link to view the application.
Run a Svelte application via a run/debug configuration
For applications created with SvelteKit in the WebStorm New Project wizard as described above, WebStorm generates an npm configuration with the default name dev. This configuration launches the development server and starts your application in the development mode.
In other cases, you need to create a run/debug configuration with the actual settings, such as, host, port, etc., manually.
Create an npm run/debug configuration
Go to . Alternatively, select Edit Configurations from the Run widget on the toolbar.

In the Edit Configurations dialog that opens, click the Add button (
) on the toolbar and select npm from the list.
In the Configuration tab of the Run/Debug Configurations: npm dialog that opens, specify the location of the package.json, the Node.js interpreter, and the package manager to use.
In the Command field, select run from the list and then select the script to run from the Scripts list. Most likely it will be the default
devscript but you can configure another one in your package.json, for example, to run the application on a custom port.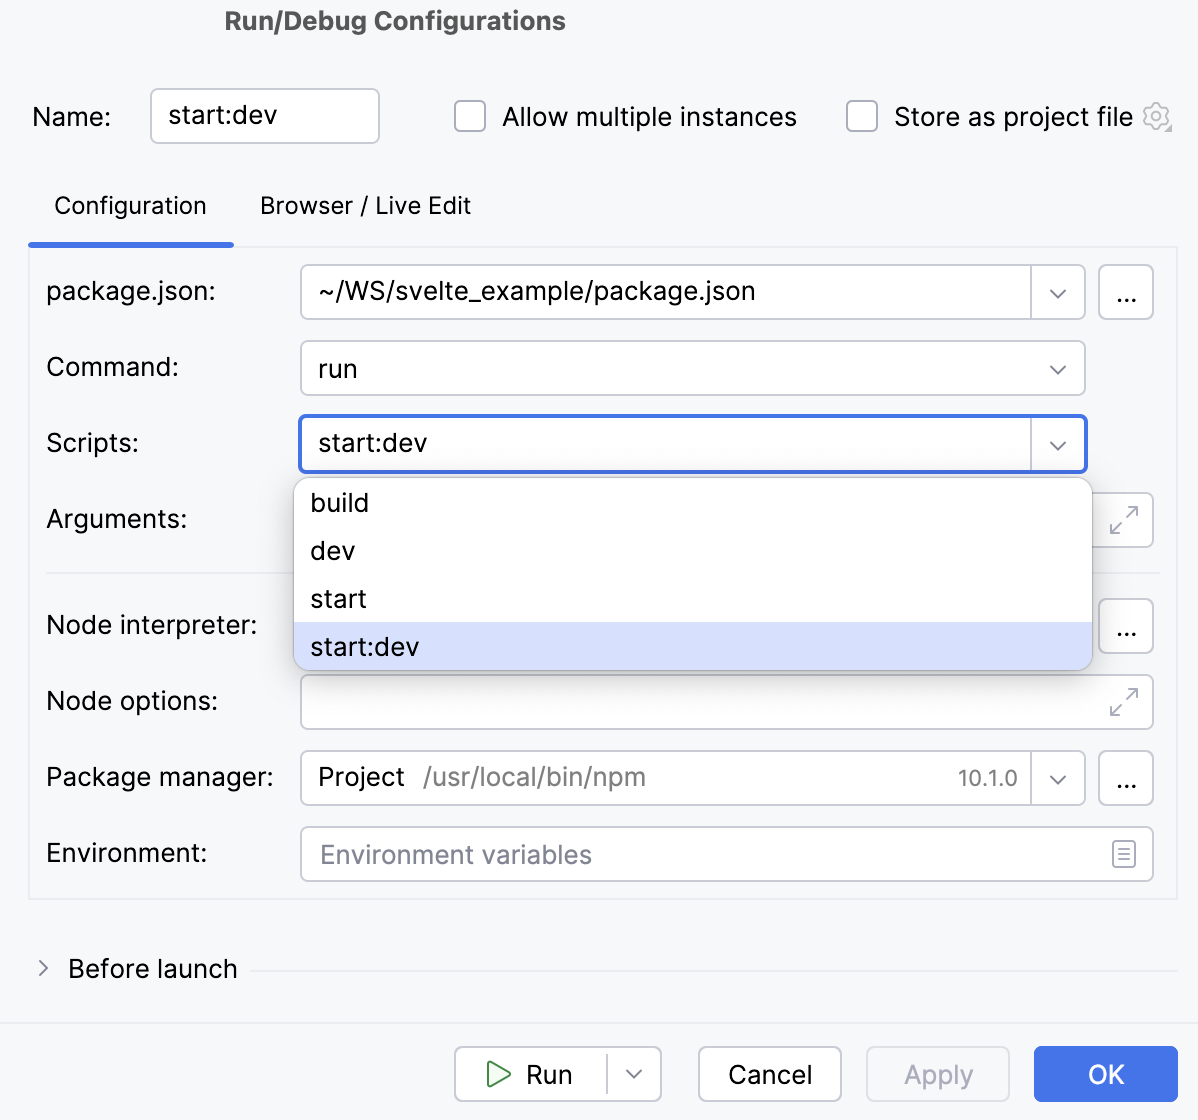
Optionally:
To open the application in the browser, update the configuration as follows: in the Browser / Live Edit tab, select the After launch checkbox, select the browser to open the application in, and specify the URL address at which the application wil run.
If you are going to debug the application, select Google Chrome or another Chromium-based browser.
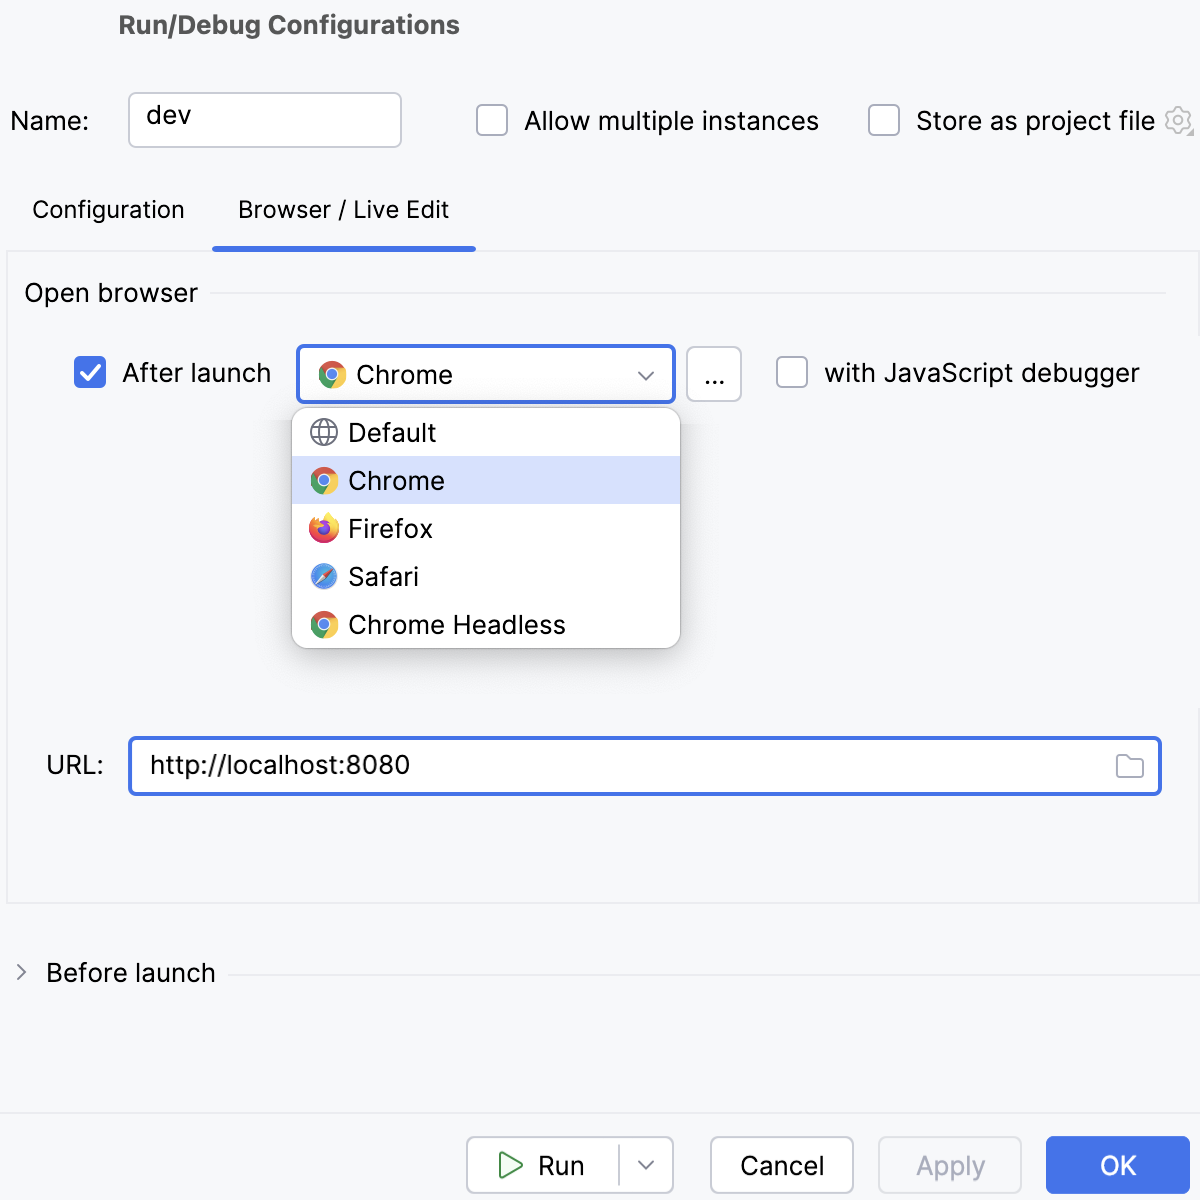
Run an application
From the list in the Run widget on the toolbar, select a run configuration of the type npm. This can be the autogenerated dev configuration or a custom one that you created yourself as described above.
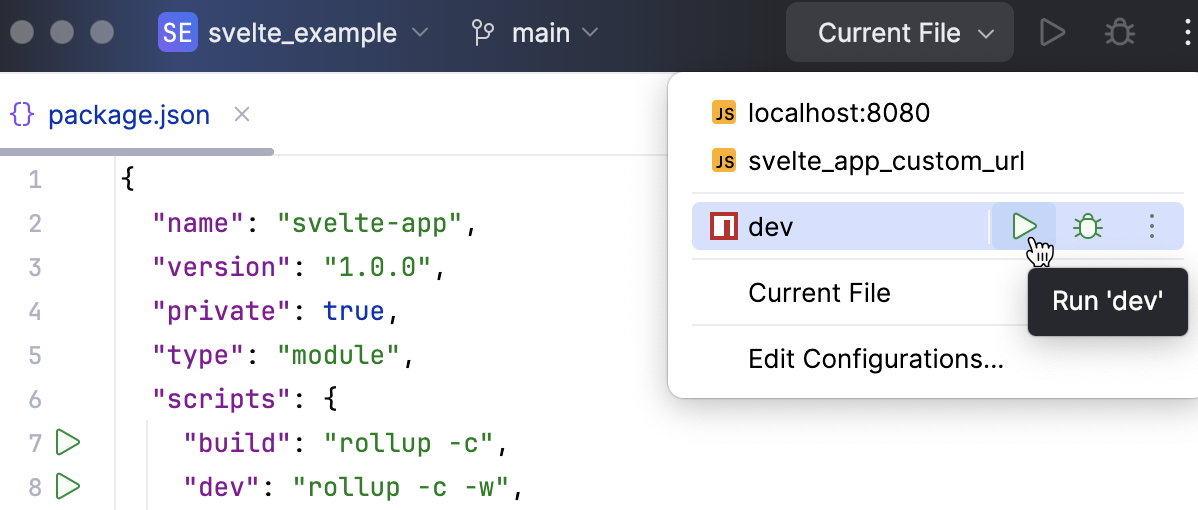
Wait till the application is compiled and the development server is ready.
The Run tool window or the Terminal shows the URL at which your application is running. If your application was generated with SvelteKit, the default URL is http://localhost:8080/. Click this link to view the application.
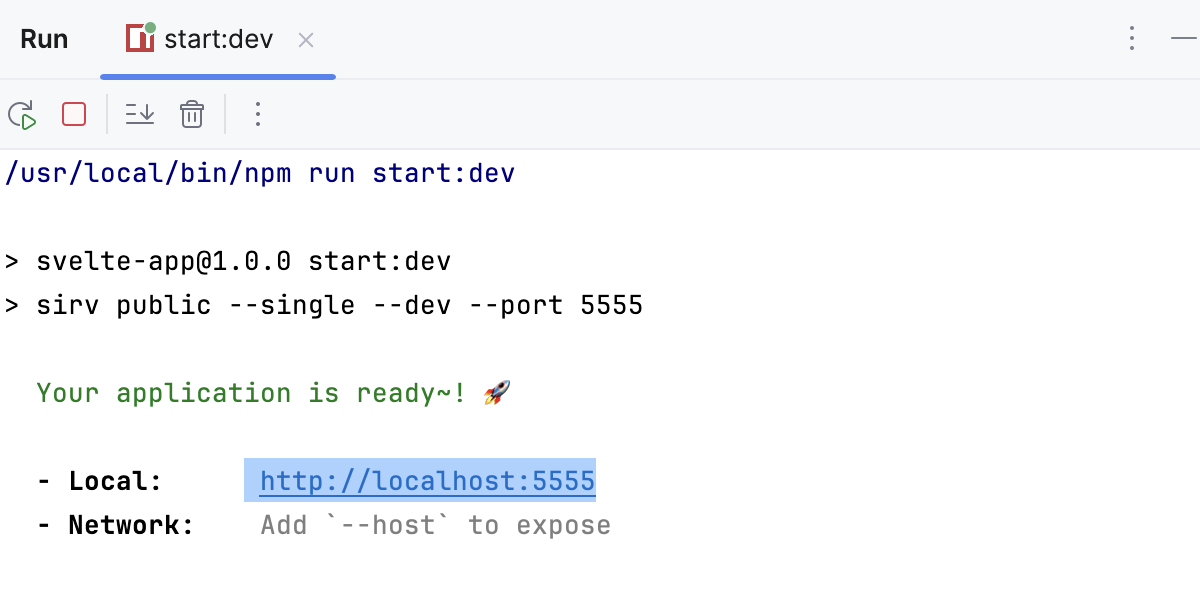
Alternatively, enable WebStorm to open the application on start as described above.
Debug your application
You can start a debugging session either by launching a run/debug configuration or from the Run tool window that shows the URL at which your application is running in the development mode.
Start debugging via a run/debug configuration
To debug your Svelte application you need two run/debug configurations:
An npm configuration to start your application in the development mode, as described above.
A JavaScript Debug configuration to attach the debugger to the application that is running in the development mode.
You can create a JavaScript Debug configuration within the npm configuration to launch them at once, as described in Run and debug a Vite application with an npm run/debug configuration.
Alternatively, create and launch an npm and a JavaScript Debug run/debug configurations separately, as described in Start debugging with a JavaScript Debug run/debug configuration.
Run and debug a Svelte application with a single npm run/debug configuration
Set the breakpoints in your code.
Create an npm configuration, as described above.
If you created your application with SvelteKit, WebStorm has already generated an npm configuration with the default name dev. The configuration is available from the Run widget.
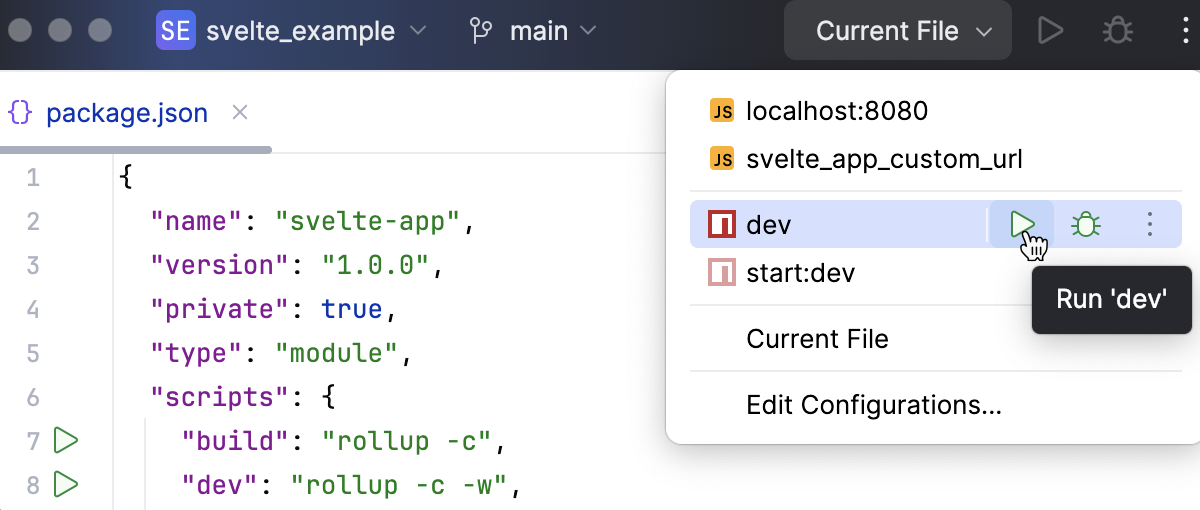
In the Configuration tab of the Run/Debug Configurations: npm dialog that opens, specify the location of the package.json, the Node.js interpreter, and the package manager to use.
In the Command field, select run from the list and then select the script to run from the Scripts list. Most likely it will be the default
devscript but you can configure another one in your package.json, for example, to run the application on a custom port.
In the Browser / Live Edit tab, select the After launch checkbox, select Google Chrome or another Chromium-based browser from the list, select the with JavaScript debugger checkbox, and then specify the URL at which your application will run.
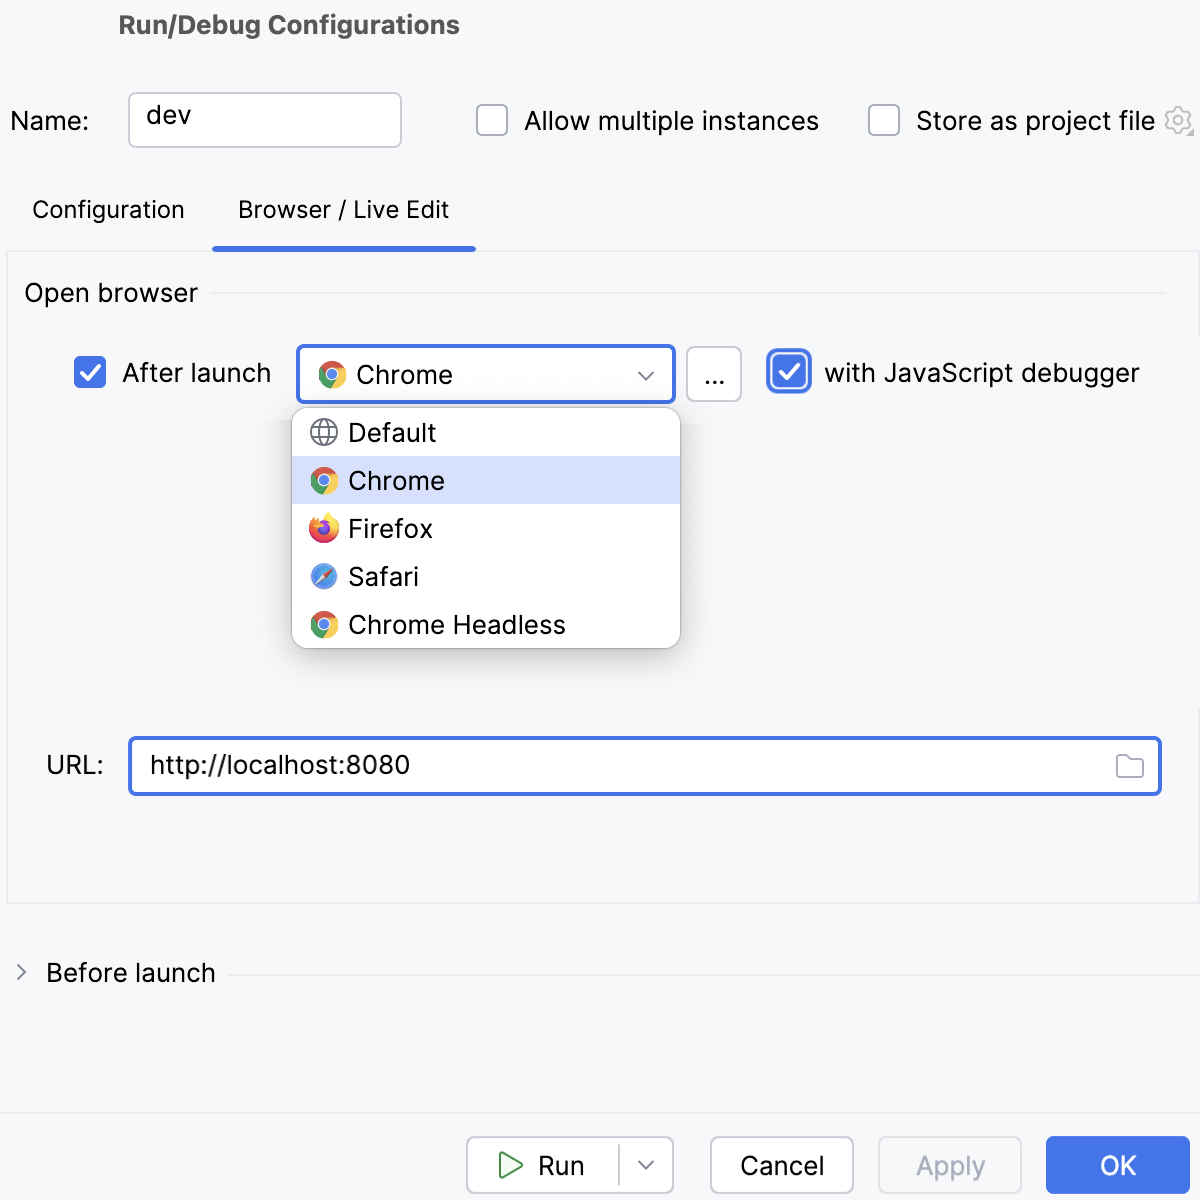
Click Run.
To re-run the configuration, select it from the list in the Run widget and click
next to it.
WebStorm runs the application in the development mode and at the same time launches a debugging session.

When the first breakpoint is hit, switch to the Debug tool window and proceed as usual: step through the program, stop and resume program execution, examine it when suspended, explore the call stack and variables, set watches, evaluate variables, view actual HTML DOM, and so on.
Start debugging with a JavaScript Debug run/debug configuration
Set the breakpoints in your code.
Start the application in the development mode as described above and wait till the application is compiled and the development server is ready.
The Run tool window or the Terminal shows the URL at which your application is running. Copy this URL to specify it later in the JavaScript Debug configuration.
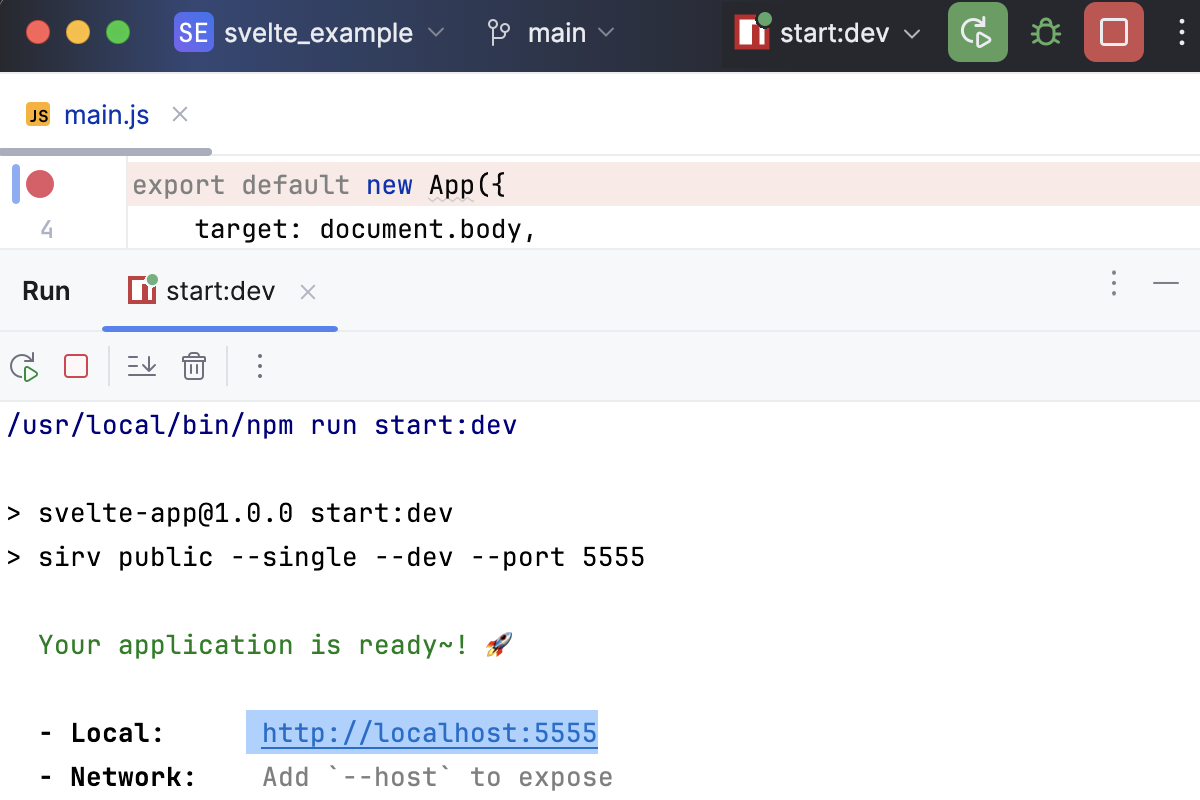
Create a JavaScript Debug configuration. To do that, go to in the main menu, click
, and select Javascript Debug from the list.
In the Run/Debug Configurations: JavaScript Debug dialog that opens, specify the name of the configuration and the URL address at which the application is running in the development mode. You can copy this URL in the Run tool window or in the Terminal, as described above.
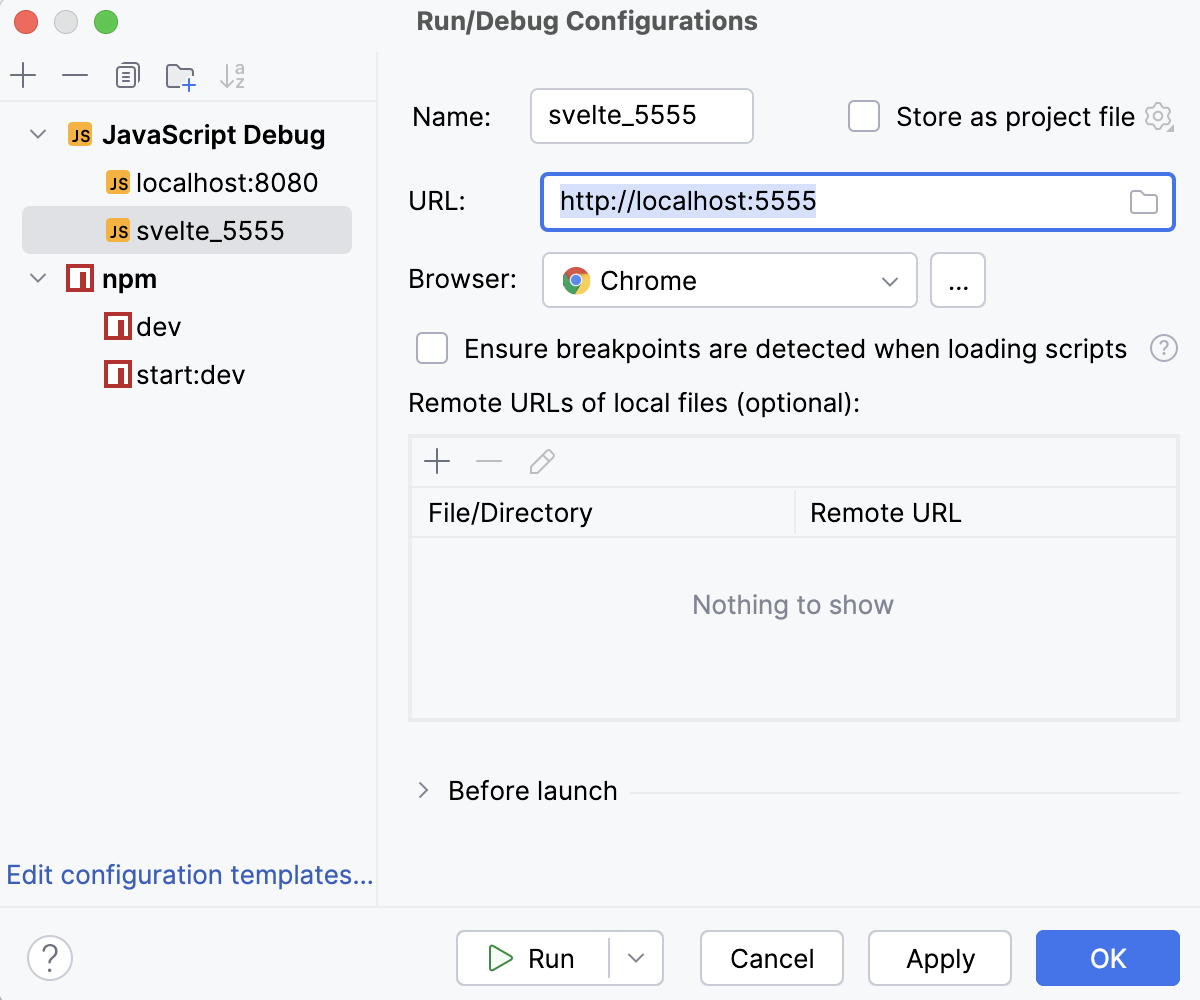
Click Debug.
To re-run the configuration, select it from the list in the Run widget and click
next to it.
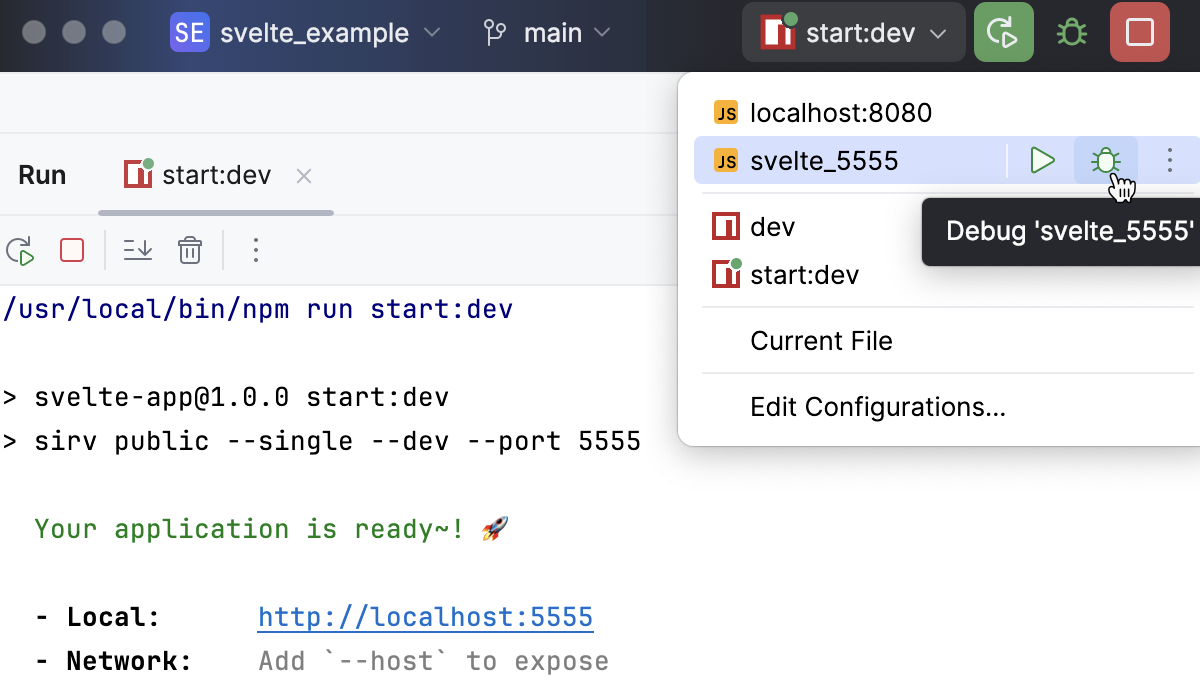
When the first breakpoint is hit, switch to the Debug tool window and proceed as usual: step through the program, stop and resume program execution, examine it when suspended, explore the call stack and variables, set watches, evaluate variables, view actual HTML DOM, and so on.
Start debugging from the Run tool window or from the built-in Terminal
If your application is running in the development mode on localhost, in particular, if it was generated with SvelteKit, you can launch a debugging session right from the >Run tool window or from the built-in Terminal.
Set the breakpoints in your code.
Start the application in the development mode as described above and wait till the application is compiled and the development server is ready.
The Run tool window or the Terminal shows the URL at which your application is running. Hold Ctrl+Shift and click this URL link. WebStorm starts a debugging session with an automatically generated configuration of the type JavaScript Debug.
When the first breakpoint is hit, switch to the Debug tool window and proceed as usual: step through the program, stop and resume program execution, examine it when suspended, explore the call stack and variables, set watches, evaluate variables, view actual HTML DOM, and so on.
Test your application
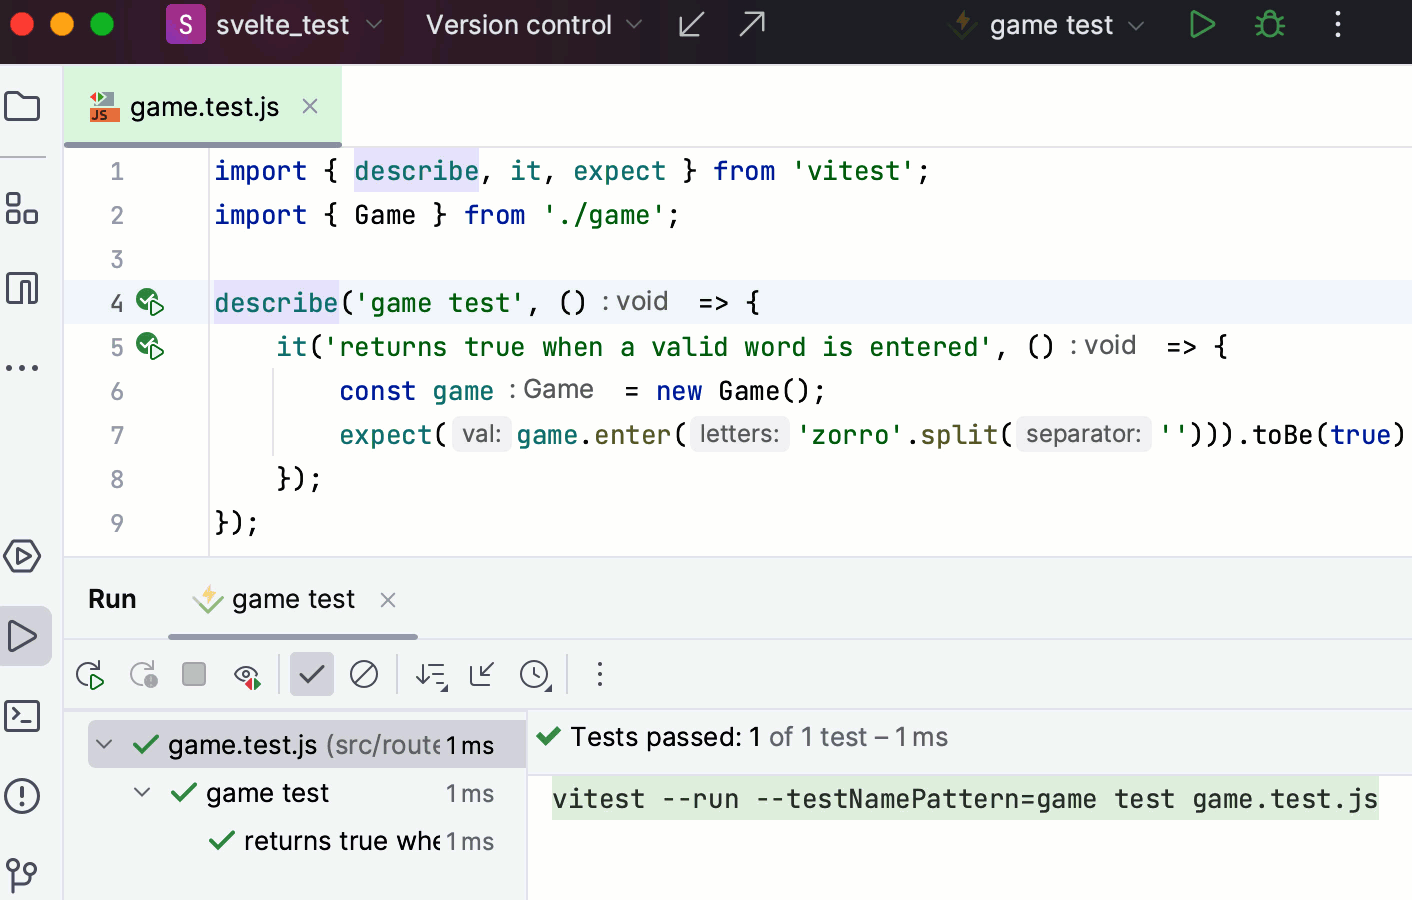
The recommended way to test Svelte applications in WebStorm is to use the Vitest framework.
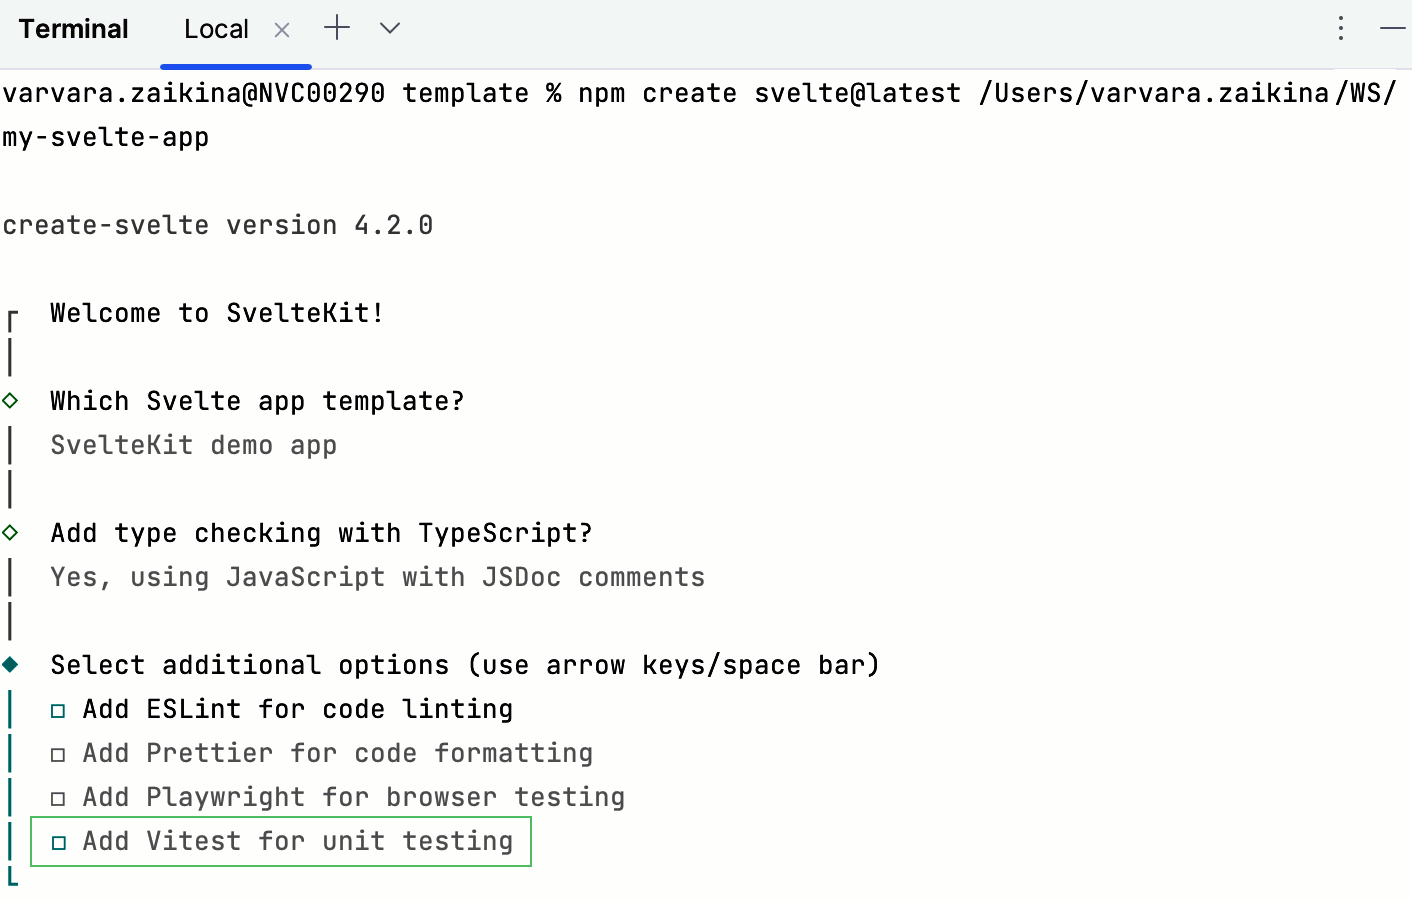
If you create your application with SvelteKit as described above, select the Add Vitest for unit testing option when passing the project generation wizard.
Use several frameworks within a project
Sometimes you may need to use other frameworks within one Svelte project.
To get context-aware coding assistance in each file, create a configuration file .ws-context and specify which framework should be used in each particular file or folder. The settings from this file will override the default configuration.
In the project root, select New | File from the context menu and specify
.ws-contextas the file name.In
.ws-context, use two types of properties:<context-name>with the context value stringA GLOB pattern with a context details object
Use the following context values:
framework:vue,angular,react,svelte,astroangular-template-syntax:V_2,V_17nextjs-project:nextjsastro-project:astrovue-store:vuex,piniavue-class-component-library:vue-class-component,vue -property-decorator,vue-facing-decoratorjsdoc-dialect:jsdoc-typescript,jsdoc-closure
Use path nesting for simplicity.
The last segment of a GLOB path is the file name pattern, it only supports the
*wildcard.If the last segment is a
**it matches all nested directories and files.Top level context properties should have the
/**pattern.
When several patterns match the same file name, the following rules are used for disambiguation:
Choose the pattern with maximum number of path segments, excluding
**segments.Choose the pattern that is a pure file name pattern, which means that it does not end in
**or/.Choose the pattern that was defined first.
Example
Suppose you have a project with a number of frameworks used in various folders.

To get context-aware assistance for each file in the project, add the following code to .ws-context: