Explore test results
While the tests are running in WebStorm, the test execution is shown in the Run tool window on a tab for that run configuration. When the test execution is finished, you can look at the test results in that tab.
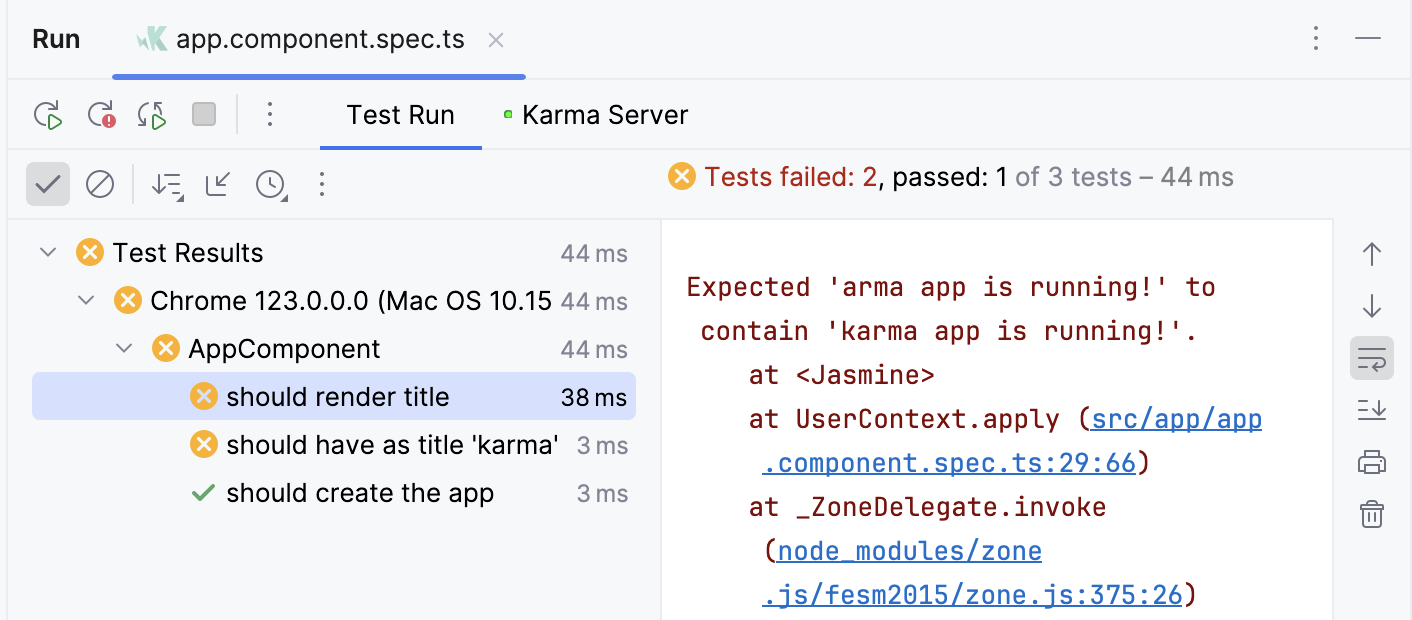
The console on the right shows the output of the current test session. It allows you to see the detailed information on the test execution and why your tests failed or were ignored.
The test results toolbar located above the list of test results allows you to show and hide successful and ignored tests, display how much time it took to run each test, export, import, and sort test results.

Next to each test on the run configuration tab, the IDE shows the test status icon:
Icon | Description |
|---|---|
Test error. This status is assigned to tests that caused an exception from the tested source code. | |
Test failed. If at least one child test fails, all its parent tests are marked as failed. | |
Test ignored. | |
Test in progress. | |
Test passed successfully. | |
Test terminated. This status is assigned to tests that were stopped. If at least one test receives this status, then all unfinished tests and their parent tests are marked as terminated. |
Sort and filter test results
Use the following options on the test results toolbar if you want to focus only on the failed tests or if you want to reorganize test results.

Disable the
Show Passed option to hide successful tests.
Disable the
Show Ignored option to hide ignored tests.
Click
and select how you want to sort the test results:
Suites Always on Top: display suites on top.
Sort Alphabetically: sort test results alphabetically.
By Declaration Order: sort test results in the order in which the tests are declared in the code.
Sort By Duration: place test nodes on top of the list.
Track test execution
In WebStorm, you can monitor the execution of the current test. If a test suite contains multiple tests, the list of tests expands to show test methods as they run one by one.
To monitor test execution, click
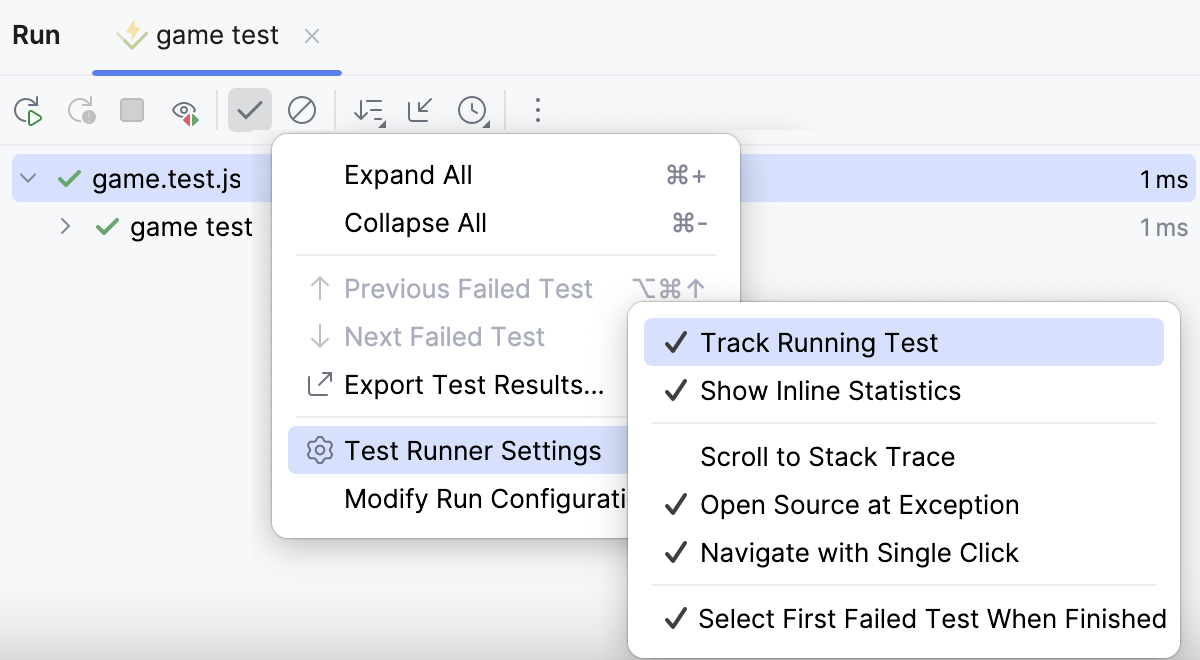
More on the toolbar and navigate to . Ensure that Track Running Test is selected.
Manage test results
Click
on the test results toolbar and select Test Runner Settings and enable the following options:
Track Running Test: monitor execution of the current test.
Show Inline Statistics: view the execution time for tests.
Scroll to Stack Trace: if a test produced a lot of output (for example, logging) before failing, this option automatically scrolls the output console to the assertion failure once you select the test on the run configuration tab.
Open Source at Exception: if you double-click a failed test method on the run configuration tab with this option on, the editor will scroll to the line on which the exception was thrown (instead of scrolling to the test method declaration).
Navigate with Single Click: open the code for the selected test automatically in the editor.
Set Auto Test Delay: point to this node to reveal the list of available delays between file saving and rerunning tests. The selected value gets the check mark.
Select First Failed Test When Finished: automatically select the first failed test in the list upon completing the test session.
View statistics
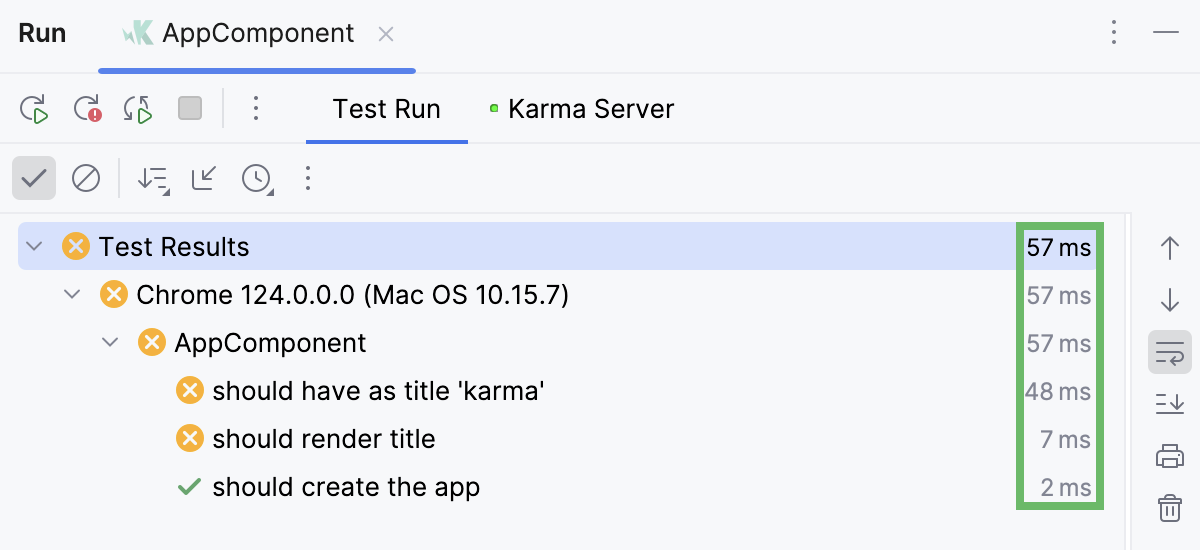
To view the execution time for tests, click
on the test results toolbar, then select Test Runner Settings and enable the Show Inline Statistics option.
Jump to test declaration
Select the necessary test from the list on the Test Runner tab and press F4. Alternatively, right-click the test and select Jump to Source.

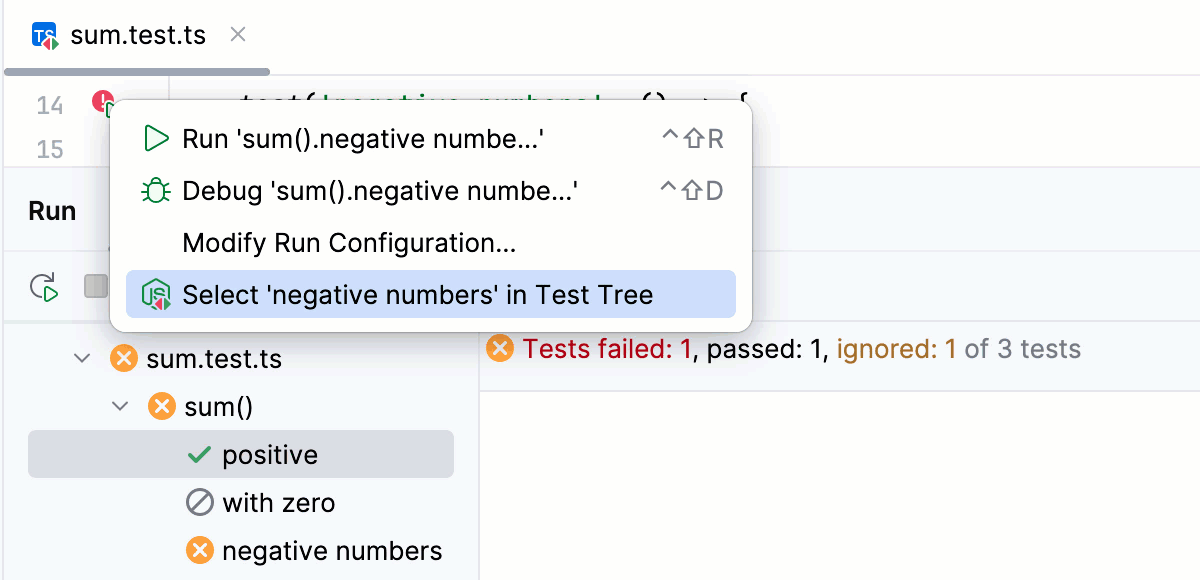
Jump to test result
Click
,
or
in the gutter and select Select '<test name>' in Test Tree from the list.
View assertEquals difference
If a unit test contains string assertEquals failures, the IDE allows you to compare the strings and view the differences.
Right-click the necessary test and select from the context menu.
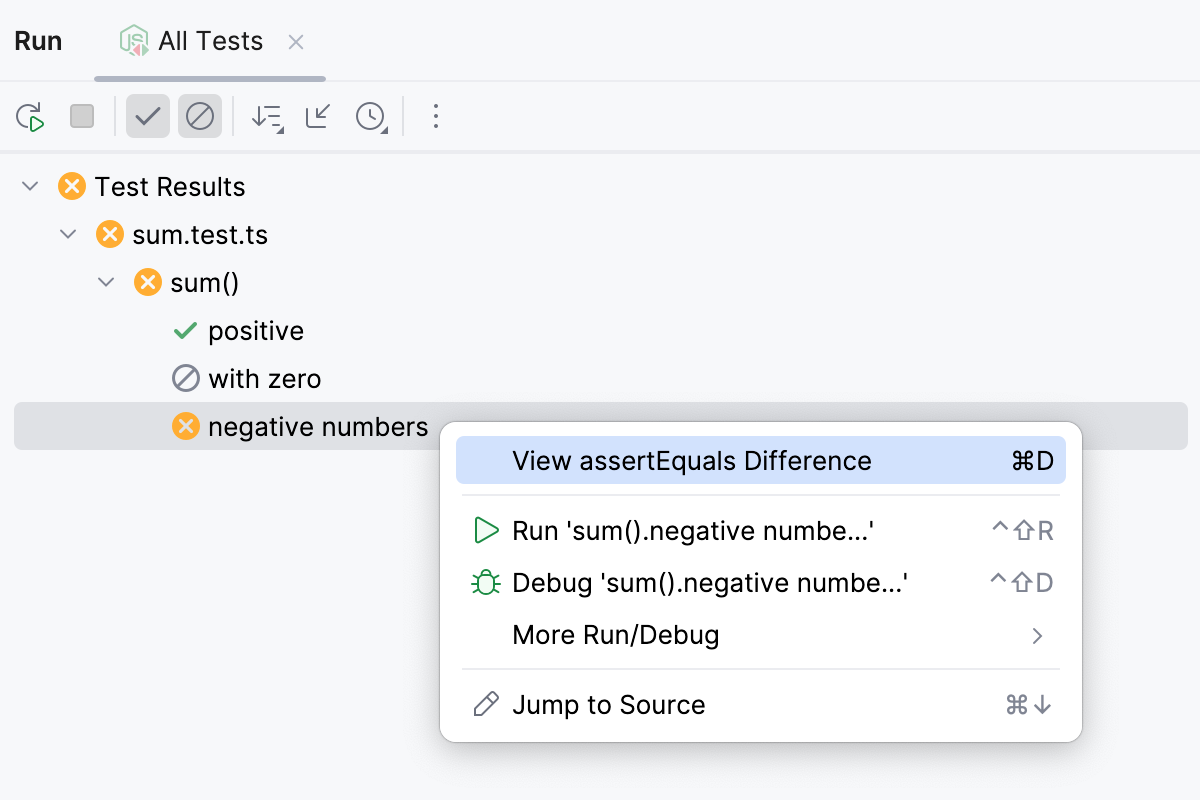
Alternatively, use the Click to see difference link in the console on the right.
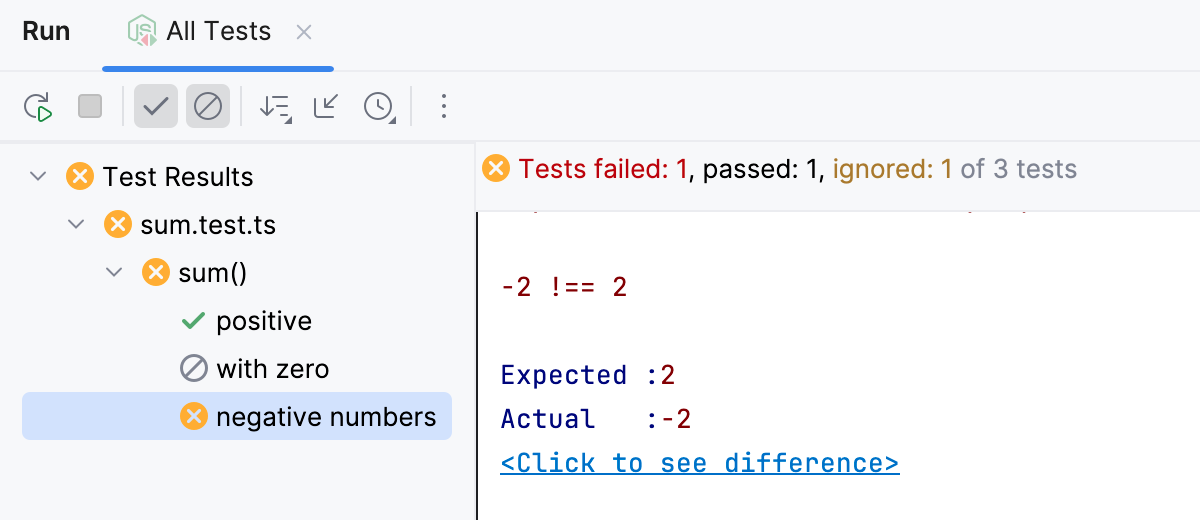
Compare strings in the dedicated Diff Viewer.

View results of previous tests
WebStorm automatically saves results of the last 10 test sessions. To open the list of recent test sessions:
Click the
icon on the test results toolbar and select the necessary test session from the list.
For each test session, the list displays the run configuration name and a timestamp:
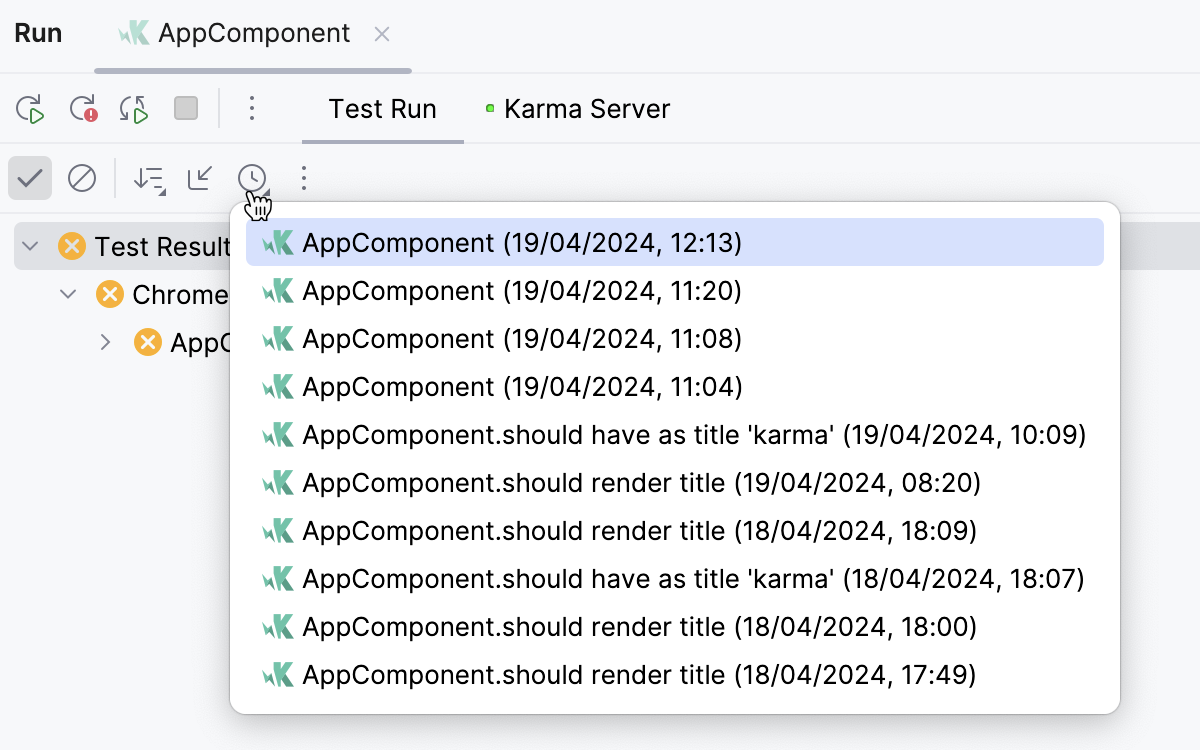
You can also export test results to a file if you want to keep them or share with your team.
Export and import test results
Export test results to a file
Click
on the test results toolbar, then click
Export Test Results.

Select the format in which you want to save the file:
HTML: generate an HTML file from a pre-defined template.
XML: use this format if you want to import this file later to WebStorm.
Custom, apply XSL template: use your custom XSL template to generate an HTML file from the raw XML output. Click
next to this option and select the *.xsl code style definition file.
Specify the name of the output file and its location.
If you want to open the file in your browser after you export it, select the Open exported file in browser checkbox. Click OK.
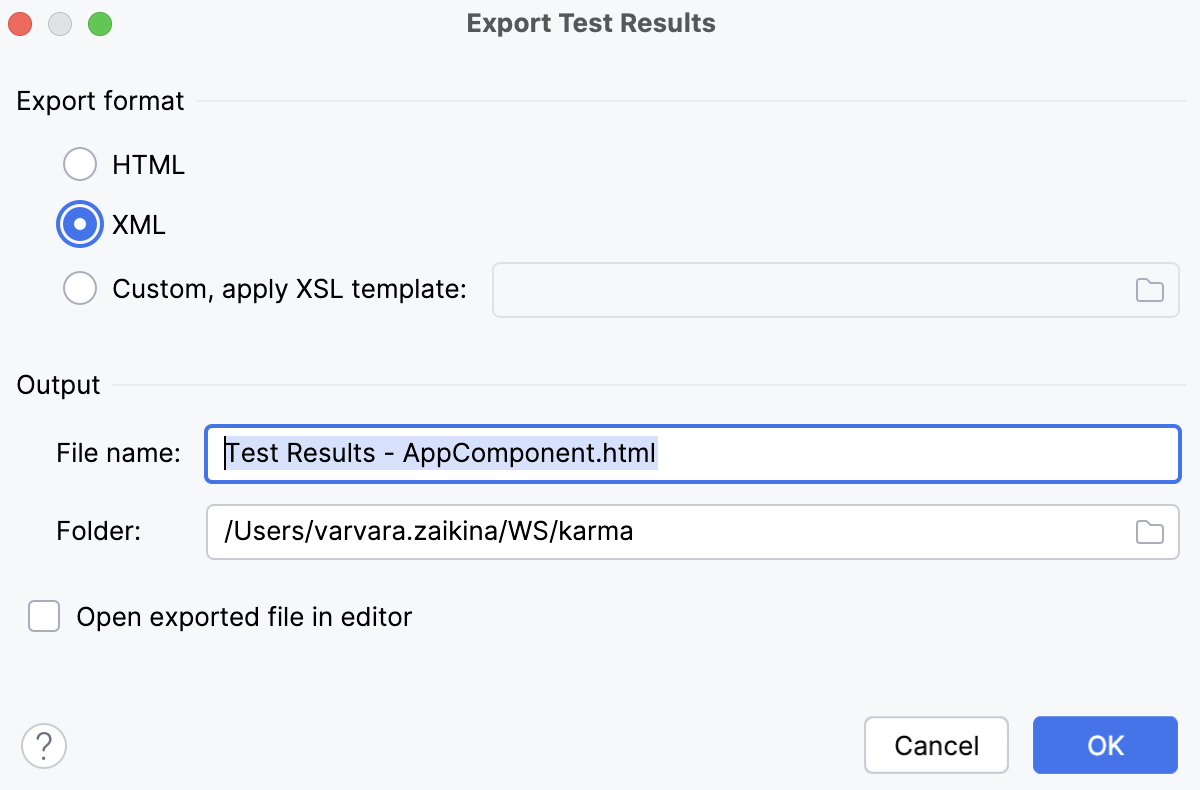
Import test results
To load a previously exported file, click
on the test results toolbar.

If you have not run any tests yet, and the tool window with the test results toolbar is not available, press Ctrl+Shift+A and type
Import Tests from File.
In the file system dialog that opens, select the .xml file with test results and click Open.