Create and Use a Gantt Chart
Gantt charts are the perfect tool for planning initiatives and tracking progress toward your goal. Set start dates, add finish-to-start dependencies, and enforce resource constraints, so you know exactly how long it will take to finish your efforts. Once your project is underway, you can schedule and assign tasks without losing sight of the bigger picture.
Permissions
Any user who has the Read Issue permission in a project can create a Gantt chart. As long as you have permission to read issues, you can create a chart and monitor the progress of issues in the project. For example, users with the default Issue Reader role in a project can create a chart and use it to track issues. However, this role has a limited set of permissions. Their ability to interact with issues on the chart is restricted.
Gantt charts are designed for active scheduling and management of project activity. To use the chart effectively, you need to have the Update Issue permission in any project where you want to place its issues on the timeline.
If you want to add issues directly to the chart as you update the project plan, you need to have the Create Issue permission.
To let other users view and use the chart, you need to have the Share Tag, Saved Search, Agile Board, or Gantt Chart permission.
Create a Gantt Chart
Any time you want to map out the next steps for a project, you can create a dedicated Gantt chart to track your efforts. It doesn't matter whether you use the chart to track all the issues in your project or not. Your fastest track to completion usually requires that you focus in on a specific goal and avoid distractions.
In any case, the decision to include or exclude any issue in your project plan is entirely up to you.
To create a new Gantt chart:
Click the Gantt Charts link in the header.
Click the New Chart button.
The New Gantt Chart dialog opens.
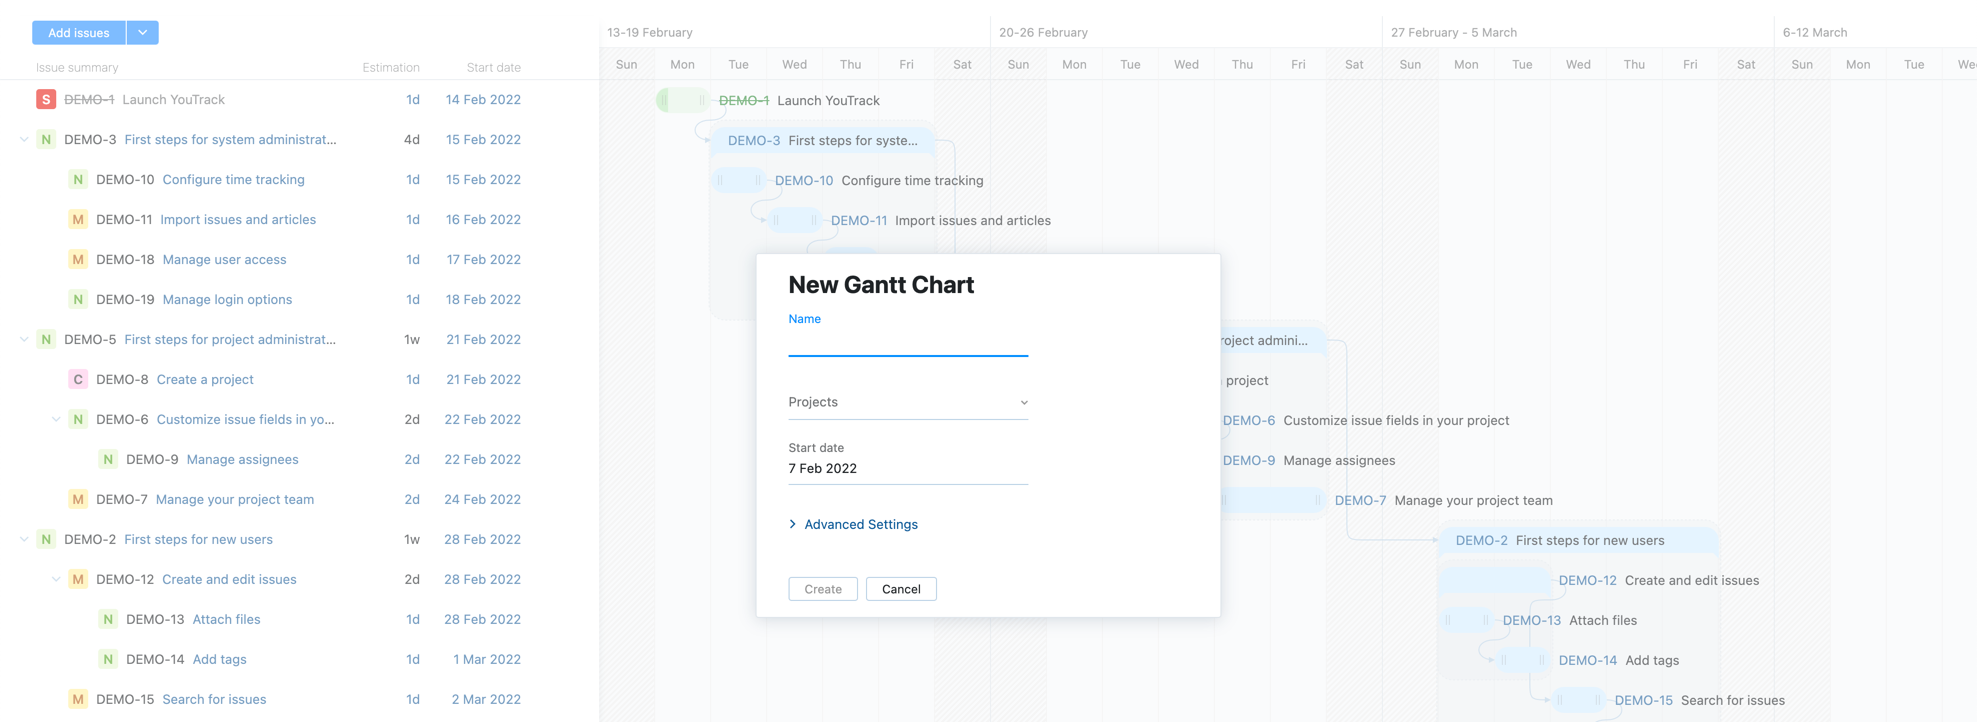
Enter values for the following settings:
Setting
Description
Name
Enter a name for the new chart.
Projects
Add the projects where the activity you want to track on the chart take place. This setting determines which projects are considered when issues are created directly on the chart as well as the list of existing issues that can be added to the chart.
The list is filtered to show projects where you have been granted the Read Project Basic permission.
Start date
Select the date when you plan to launch the project. This setting determines which start date is assigned to issues when they are added to the chart and is used as the starting point for the entire project plan.
The current date is set as the default value.
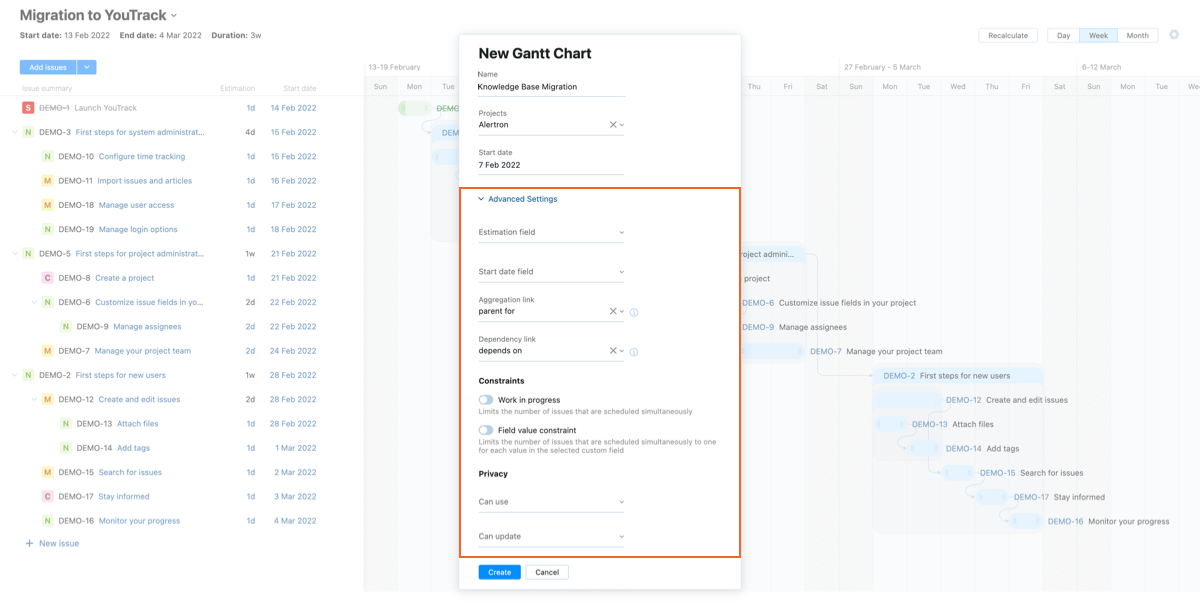
If you want to customize any of the default settings, click to expand the Advanced Settings.
Otherwise, click the Create button and start working on the schedule for your project plan.
You can always update the settings for your chart at a later time from the Chart Settings menu in the toolbar.
To customize the defaults, enter or update values for the following settings:
Setting
Description
Estimation field
Select the custom field that you use to store estimations in your project or projects. The values stored in this field are used to track the estimations for subtasks on the chart. The estimated duration of parent tasks is also derived from the values that are stored in this field for subtasks. You can select a field that stores an integer, period, or float data type.
If you don't select an estimation field, the estimated duration of each task is represented by the length of each bar on the chart. These estimations are stored exclusively in the Gantt chart and are not represented anywhere in the underlying issues.
Avoid custom fields that are only shown when certain conditions are met. Otherwise, you may end up with tasks that are missing estimations and the chart will fail to calculate properly.
Start date field
Select the field that stores the start date for issues in your project or projects.
If you don't select an estimation field, the start date for each task is represented by its position on the horizontal axis of the chart. These start dates are stored exclusively in the Gantt chart and are not represented anywhere in the underlying issues.
Avoid custom fields that are only shown when certain conditions are met. Otherwise, users may be unable to set the start date for tasks on the chart.
Aggregation link
Select the issue link type that represents the relationship between parent tasks and their subtasks in your project. The link type parent for is selected by default. The list is filtered to display only outward names of aggregation link types.
Dependency link
Select the issue link type that represents the relationship between predecessor and successor tasks in your project. The link type depends on is selected by default. If you use another link type to show dependencies, select the inward name of a directed link type.
If you want to enforce resource constraints in your project plan, enable and configure either or both the following settings:
Setting
Description
Work in progress
If you want to limit the amount of work in progress on a daily basis, enable this option. The value corresponds to the number of issues that can be scheduled simultaneously. Use this setting to measure how much time is required to finish the estimated tasks when resource constraints limit the number of tasks that can be performed at the same time.
When enabled, use the Capacity setting to specify the maximum number of issues that should be in progress at any time.
Field value constraint
If you want to limit the number of issues that are scheduled simultaneously for a single value in a specific field, enable this option.
Use this setting to limit the number of issues in progress for each member of your team, which would typically be stored in the Assignee field. You can also limit the number of issues by subsystem, priority, or type.
When enabled, use the Field setting to determine which field is used as the value constraint.
For additional information, see Manage Constraints.
If you want to share the chart with your colleagues, update the Privacy settings.
Setting
Description
Can use
To share the chart with other users, select one or more users, groups, or teams from the list.
When this setting is undefined, the chart is only visible to you.
Can update
To let other users update the chart settings, select one or more users, groups, or teams from the list.
When this setting is undefined, you are the only one who can view and edit the chart settings.
When you're happy with the configuration, click the Create button.
Add Issues to the Chart
When you create a new chart, you are shown a blank slate. Even though you chose which projects you wanted to work with in the chart settings, the tasks that you want to include in this initiative are still undefined. To flesh out the project plan, you can either create new tasks directly on the chart or find existing issues and add them all at once.
To build a list of tasks directly on the chart:
Click the New issue link in the sidebar.
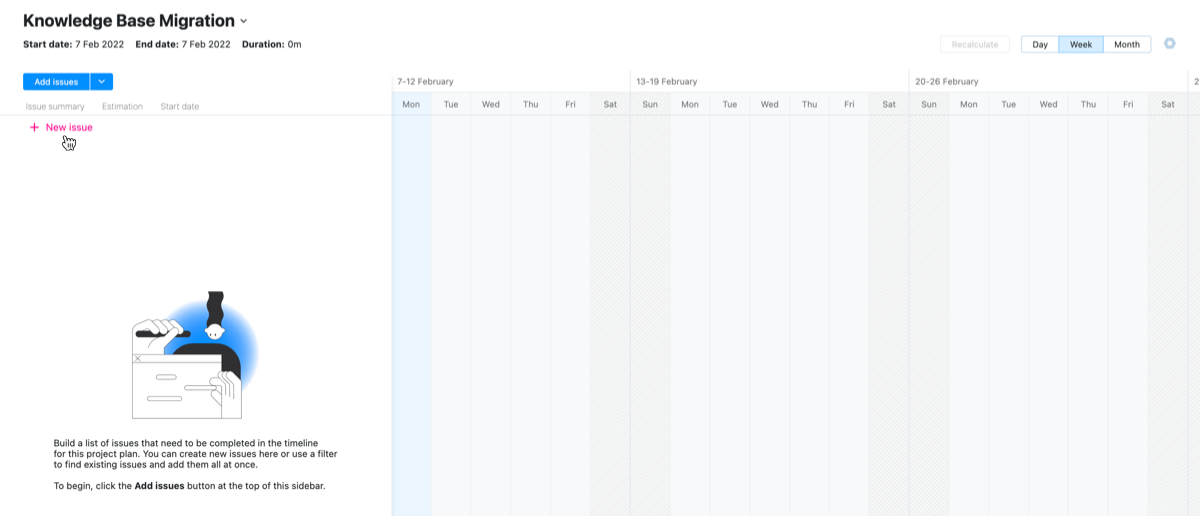
Enter a summary for the first issue that you want to add to the chart.

Press the Enter key or click the Create issue icon.
Continue adding issues until you reach the task that represents the final step in the project plan.
If you want to add subtasks to any of the items in your list, click the Create a new subtask icon and add them in a similar way.
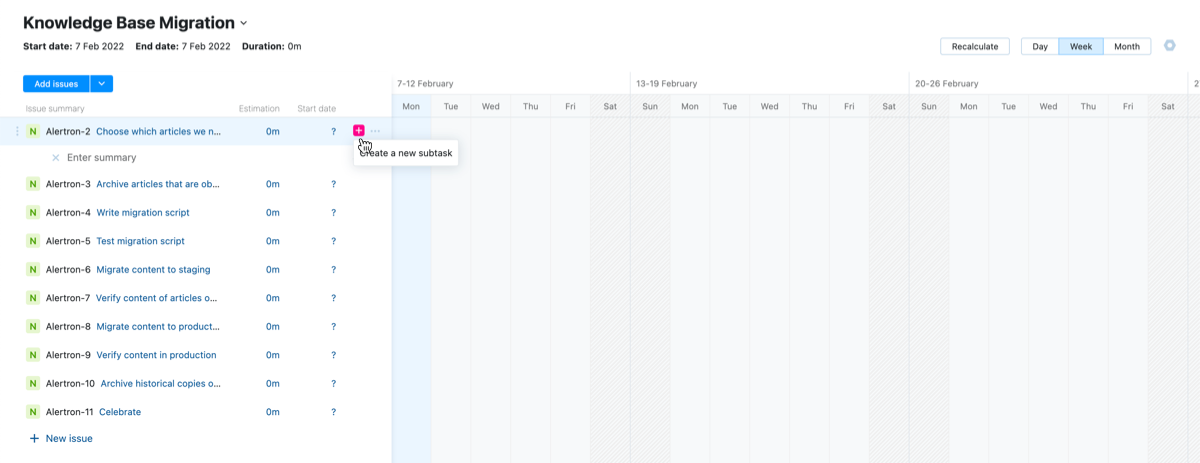
When done, you can go through each issue and set the values for the estimation and start date to plot each issue on the timeline.
Projects don't always spring up out of nowhere. If your team has already compiled a list of issues you'd like to tackle as a singular initiative, you can add them all at once and use the chart to plot the path to your goal.
To add existing issues:
From the Add issues button in the toolbar, choose the Find existing option.

Enter a search query in the input field to find issues that you want to add to the chart.
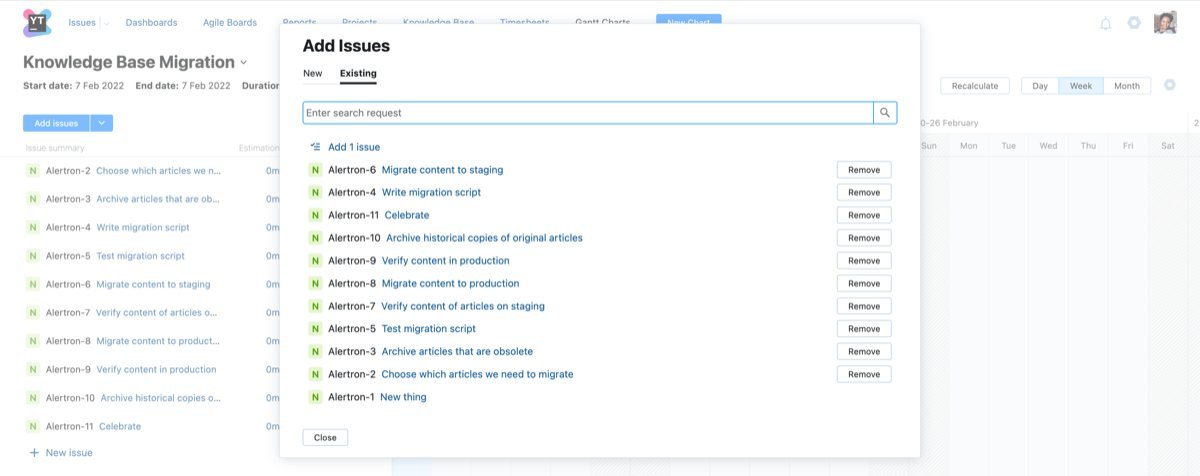
Use the option at the top of the list to add all the issues that match the query. Otherwise, you can add single issues by clicking the Add issue button for each of the issues that you want to add to the chart.
When done, click the Close button.
Even the best-laid plans can go astray, or so the saying goes. Just remember that change doesn't always spell disaster.
Any time you face an unexpected change of events, you can quickly update your plan and move forward.
To add a new issue to the chart:
Set the Schedule
A major part of project planning involves deciding what to do. Once you've done that, you also need to estimate how long it should take and when it can be done.
The Gantt chart contains a wide range of tools that help you determine exactly what needs to be taking place every step along the way.
Work Periods
Working days and hours are defined in the time tracking settings. Here, you can define the working days and hours of the week according to the structure of your team.
By default, the time tracking settings exclude weekends. Update the settings to assign tasks on the Gantt chart for these days.
Start Dates
The Start date field in the settings for your chart determines the earliest possible calendar date for scheduling work. If there are issues on your chart where the start date has been set before the start date stored in this field, click the Recalculate button in the toolbar to update them automatically.
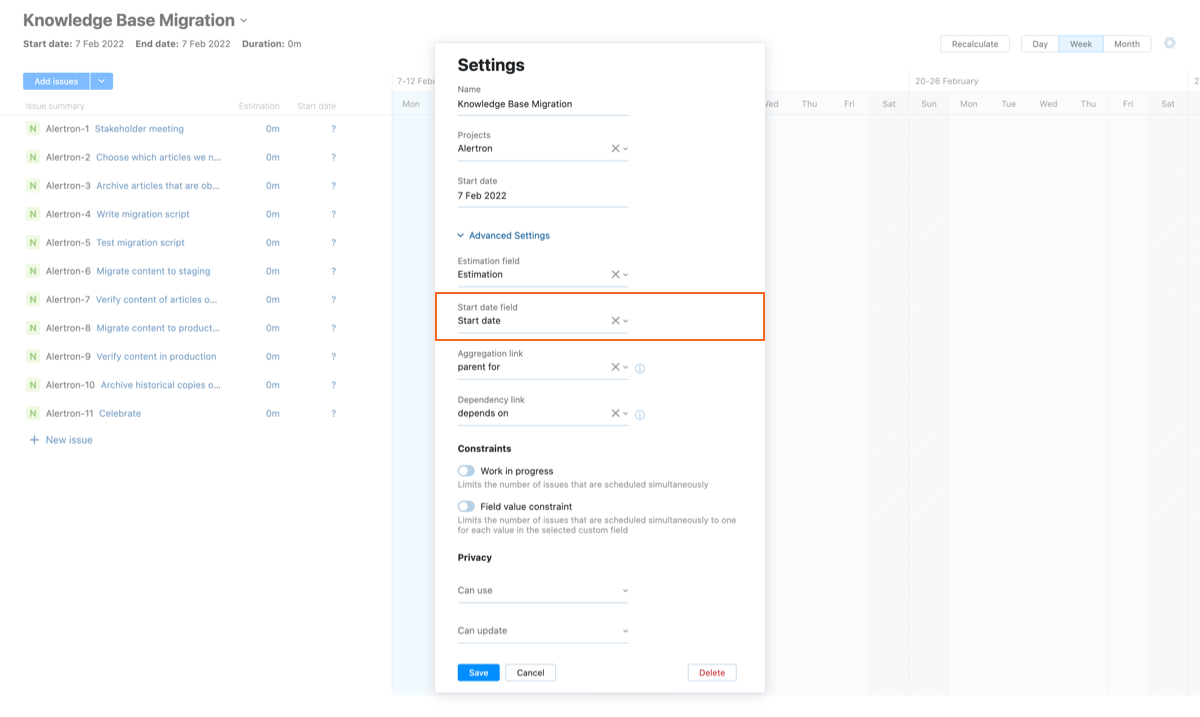
Each task in the issue sidebar has its own Start date setting. Use this to track activity that is scheduled to happen on a specific date.
You can either set the start date for an issue by updating the value for the Start date field in the sidebar or use your mouse to select the desired date in the corresponding row in the timeline.

The chart settings also give you the option to synchronize start dates with the values for a specific field in your project. When you configure this option, you can manage start dates directly in each issue without opening and recalculating the chart.
If you work with a chart that doesn't link to a start date field, the start dates for tasks on the chart are totally disconnected from any issue field that may contain this information.
Estimations
The Gantt chart lets you estimate the amount of time you think each task should take. The estimation displayed on the chart is synchronized with the value stored in the Estimation field field from the chart settings.
To update estimations on the chart:
Dependencies
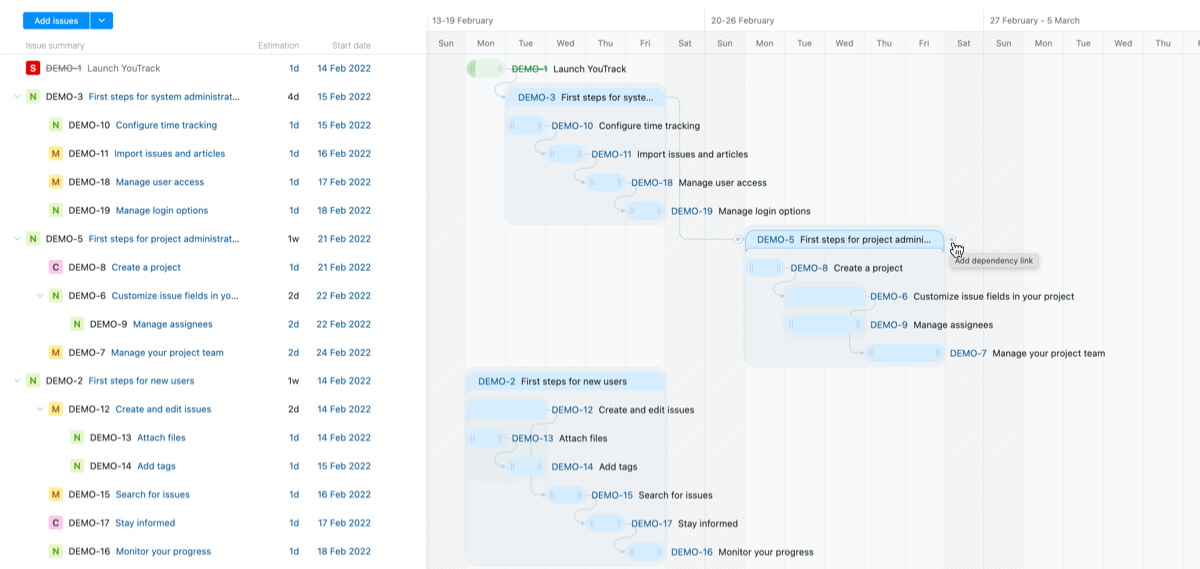
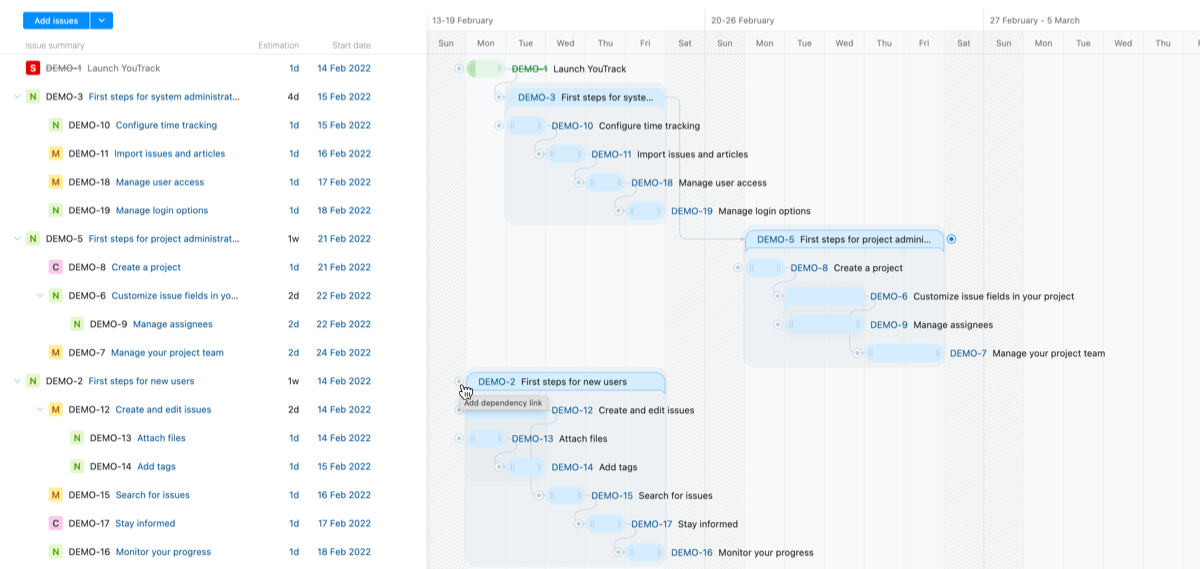
One of the critical components of project planning is the ability to designate which tasks need to be completed before others can begin. On the Gantt chart, these are represented using standard finish-to-start dependency relationships.
In the issues themselves, these relationships are stored as issue links. These correspond with the link type stored as the Dependency link in the chart settings. Every time you add a dependency link between two tasks on the chart, the selected link type is added to these issues. The direction of the dependency depends on which issue you select to finish before the other can start.
To add dependencies between issues:
You can also create links in the opposite direction by clicking the icon to the left of any dependent task and connecting it to the right side of the bar for its predecessor task.
To remove a dependency link between two issues, select the link, then click the Remove link icon.
Organize Your Tasks
By default, issues shown in the sidebar are placed in the order that they were added to the chart. If you want to change the order for issues on the chart, use the control to the left of the issue to drag it to the desired location in the list.

If you have a hard time finding the precise location to drop an issue, use the controls in the sidebar to hide subtasks for parent issues.
Recalculate the Timeline
Once your project is underway, you'll need to make adjustments to accommodate for activity that deviates from the original plan. Some tasks may take longer than anticipated, while others may happen faster than planned or turn out to be completely unnecessary.
Whenever you need to update your project plan and refresh the chart, click the Recalculate button in the toolbar. This action automatically updates the start dates for issues on the chart as follows:
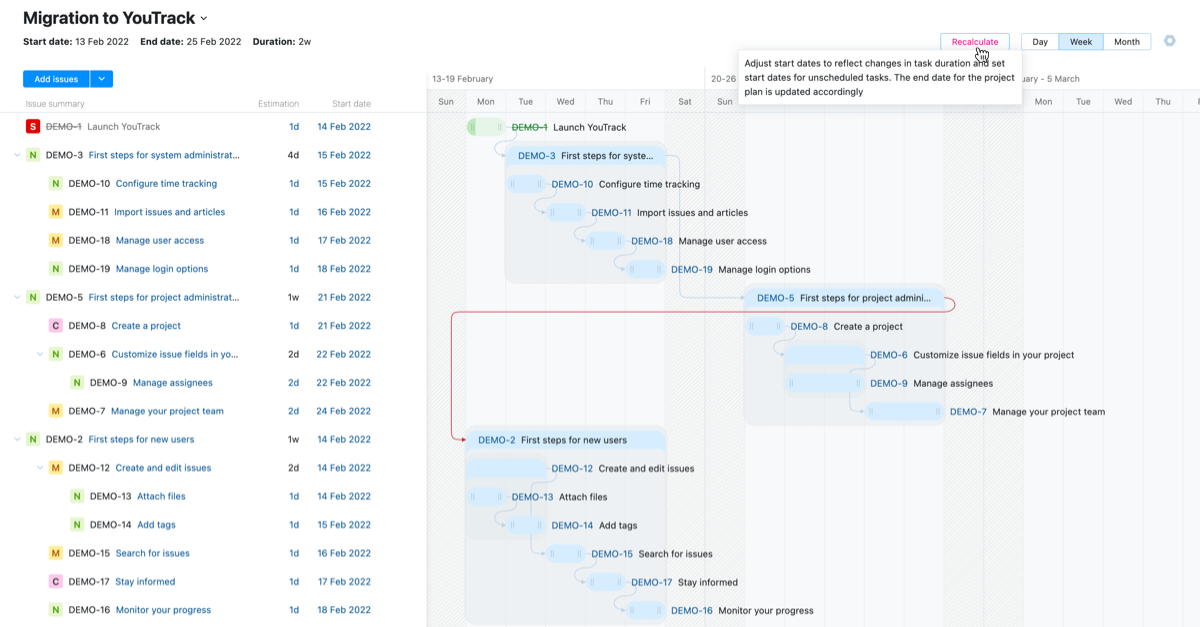
For issues that depend on task where the spent time is greater than their original estimation, the start dates are delayed accordingly.
For issues that were resolved faster than their original estimation, the start dates for their dependent tasks are rescheduled to earlier dates.
For issues where finish-to-start dependency links have been added, dependent tasks are scheduled to start following the completion of their predecessors.
Issues that don't have dependency links and are not assigned start dates are scheduled to start on the same date that is used as the Start date in the chart settings.
Manage Constraints
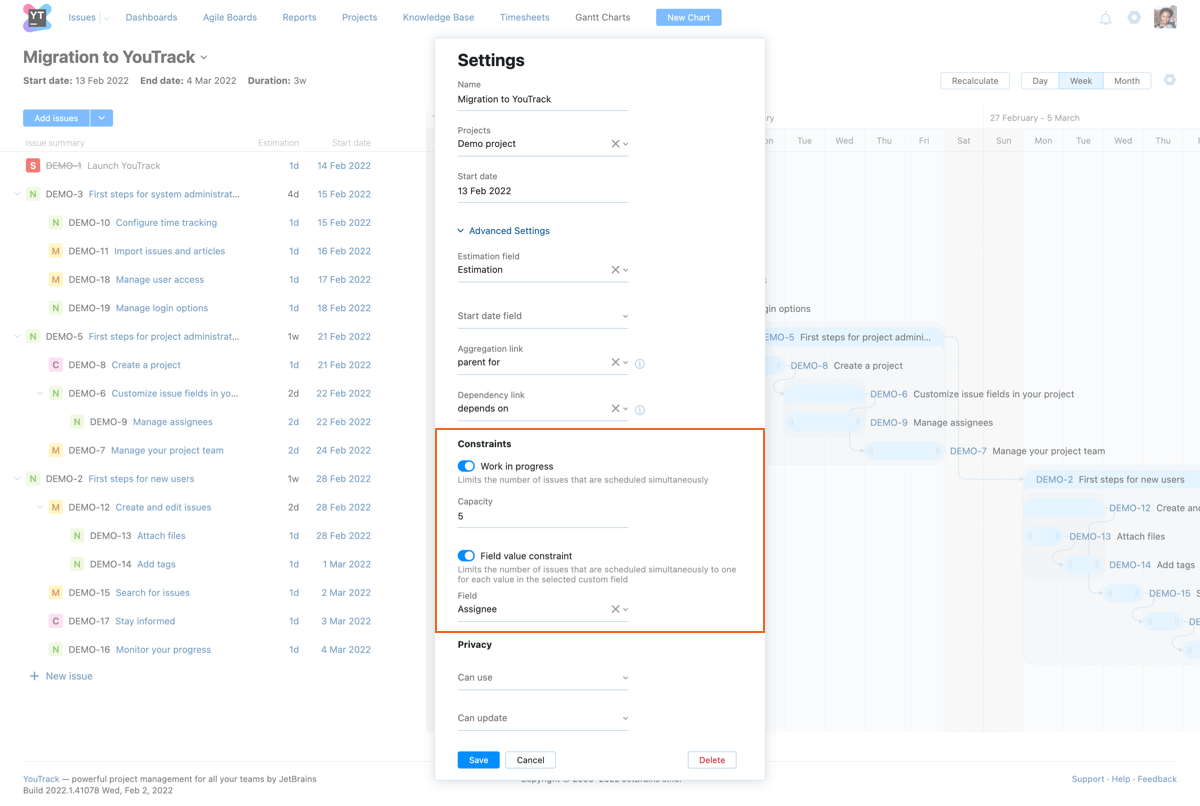
The Gantt chart supports standard constraints that limit the amount of work in progress at any given point in time as well as a cap on issues that are assigned a specific value for a custom field. These limitations are configured in the Constraints section of the settings for the chart.
Work in Progress
This option lets you measure how much time is required to finish the estimated tasks with a set number of resources. You can use this setting to judge whether you can finish your tasks on time with your current resources and measure how much faster you can complete these tasks when you add resources to the team.
When enabled, you can increase or decrease value for the Capacity field to determine whether it would be possible to accelerate the timeline by adding people to the project or not.
Field Value Constraints
This option lets you limit the number of issues that are scheduled simultaneously to one for each value in the selected custom field.
Use the Assignee field for this setting to ensure that your team isn't overburdened with too much to do at once. You can also limit the number of issues by subsystem, priority, or type.
Track Your Progress
Once your project is underway, use the information on the chart to determine whether your plans are still on track or you have started to fall behind schedule.
The fixed color scheme applied to each task on the chart gives you an indication of its current status.
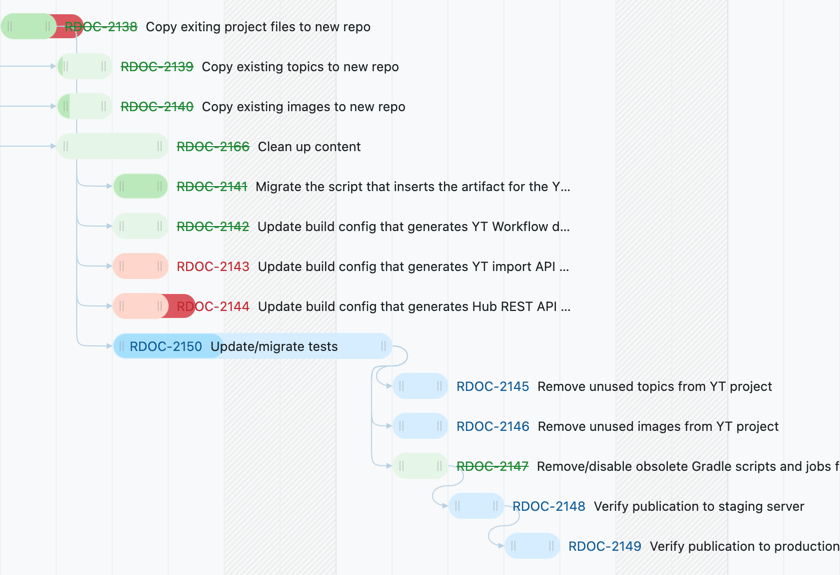
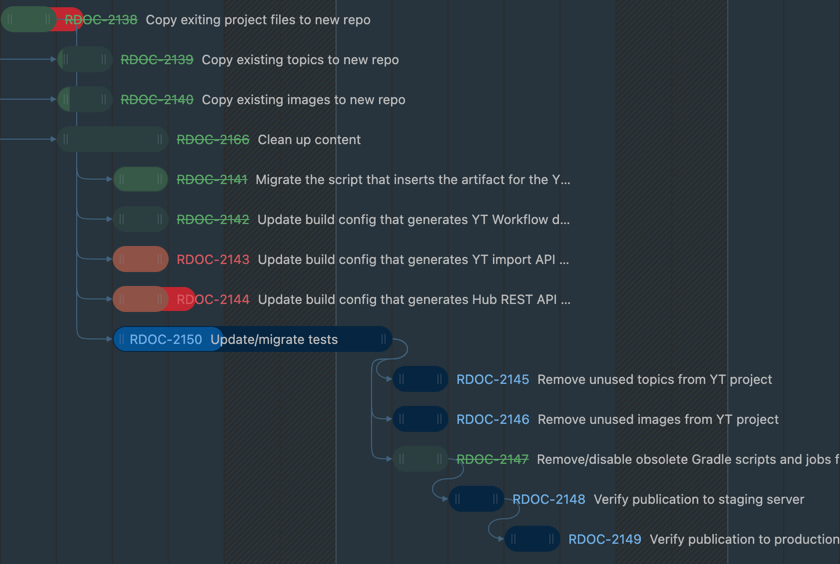
Use the information in the following table to interpret the colors applied to tasks in the chart.
Color | Status |
|---|---|
Blue | Indicates that the task is unresolved and the spent time is less than or equal to the estimation. The current amount of spent time is displayed in a darker blue. |
Red | Indicates that the task is unresolved and the spent time is greater than the estimation. The amount of spent time that exceeds the estimation is displayed in a darker red. |
Green | Indicates that the task is resolved.
|


