Advanced Issues per Project
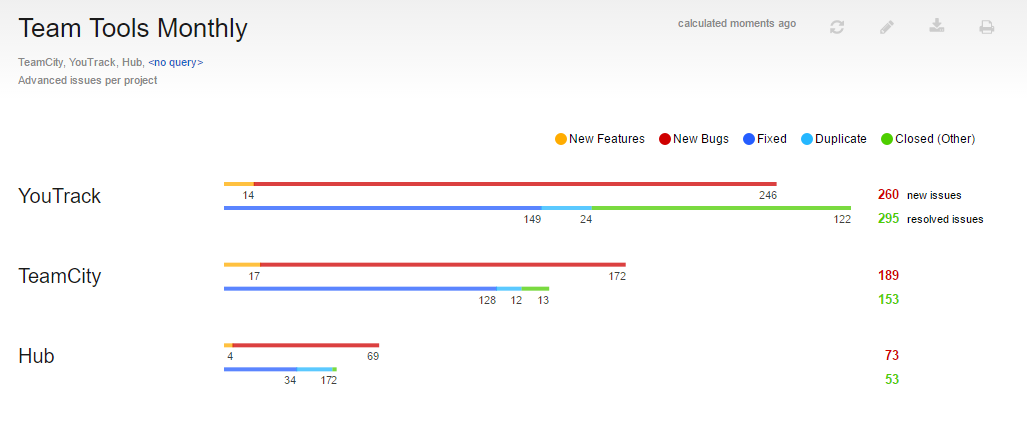
This report is similar to the Issues per Project report, with a few more bells and whistles. This report shows the total number of issues for any set of projects that were created and resolved within a specified time frame. The results are displayed on a bar chart that groups issues by a set of pre-defined types. Two bars are displayed for each project:
- The first bar represents new issues. By default, this bar displays issues for bugs and features that were created in the specified time frame.
- The second bar represents resolved issues. By default, this bar displays issues that were fixed, marked as duplicates, or closed in the specified time frame.
When the report is calculated, the following option is available in the bar chart:
- Select an issue type in the legend to show or hide the corresponding values in the report. The total number of new and resolved issues is updated to exclude the hidden values.
Settings
Use the following settings to configure this report.
Example
A report with the following settings displays the number of new and resolved issues for the current month in the selected projects.
| Setting | Value |
|---|---|
| Period | This month |
| Projects | TeamCity, YouTrack, Hub |
| Query | Empty |

Last modified: 18 April 2017