Cumulative Flow
Shows the distribution of values that are used in a custom field for issues over a period of time. Unlike the cumulative flow chart for an agile board, this report can include several projects or iterations and can reference values in any custom field.
When the report is calculated, the following options are available:
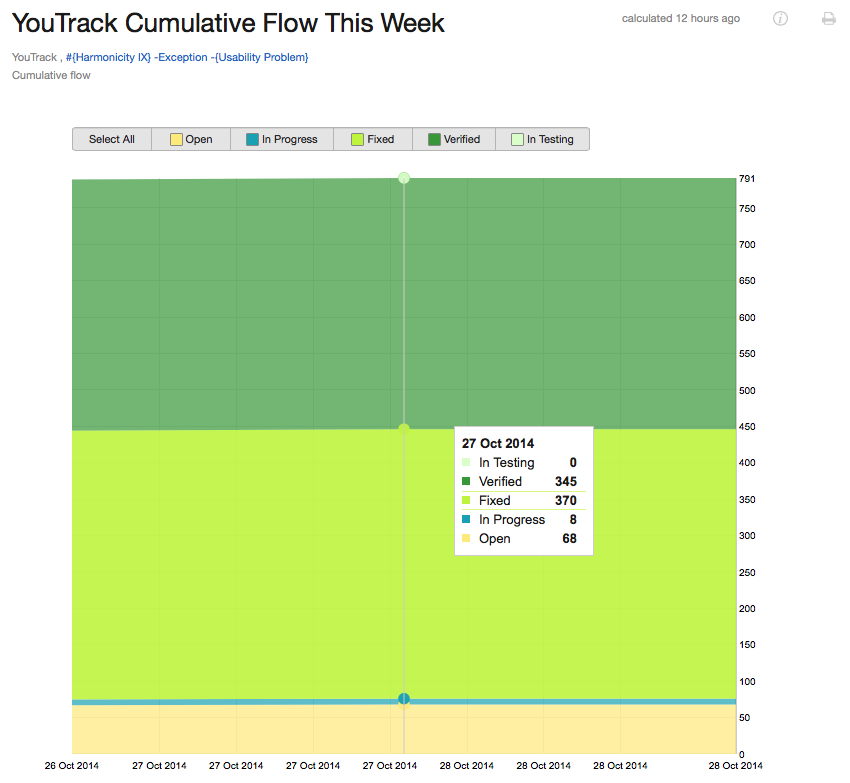
- Move the pointer over a point in time to see the distribution of issues that are assigned each value in the custom field.
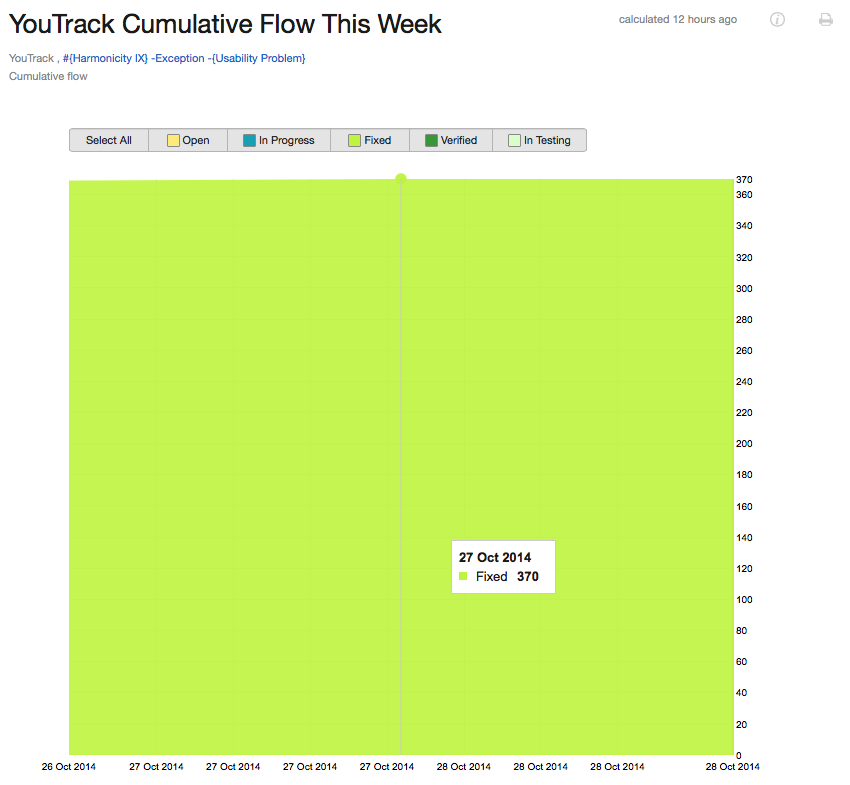
- Click a band on the chart to show only issues with the selected value.
- Show or hide bands by selecting which colors to display. Use the controls to deselect the values that you don't want to see on the cumulative flow chart. By default, bands for all values are displayed.
Settings
Use the following settings to configure this report.
Example
A report with the following settings displays the distribution of issues based on the value of the State field for the current week in the selected projects.
| Setting | Value |
|---|---|
| Projects | YouTrack |
| Query | #{Harmonicity IX} -Exception -{Usability Problem} |
| Period | This week |
| Type | State |
| Values | Open, In Progress, Fixed, Verified, In Testing |

Here is the same report narrowed down to the In Progress state change only:

Last modified: 18 April 2017