Verified vs Reopened Rate
The report compares the number of issues that were verified in one or more projects to the number of issues that were reopened within a specified time frame. The report is pre-configured to use the value that is stored in the State field to determine whether the issue was verified or reopened. Use this report to measure the number of issues that pass or fail quality assurance tests.
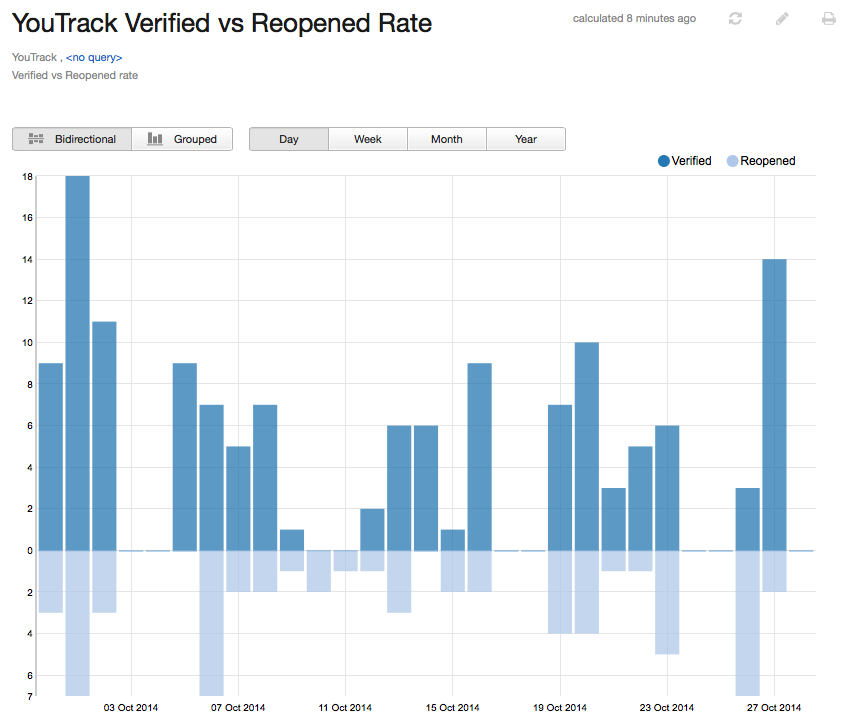
When the report is calculated, you can toggle the presentation to show a biderectional or grouped bar chart. The following options are available on a calculated report:
Move the pointer over a bar to display the total number of issues that were verified and reopened for the period that is represented by the bar. The time frame that is represented by the bar is also shown.
Select a period to show the total number of issues that were verified and reopened on a daily, weekly, monthly, or yearly basis.
Select a label in the legend to show or hide the corresponding values in the report.
Prerequisites
To use this report, configure each project that you include in the report according to the following guidelines:
Use the default State custom field to identify the current status of each issue.
Assign the value Verified in this field to issues that have been verified.
To count the number of verified issues, the algorithm for this report searches for values in the State field that include the substring verif. This means that you can include additional states that are considered as verified in the calculation of this report. For example, the YouTrack development team uses the state Without verification to mark issues that cannot be verified in the application. These issues are also included in the total number of verified issues on the report.
Settings
Use the following settings to configure this report.
Setting | Description |
|---|---|
Report Name | The name of the report. |
Projects | The projects for which the report is calculated. The projects that are visible in the list are displayed based on your View Project access permissions. |
Query | The Query and Projects settings let you narrow the scope of your report to receive more precise results. The search query field supports the same syntax and auto-completion that are available in the search box. |
Period | The time frame for which issues are displayed on the report. |
Automatically Recalculate | Configures periodic recalculation for your report.
|
Visible to | Sets the visibility for the report. By default, the report is visible to its owner only. |
Example
A report with the following settings displays issues that were verified and reopened in the YouTrack project for the previous month. The calculated report is displayed as a bidirectional bar chart. The values are shown for each day of the month.
Setting | Value |
|---|---|
Projects | YouTrack |
Period | Last month |

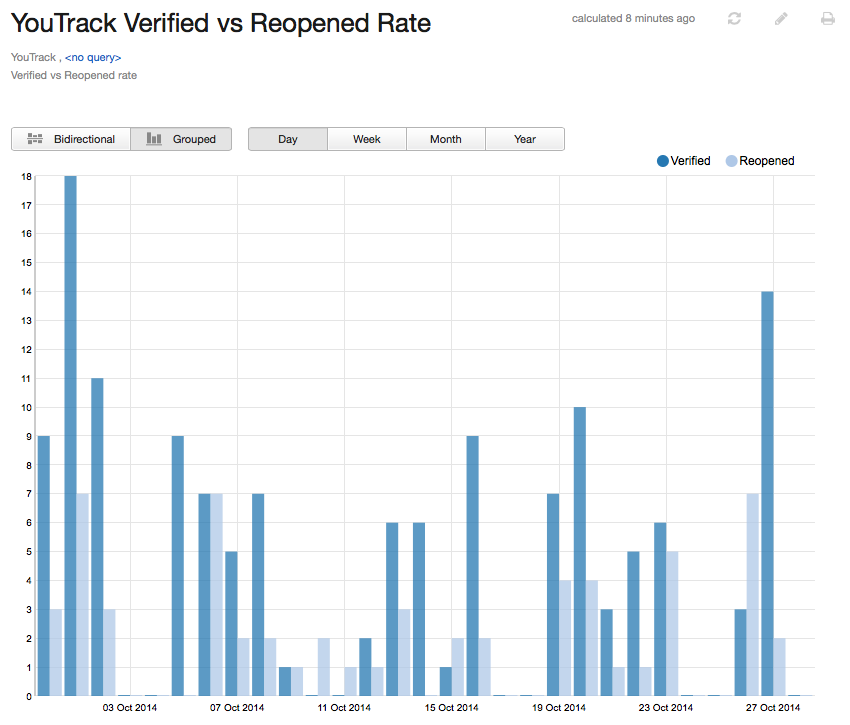
Here is the same report displayed as a grouped bar chart:
