Configure an Agile Board
This page describes how to configure the settings for an agile board. For a detailed description of each setting, see Agile Board Settings.
To open the Board Settings panel, click the ![]() button in the board toolbar. When you create a new board, its settings are displayed automatically.
button in the board toolbar. When you create a new board, its settings are displayed automatically.
Configure General Settings
The General tab displays the basic settings of the board. These settings are configured when you create the board.
The default settings for Sprints and Board behavior are applied by the template that you use to create the board. For a detailed description of these options, see Board Behavior.
Configure Columns
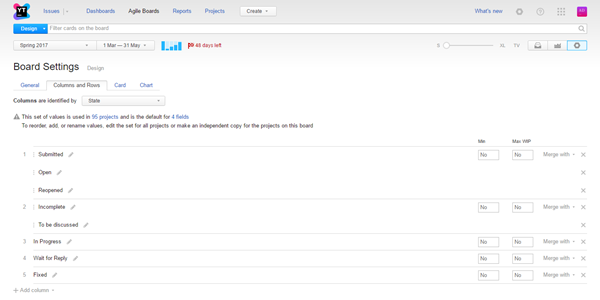
The Columns and Rows tab lets you to define which columns are displayed, arrange them on the board, enable swimlanes, and choose how to identify swimlanes. For more information about these settings, see Settings for Columns.

To configure the columns on your board:
Open the Board Settings > Columns and Rows tab.
- Select a field to identify columns. You can only select from fields that store a
stateorenumtype with the Multi-value option disabled. That is, the field that identifies columns can only have one value set at a time. The selection is limited to the fields that are used in the projects that are associated with the board.Each value that is used in the selected field can be added as a column to the board.
Click the Add column option and select the values that you want to use as columns on the board.
Optionally, set the Min WIP and Max WIP for each column. WIP stands for "Work in progress" — the number of cards that can be present simultaneously in the column. You can set the minimum and maximum WIP here. When the number of tasks in the column is less than the "Min WIP" or is more than the "Max WIP" value, in the column's title, a warning message is displayed.
Optionally, drag a value to reorder the columns.
Optionally, use the Merge with control to merge multiple values into a single column. For more information, see Merge Board Columns.
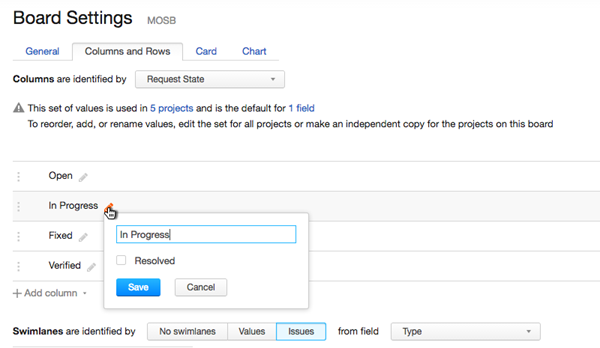
You can also edit the set of values for the field that identifies columns on your board.
When you edit a column, you effectively edit the corresponding custom field and its set of values. The warnings on this tab show you how many projects use this set of values in a custom field. When you add or rename values, these changes are applied in all of the projects that you have permission to update, including projects that are not managed on this agile board.
If you want to change these values without affecting other projects, create an independent copy of the set of values in your projects. For more information, see Manage Custom Fields.
To edit column values:
- Update the custom field. You can change the following properties:
Rename the column to change the name of the value in the field.
If the field stores a
statetype, you can select the Resolved checkbox. When enabled, issues that are assigned this value are considered to be resolved.
Click the Save button to apply your changes.
To add a column for a new value, click Add column > Create column button and enter the parameters for a new value. This value is added to the set of values for the custom field in all of the projects that you have permission to update.
To remove a column from the board, click the Remove icon to the right of the column.
Configure Swimlanes
Swimlanes let you group issues visually on an agile board. YouTrack lets you use the set of values in a custom field or select specific types of issues to identify each swimlane.
You can also identify swimlanes by the projects that are managed on the board.
For more information about these settings, see Settings for Swimlanes.
To enable and configure swimlanes:
- Select an option to identify swimlanes.
Option
Description
Values
Swimlanes are identified by the set of values in the selected Field. For example, you can set swimlanes to represent issues for each Assignee. When you add a card to a swimlane, the value in the Assignee field is set to the user represented by the swimlane automatically. You can also use projects to identify swimlanes.
Issues
Swimlanes are identified by issues that are assigned a value in the selected Field. For example, you can set swimlanes to represent issues with the Type field set to Feature. This is the default setting for a board that is created with the Scrum template. When you add a card to a swimlane, the issue that is represented by the card is linked as a subtask of the issue that represents the swimlane.
From the Add value drop-down list, select the values that you want to use as swimlanes on the board.
Optionally, enable the Show swimlane for uncategorized cards option. When enabled, you can choose to display this swimlane at the top or bottom of the board.
To disable swimlanes, select the No swimlanes option.
Configure Cards
The Cards tab lets you display estimations on the board, set the default issue type for new cards, and manage the visual presentation.
To configure cards on the board:
Click the Settings (
 ) button to open the Board Settings and switch to the Cards tab.
Select the Estimation Field for the board. You can only select from fields that store a
period,integer, orfloattype. This field is also used to calculate the burndown chart.Optionally, set the Default Value for Type. All new cards that are added to the board are assigned the selected value. This parameter is only visible when swimlanes are enabled and identified by Issue.
- Select a Color Scheme for cards on the board.
If you select Project, you can choose which color is applied to cards in each project.
If you select a custom field, the color that is associated with each value in the set is applied to cards automatically.
Optionally, enable the Show colors for other custom fields option. When enabled, color-coded visual indicators for custom fields are displayed on each card.
Configure Charts
The agile board has a built-in reporting feature. This feature lets you display one of two report types directly on the board.
Type | Description |
|---|---|
Burndown | Compares the ideal progress vs. actual progress for the current sprint. |
Cumulative Flow | Shows the distribution of values that are shown as columns on the board over the past two weeks. |
To configure a chart for the board:
Select the Type of the chart that you wish to use for your board. By default the Burndown chart is selected.
- In the Issue Filter parameter, select which cards should be counted for the chart:
All cards: all cards that are assigned to the current sprint of the board are taken into account. Swimlanes are not taken into account in this case.
Custom: All cards and swimlanes that match the Query are taken into account. You can update the query at any time: Just open the settings and correct the query. When done, click the Recalculate button next to the Query filed to immediately see the updated chart.
- For a burndown chart, you can also define how to calculate the burndown. The availability of the Burndown calculated by options depend on the settings of the time tracking in the board projects:
Issue count: the chart is calculated by the number of cards.
- Estimation: calculate by the Estimation field of the board. When a card is resolved, the chart descends on the value of the Estimation field.
Work items: calculated by the logged work items.

