Kanban Boards
Small teams that work in the same location can use a simple whiteboard to follow a Kanban method. If your team is distributed or just bigger, or if you want to integrate a Kanban board and an issue tracker anyway, consider using a YouTrack Agile board to manage your projects.
The cards on the board represent issues to be processed by your team. Advocates of the Kanban method use terms like work item, but for this tutorial, the terms work item, task, issue and card are all synonymous.
Continue reading to learn how to set up and use a Kanban board in YouTrack. For a quick overview, watch this demo:
Configure Your Projects
Before you start to configure your Kanban board, take a minute to pick which projects you want to manage on the board and check that they are configured properly.
The Kanban method assumes that you draw columns on the board that reflect the stages of your development process. Your process can include many stages, and all of them are visualized on the board. Most development teams use three to seven columns. This is a reasonable limit, as monitoring the board is essential in Kanban practice. The more columns you have, the harder they are to track.
Columns usually represent the development stage, department name, or anything else that you consider to be a stage in your work. When you create a new card on the Kanban board, the card represents an issue in YouTrack. One of the issue fields stores the stage. By default, the board uses a field that stores this value as a state type. When you move the card around the board, the field takes the value of the column that it has been moved to.
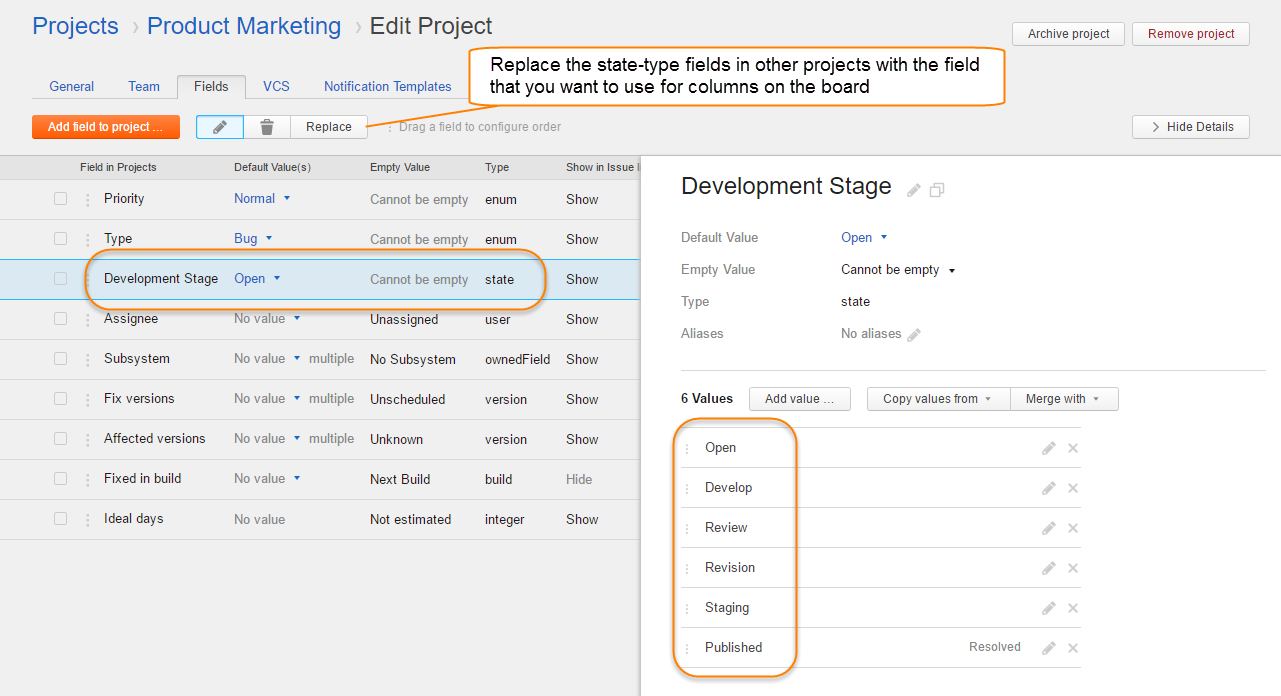
This example shows a state-type field that represents the development stages for issues in the project. The field cannot be empty, which means that all new issues that are created in this project is displayed in the column that represents this value on the board when it is set.
For best results, edit the set of values for an existing field that uses a state type. If you add a new state-type field to your projects, be sure to remove any additional state-type fields. Projects that use multiple state-type fields can be difficult to work with and require additional setup. For more information, see Possible Conflicts with Multiple State-type Fields.
If you want to use a Kanban board with a new project, you can create the project and the board simultaneously with the Kanban project template. For more information, see Kanban Project Template.
Create the Board
Click the Agile Boards link in the header, select Board from the Create menu, then click the Kanban board button.
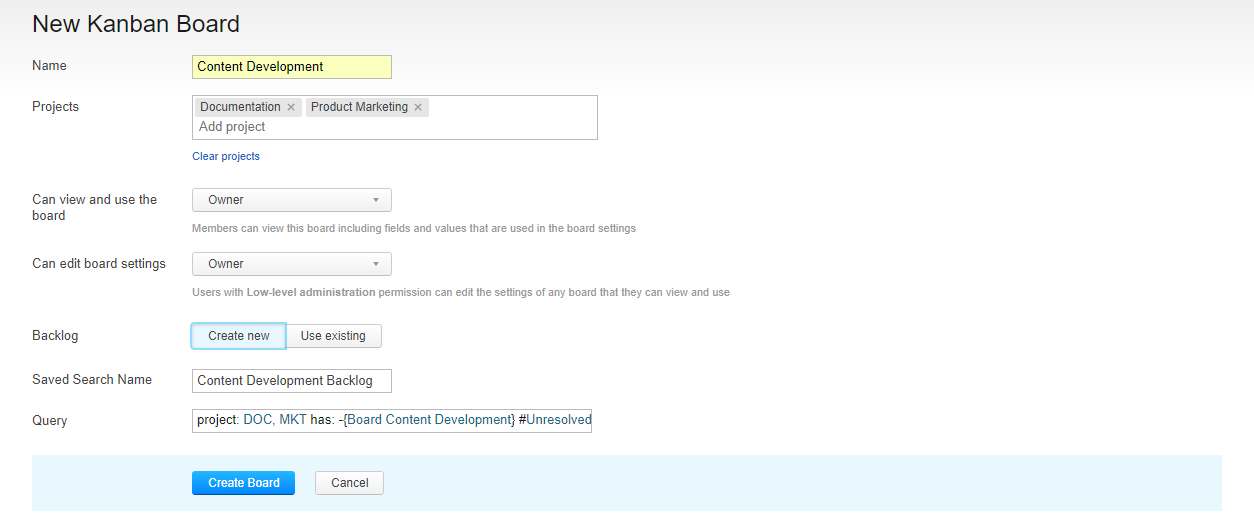
Use the following guidelines to set up your new board:
Setting | Guideline |
|---|---|
Name | Give the board a name. |
Projects | Choose the projects that you want to manage on the board. |
Can view and use the board | Select the name of your project team from the list. To view cards and swimlanes and use the board, each member of the project team should also have permission to view and update issues in the selected projects. |
Can edit board settings | If you want other members of your project team to have access to the board settings, select the name of your project team from the list. Otherwise, only you can update the settings for the board. |
Backlog | If you have already defined a saved search that contains all of the issues in your product backlog, select the Use existing option. Otherwise, select the Create new option. |
Saved Search | Select the name of the saved search that you want to use for the backlog on the board. If you selected the Create new option, this setting displays the name that is assigned to the new saved search when the board is created. The search query for a new backlog is formatted as follows: project: <project(s)> has: -{Board <Board Name>} #UnresolvedThis saved search displays all unresolved issues in the projects that are managed on the agile board that have not been added to the current board. |
Query | The search query that filters issues that are displayed in the backlog. If you selected the Create new option, this setting displays the query for the saved search that is created for the backlog. |
When done, click the Create Board button. The Board Settings page opens to the General tab.
Choose a Board Behavior Option
The General tab displays the settings that you just defined to create the board. For boards that are created with the Kanban board template, the Sprints option is Disabled by default. The standard Kanban methodology doesn't use sprints. You can always enable sprints and follow a hybrid Scrum/Kanban (Scrumban) methodology, but that's not what this tutorial is about.
What you do want to pay attention to before you modify the settings on other tabs are the Board behavior options.
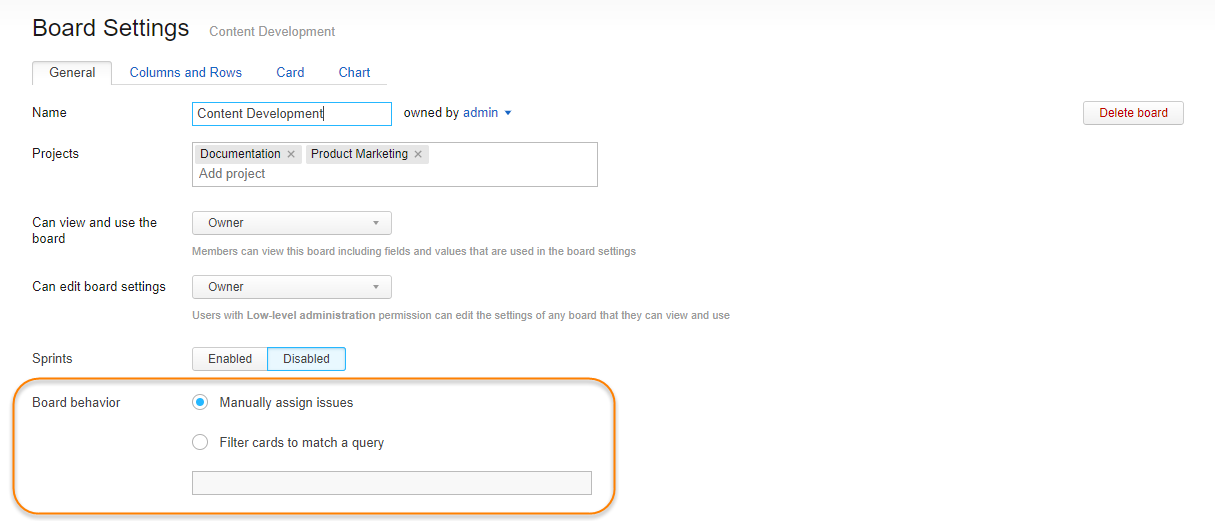
Option | Description |
|---|---|
Manually assign issues | Leave this default option enabled if you want to manage which issues are added to the board explicitly. New issues that are created in your projects are not seen on the board unless you add them manually. Teams that follow a Kanban methodology generally add new issues directly in the leftmost column of the board. When you use this option, make sure that backlog shows issues that are not currently displayed on the board. If someone creates an issue in your project without using the board, you can locate it and add it to the board from the backlog. |
Filter cards to match a query | Use this option to add issues to the board automatically. Any issue that matches the search query is added to the board as a card. New issues that are added directly to the board automatically inherit the attributes that are used in the search query. If you enable this option and leave the search query field empty, all of the issues in the selected projects are added to the board. Each issue is placed as a card in the column that matches the value for the field that identifies the columns. |
Define Columns and Swimlanes
The next step is to configure the settings that identify columns and rows on the board. When the board is created, the custom field that you configured in the first section of this tutorial is used to identify columns by default.
On the Columns and Rows tab, you can use the Add column option to add values from this field as columns to the board.
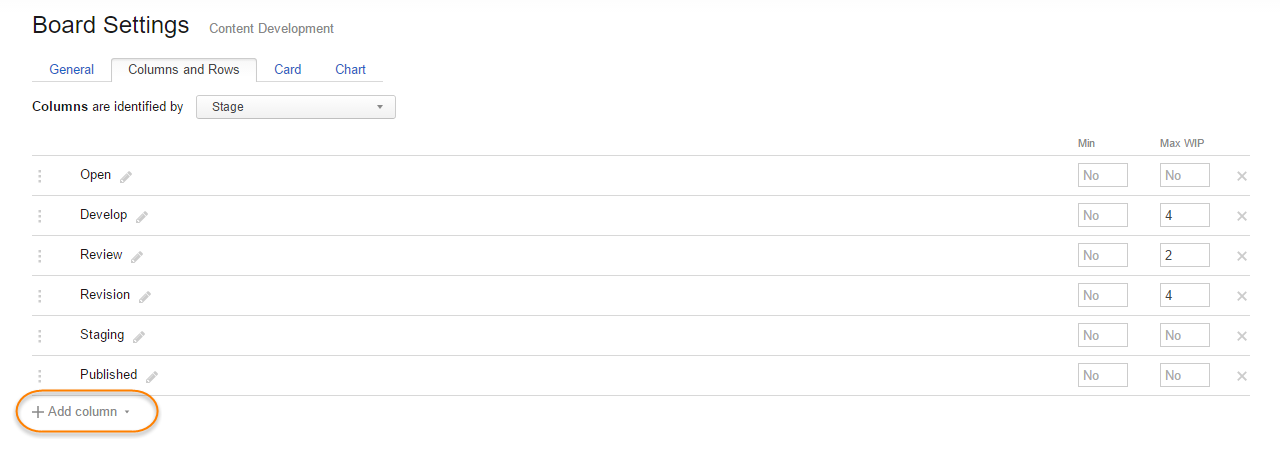
By default, the template for the Kanban board does not use swimlanes. All of the issues are displayed in the same row. You can, however add swimlanes to the board to add another layer of information.

For example, you can activate the Values option and use the Priority field to identify swimlanes. Each value that is stored in this field is shown as a swimlane on the board.
Set Work in Progress Limits
Work in progress (WIP) is an indicator of how many cards can be present in a particular board column simultaneously. This represents the number of tasks that can be managed simultaneously at this development stage. We recommend that your WIP value reflect the actual number of tasks which can be performed at the same time at this work stage.
For example, this project team only has two copywriters. The Max WIP setting for the Review stage is set to 2.
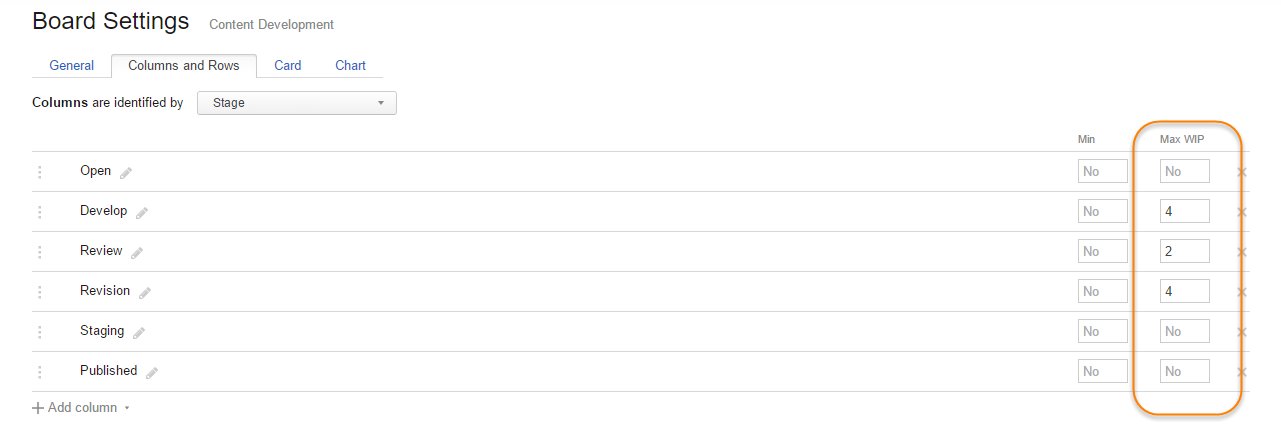
You can set the minimum and maximum WIP for each column individually.
Customize Card Presentation
The Cards tab gives you a few options that you can use to configure your Kanban board.

If you estimate the amount of time that is required to finish each task, you can display estimations on the board. Use the Estimation Field setting to select which field is used to store estimations in your projects. This lets you show and update estimations directly on each card.
You can also set the color scheme that is used to highlight cards on the board. For Kanban boards, we suggest that you color cards based on the Kanban state. When you create a project with the Kanban template, the Kanban State field is added to your project automatically. This field stores the current state of the issue as either Blocked or Ready to pull. The Kanban State field has a default color scheme. Issues that are blocked are red. Issues that are ready to pull are green. You can update the color scheme for this custom field on the Edit Project page.
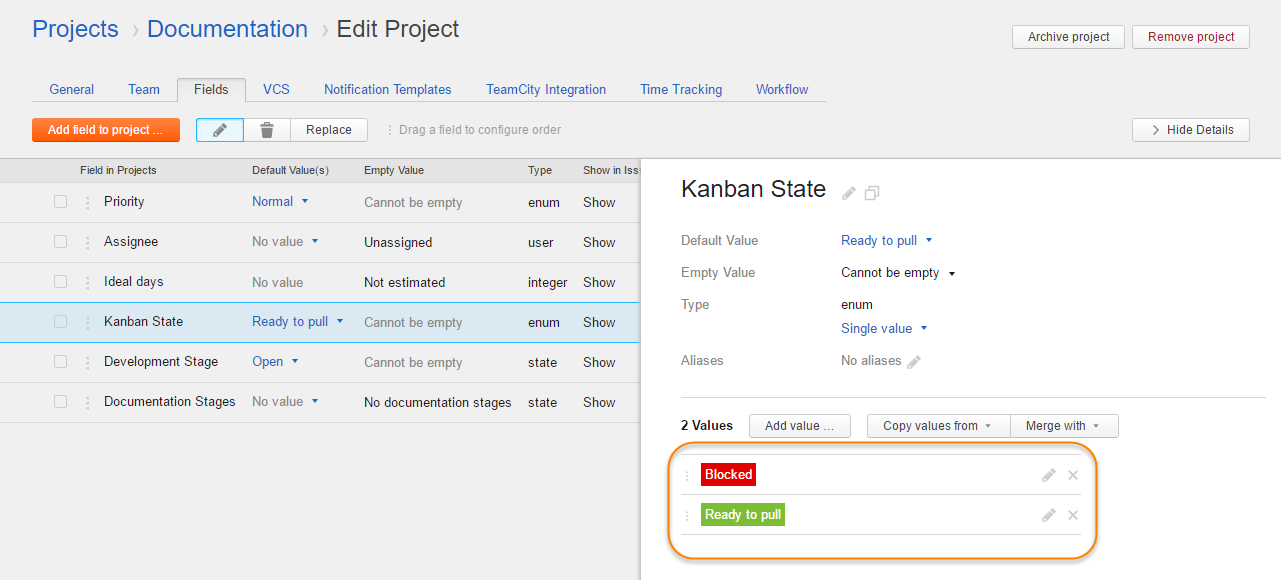
These states are critical for following the Kanban method. Members of your team who are responsible for the next stage of development should clearly see which issues they can pull into their column. If you choose not to use this field in your projects, we recommend that you use another method for visibly flagging issues. For example, you can create and attach a Ready to pull tag to issues that can be moved to the next stage of development.
If you choose to color your cards by project, you assign each a project a color on the Card tab of the Board Settings page.
Configure the Chart
The Chart tab lets you choose which report you want to display on your Kanban board.

For Kanban, the most useful option is the cumulative flow diagram. This report shows the distribution of tasks across different stages of development at any moment in time. The cumulative flow diagram helps you monitor your progress, analyze your development process, and detect bottlenecks.
Use the Issue Filter setting to limit which cards are included in the calculation of the report. Here, we use the filter to exclude minor issues from the report.
Working with the Kanban Board
When you have finished configuring the board, you and your team can use the board to manage your work. Here are some of the key components of the board with a few guidelines for using the board with the Kanban method.
Adding Cards to the Board
A common practice in Kanban is to add work items to the board in a column that represents an open state. You can add issues as cards directly on the board. If you have a backlog of issues that you want to manage on this board, you can open the backlog and pull the issues from the backlog to the board.
For the setup that is described in this tutorial, the field that is used to define columns cannot be empty. All issues that are created in the projects that are managed on the board are created directly on the board.
Moving Cards Around the Board
When you move cards around the board, you can exceed the maximum WIP limit for a column. YouTrack alerts you to this condition by changing the background color of the column and indicating that the limit is exceeded. Here you see that there are five cards in a column with a max WIP of four.

Card Size and TV Mode
The slider at the top of the board sets the level of detail for cards on the board. This setting is user-specific and can be set independently for different boards.
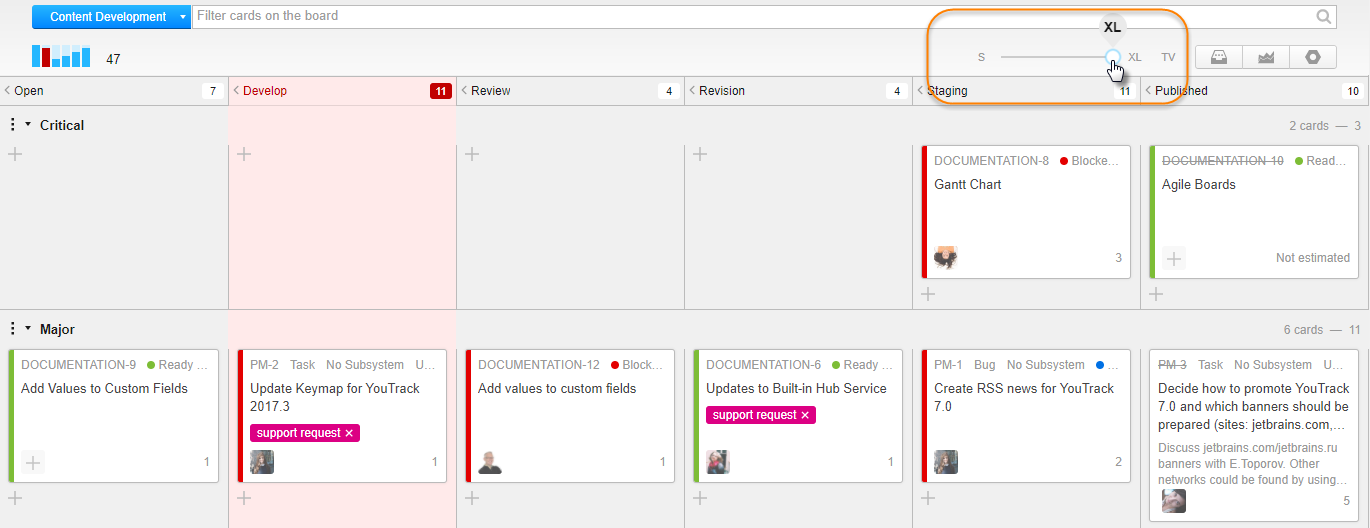
Some teams use large monitors or projectors to display the Kanban board at their meetings. TV mode displays the board in full screen and uses a color scheme with a dark background. This visual presentation has been proven to improve visibility from a distance on large monitors.
Progress Indicators
The progress indicator shows the distribution of cards by stage. Each bar corresponds to a column on the board.
To view the total number of cards in each column, move the pointer over the corresponding column in the progress indicator. The number of cards in each swimlane is displayed on the right side of the swimlane.
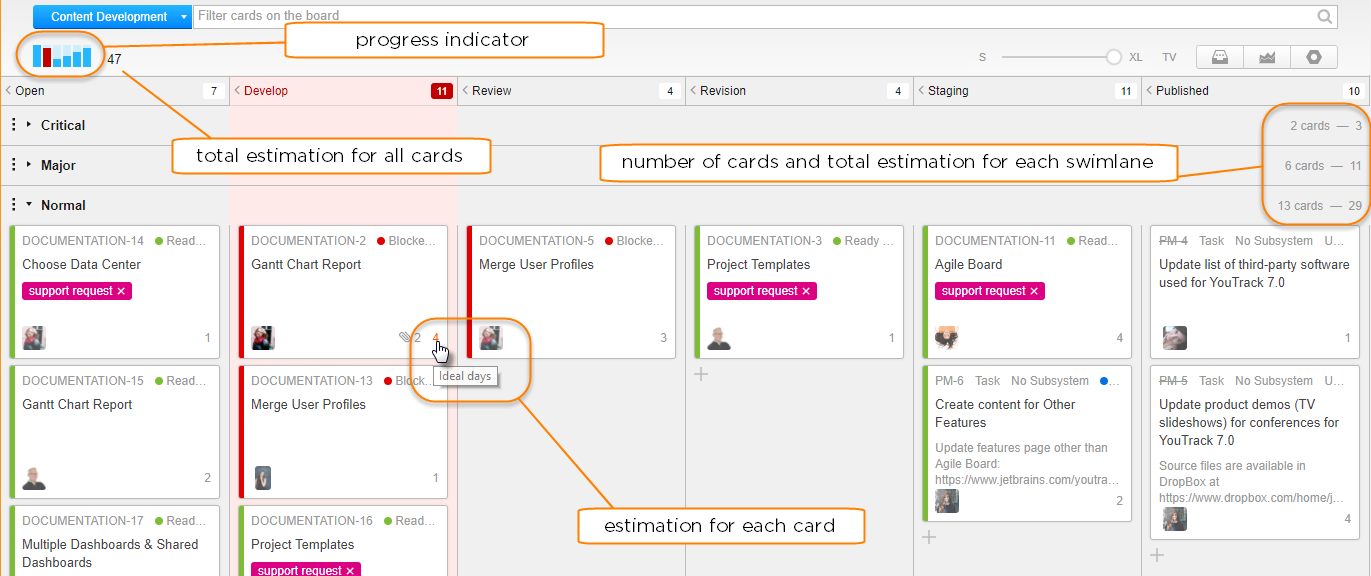
If you have enabled the Estimation Field setting, the board displays the total estimation for all of the cards at the top of the board. The presentation varies based on the data type of the custom field that is used to estimate the time that is required to complete a task.
This example shows estimations in ideal days. The total estimation for all of the cards in each swimlane is displayed on the right side of the swimlane.
Tracking Your Progress
You can open the cumulative flow diagram directly on the board. The chart shows the distribution of cards on the board by stage for the last two weeks. Move the pointer over a date on the chart to see the number of cards in each stage on any date that is displayed on the report.
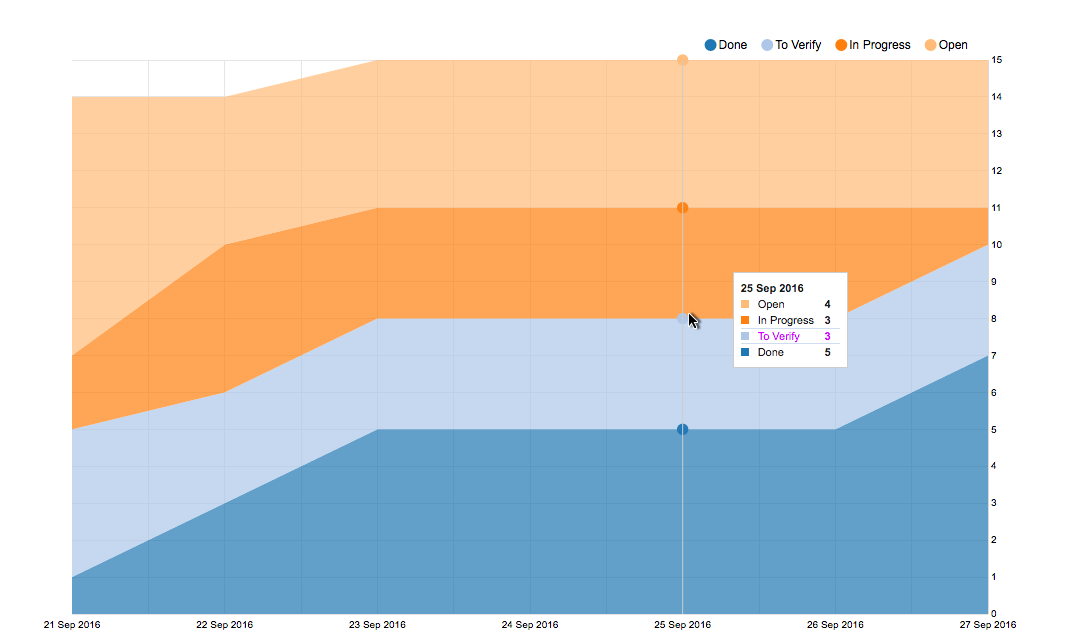
On this graph, the vertical axis shows the number of tasks in each column. The horizontal axis represents time by date.
To see how quickly you're getting things done, look at the region between Open and Done. This area represents all of the intermediate stages of development. Basically, the steeper it decreases, the faster you're completing your workload and nearing the final release date.
Also, the intermediate stages are supposed to shrink over time. If they are expanding, it could indicate a bottleneck. It can also mean that you're adding more work to your system than your current capacity allows.