Agile Board User Interface
An agile board in YouTrack has a number of controls that you can use to update issues or modify the appearance of the board.
Header

The Create button at the top of the page lets you perform the following actions.
| Action | Description |
|---|---|
| Card | Opens a dialog for adding an issue as a card to the board. When created, the new card is added to the Orphans swimlane. |
| Swimlane | Opens a dialog for adding an issue as a swimlane on the board. When created, the new swimlane is added to the bottom of the board. |
| Sprint | Opens the New Sprint dialog. This option is only visible if you have permission to update the settings of the current board. For more information, see Create a Sprint. |
| Board | Opens the Create an Agile Board page. For more information, see Create an Agile Board. |
The following controls are displayed just below the header.
Toolbar
The toolbar is always displayed at the top of the page when you scroll down the board. The following controls and visual indicators are displayed in the toolbar.
| Control | Description |
|---|---|
| Sprint Name | Displays the name of the current sprint. To view a different sprint, select its name from the drop-down list. Enter a value in the input field to filter the list of sprints. If you have permission to update the settings of the current board, you can also select the New sprint option to add a sprint to the board. |
| Sprint Schedule | Displays the start and end date of the current sprint. This control is only visible when the schedule has been defined for the sprint. If you have permission to update the settings of the current board, you can click the drop-down menu to change the schedule. Otherwise, this control is disabled. |
| Progress Indicator | Displays the total number of cards in each column on the board as a bar chart. Move the pointer over each bar to display the total number of cards and the value that is assigned to each column. |
| Sprint Countdown | Displays the number of calendar days remaining in the current sprint. This total includes non-working days. On the last day of the sprint, this indicator only displays the checkered flag. This information is only visible when the schedule has been defined for the sprint. |
| Estimation | Displays the total estimation for all of the cards on the board. The presentation varies based on the data type of the custom field that is used as the Estimation Field in the settings for the board. This information is only visible when the Estimation Field setting is configured. |
| Card Size | Sets the level of detail for cards on the board. This setting is user-specific and can be set independently for different boards. |
| TV Mode | Opens the board in full screen mode. TV mode is optimized for display on large monitors and can be read from a greater distance than normal mode. |
| Backlog | Opens the list of issues in the backlog on the left side of the page. For more information, see Work with a Backlog. |
| Chart | Opens the chart that is configured to track progress on the board. The type of chart that is displayed is determined by the Chart settings for the board. If you have permission to update the board settings, additional controls let you recalculate the report, edit the chart settings, and print the report. Otherwise, you can only view the settings and print the report. |
| Settings | Opens the Board Settings panel. If you do not have permission to update the board settings, this control is disabled. |
Columns

The label for each column corresponds to a value in the custom field that identifies columns on the board.
The following controls and visual indicators are displayed in the header of each column.
Swimlanes

Each row on the board represents a swimlane. For boards that use issues to identify swimlanes, the issue summary is displayed as the label for the swimlane. Boards that use values in a custom field to identify swimlanes show the value that is stored in the selected field. All boards include an Orphans swimlane that can be used to manage issues that do not belong to a specific swimlane.
The following controls and visual indicators are displayed in each swimlane.
Cards

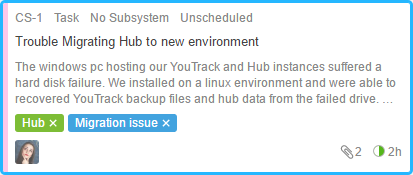
Each card represents an issue on the board. When you drag a card to a different column or swimlane, the fields that are used to identify these components of the board are updated in the issue. The amount of information that is displayed on each card is determined by the current setting in the Card Size slider.
The visual presentation of each card changes in the following ways:
- The current card on the board is shown with a blue boarder. In this state, keyboard shortcuts and commands are applied to the current card.
- A card that is selected before moving to another card on the board is displayed with a blue background. In this state, keyboard shortcuts and commands are applied to all selected cards. The current card is not considered.
The following controls and visual indicators are displayed on each card.
Footer

Like the toolbar, the footer is always visible on the agile board.
The following controls and visual indicators are displayed in the footer.
The following controls are displayed in the footer when you select one or more cards on the board.