Gantt Chart
This report shows issues as a linked series of dependent tasks. A bar represents tasks on the Gantt chart. The length of the bar represents the duration of the task. The duration is either the estimated time required to complete the task or the actual amount of time spent — whichever is greater. Each issue is assigned a start date based on the report start date and the duration that is assigned to predecessor tasks.
The Gantt chart uses the standard finish-to-start dependency relationship. This means that predecessor tasks and subtasks must be finished before work can begin on tasks with dependency links. Subtasks show a start-to-start dependency relationship with other subtasks that do not have dependency links.
The report supports capacity limitations. This option lets you measure how much time is required to finish all estimated tasks with a set number of resources. You can use this setting to judge whether you can finish your tasks on time with your current resources and measure how much faster you can complete these tasks when you add resources to the team.
When the report is calculated, the start date, end date, and total number of working days are displayed at the top of the page. For charts with unlimited capacity, you can toggle the presentation to show the actual or estimated duration for each task on the chart. On charts with limited capacity, you can display the estimated view when you remove the spent time field from the report settings.
The Estimated view shows how much time was estimated for each task. Tasks with dependency links are set to start when the predecessor task is estimated to finish.
The Actual view includes the amount of time that was spent on each task. Tasks with dependency links are set to start when the predecessor task is actually done. When a predecessor task is completed before the estimated finish date, dependent tasks are scheduled to start earlier. If a predecessor task takes longer than estimated, the dependent tasks are delayed.
The following options are available in both views:
Move the pointer over a bar to display detailed information for the corresponding task. For a detailed description of these values, see Calculations.
Click the issue ID to open an issue in a new browser tab. Use this option to update the estimation and spent time for the corresponding task.
When the total duration of the tasks exceeds the width of the report, click the bar at the bottom of the report to scroll through the timeline. You can also drag the bar to zoom in and out on the timeline.
Visual Presentation
The report uses visual cues to represent different types of information.
The current date is highlighted in the timeline. A vertical line is drawn down the chart to show the end of the day.
The color of the bars reflects the current status of each task.
Blue
Unresolved tasks for which the spent time is less than or equal to the estimation.
Green
Resolved tasks.
Green/White
The length of time that was overestimated.
Red
Unresolved tasks for which the spent time is greater than the estimation.
Red/White
The length of time that was underestimated.
The color scheme for Gantt charts is fixed and cannot be altered.
The progress towards completion of a task is displayed as a percentage to the left of each bar.
The relationship between parent tasks and subtasks is represented by two vertical lines. The line on the left represents the start date of the earliest subtask. The line on the right represents the end date of the latest subtask.
The relationship between dependent tasks is represented by an arrow. The arrow is drawn from the end date of the predecessor task to the start date of the successor task.
In the Actual view, the spent time for unresolved tasks is drawn as a dark horizontal line at the bottom of the bar for each subtask.
Prerequisites
For best results, you should configure and use YouTrack according to the following guidelines:
Enable and configure time tracking in each project that you want to show on the report.
If the system-wide time tracking settings for your YouTrack server are configured incorrectly, the report cannot be calculated. For example, the work days are not defined or the hours per day are set to zero. To learn more about the system-wide time tracking settings in YouTrack, see Time Tracking Settings.
Enter values in the Estimation field for each issue.
Use time tracking to enter work items for each issue.
Use link types that represent dependencies between tasks and aggregations.
You should also consider using the Type field to categorize issues that you want to select as top-level issues for the report. This makes it easier to define the query. For example, assign parent issues the Feature type and assign subtasks the Task type. You can then set the query to display all unresolved issues that are assigned the Feature type.
Create a Gantt Chart
To create a Gantt chart:
From the main navigation menu, select
Reports.
Click the New report button.
Click the link for the Gantt chart.
In the settings page for the report, set the parameters for the new report.
To learn more about the settings for this report, refer to the settings.
When you are finished with the report settings, click the Create report button.
The report is sent to the processing queue of your YouTrack server.
When processing is finished, the new report is displayed.
Settings
Use the following settings to configure this report.
Setting | Description |
|---|---|
Report name | The name of the report. |
Projects | The projects for which the report is calculated. The projects that are visible in the list are displayed based on your Read Project Basic access permissions. |
Issue filter | The Issue filter and Projects settings let you narrow the scope of your report to receive more precise results. The search query field supports the same syntax and auto-completion that are available in the search box. For the Gantt chart, this query determines which issues are selected as top-level tasks. Issues that are visible to the report owner that do not have parent tasks are set as top-level tasks. Subtasks are added to the report based on their visibility and the value that is set for the Max Task Tree Depth. Top-level issues are usually sorted by issue ID. In cases where there are dependency chains between subtasks in a cluster, the first root issue in the dependency chain becomes the top-level issue for the cluster. This behavior helps to show the critical path for issues in the project. |
Start date | Sets the start date for the issues that are displayed on the chart. The first top-level issue returned by the query is set to start on this date. |
Estimation field | The custom field that determines the estimation for subtasks on the chart. The estimated duration of parent tasks is also derived from the values that are stored in this field for subtasks. You can select a field that stores an integer, period, or float data type. Use the as setting to determine whether the value represents minutes, hours, days, or weeks. |
Spent time field | The custom field that determines the progress toward completion of tasks on the chart. For subtasks, the spent time is equal to the value stored in this field. These values are also used to calculate the overestimation and underestimation for parent tasks. You can select a field that stores an integer, period, or float data type. Use the as setting to determine whether the value represents minutes, hours, days, or weeks. |
Aggregation link | The link type that is used to link parent tasks to their subtasks. The link type parent for is selected by default. The list is filtered to display only outward names of aggregation link types. |
Dependency link | The link type that is used to link successor tasks to predecessor tasks. The link type depends on is selected by default. If you use another link type to show dependencies, select the inward name of a directed link type. |
Max task tree depth | The maximum depth in the issue tree. This setting determines how many levels of tasks are shown in the report. For example, if you set the max tree depth to |
Capacity | Limits the amount of work in progress on a daily basis. The value corresponds to the number of issues that can be scheduled simultaneously. Use this setting to measure how much time is required to finish all estimated tasks when resource constraints limit the number of tasks that can be performed at the same time. |
Constraint | Limits the number of issues that are scheduled simultaneously to one for each value in the selected custom field. This selection is limited to fields that store a Use this setting to limit the number of issues in progress for each member of your team, which would typically be stored in the Assignee field. |
Start date field | Applies constraints for start dates based on the value that is stored in the selected custom field. This selection is limited to fields that store a |
Sort order | Determines which issues are scheduled to start earlier than other tasks. This setting is only visible when the Capacity is limited. The following options are available:
You can also determine the sort order based on issue attributes and values for custom fields. These options let you sort issues according to the selected value in descending or ascending order. The issues are sorted based on the type of data that is stored in the attribute or custom field.
|
Can view and use | Sets the visibility for the report. By default, the report is visible to its owner only. To share the report with other users, select a group or project team from the list. |
Can edit | Determines who has permission to view and edit the report settings. To let other users update the report settings, select a group or project team from the list. |
Example
A report with the following settings displays the project timeline for the Inception Release Planning project. With unlimited capacity, the number of work days that are required to complete all tasks equals the longest string of dependent tasks. The chart is drawn for the Actual view.
Setting | Value |
|---|---|
Project | Dev Portal Migration |
Start Date | 1 Mar 2022 |
Estimation Field | Estimation |
Spend Time Field | Spent time |
Aggregation Link | parent for |
Dependency Link | depends on |
Max Task Tree Depth | 2 |
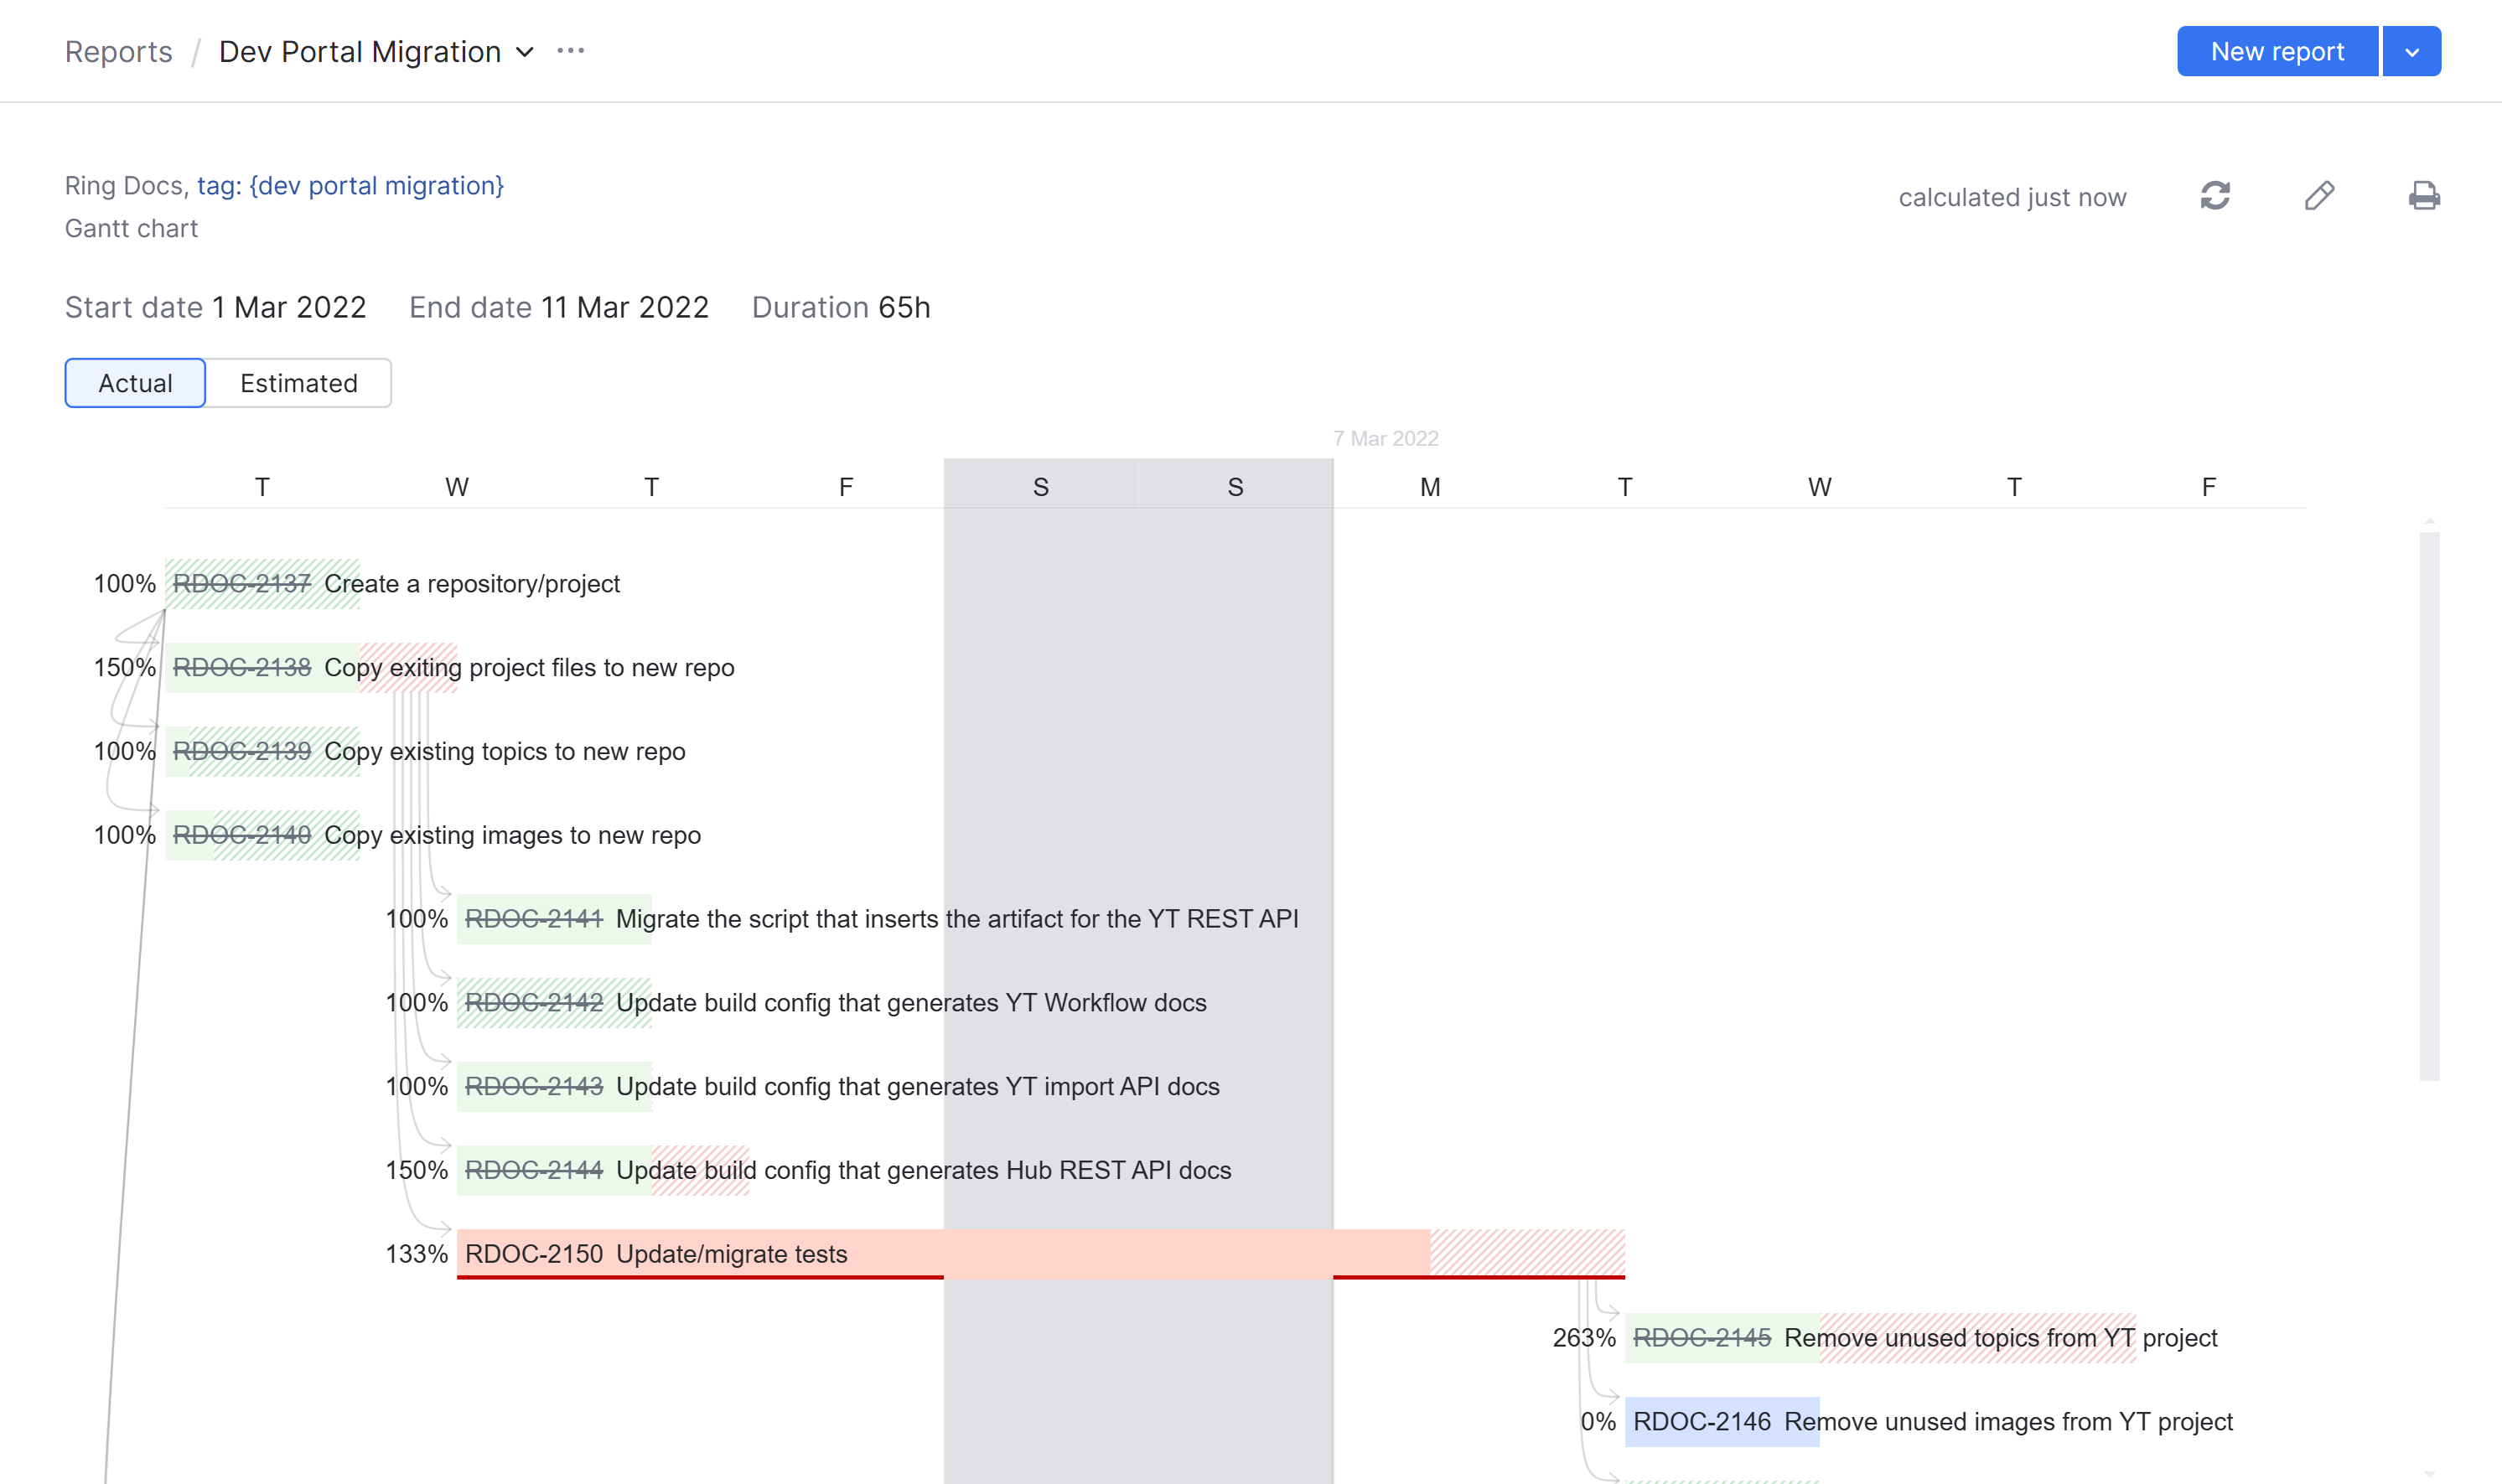
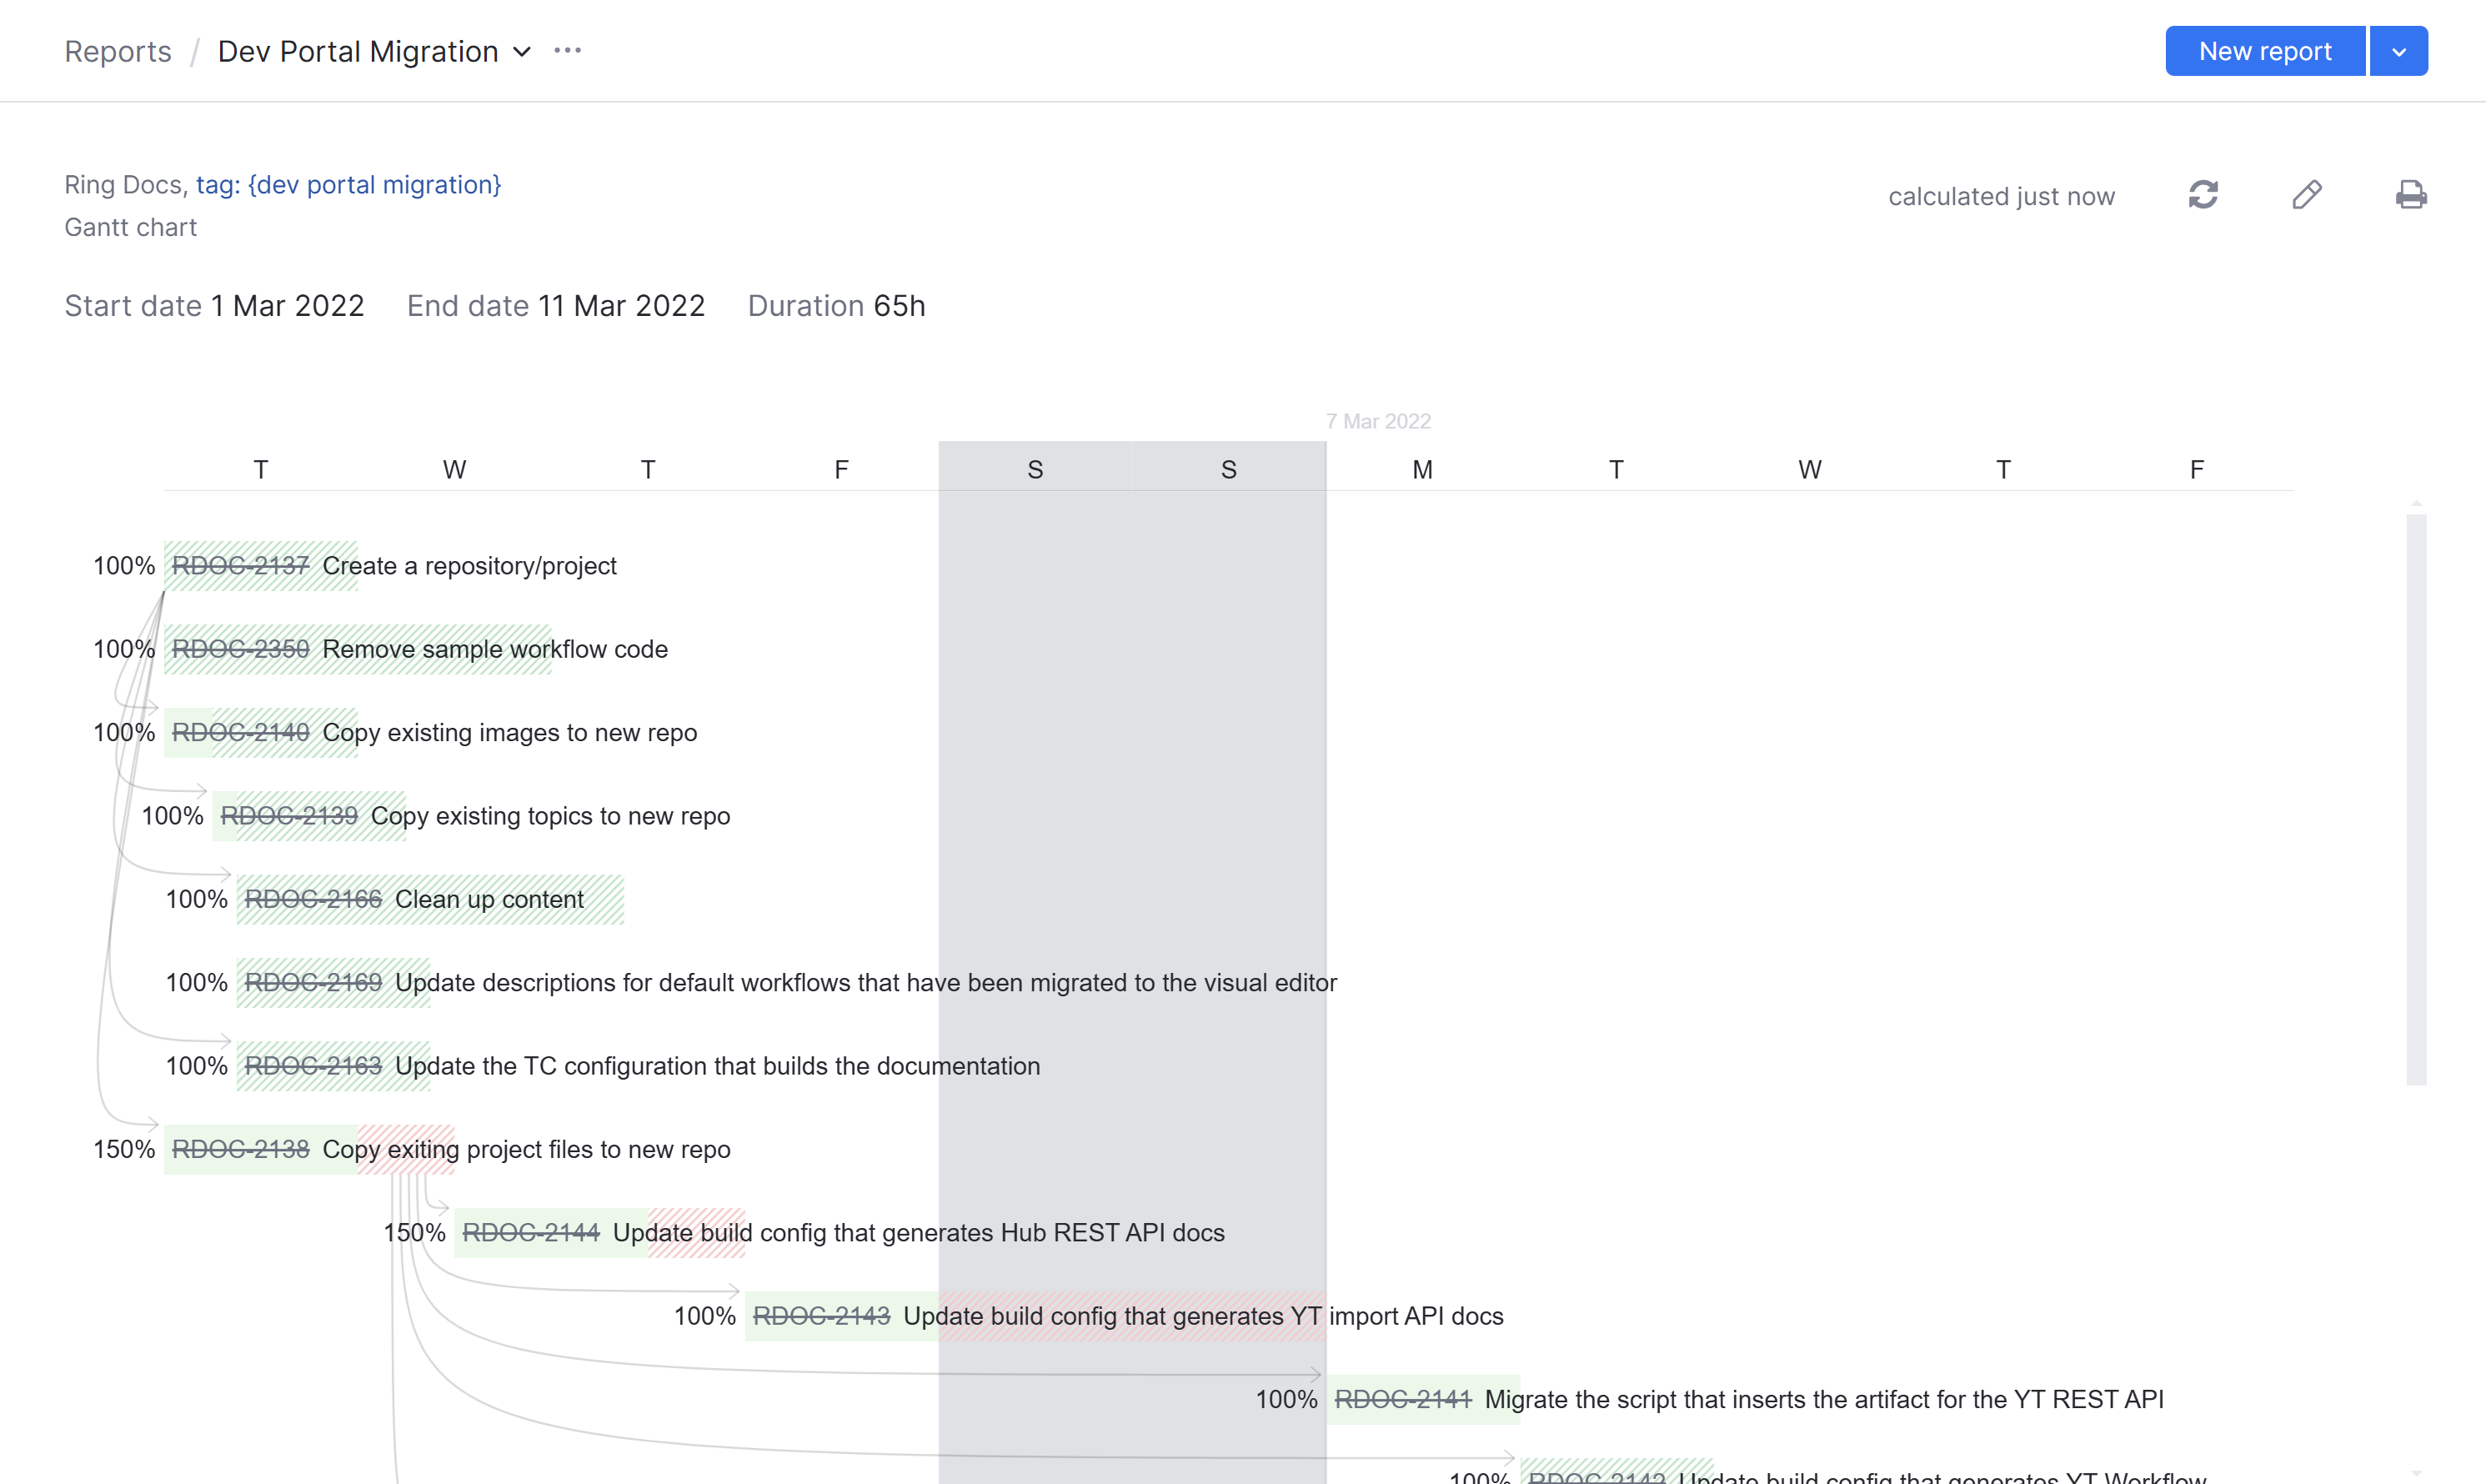
Here is the same chart with the Capacity limited to two tasks. Notice how limiting the work in progress increases the number of work days that are required to complete all tasks. With limited capacity, the chart is automatically drawn for the Actual view. The slider at the bottom of the report lets you scroll horizontally through the chart.
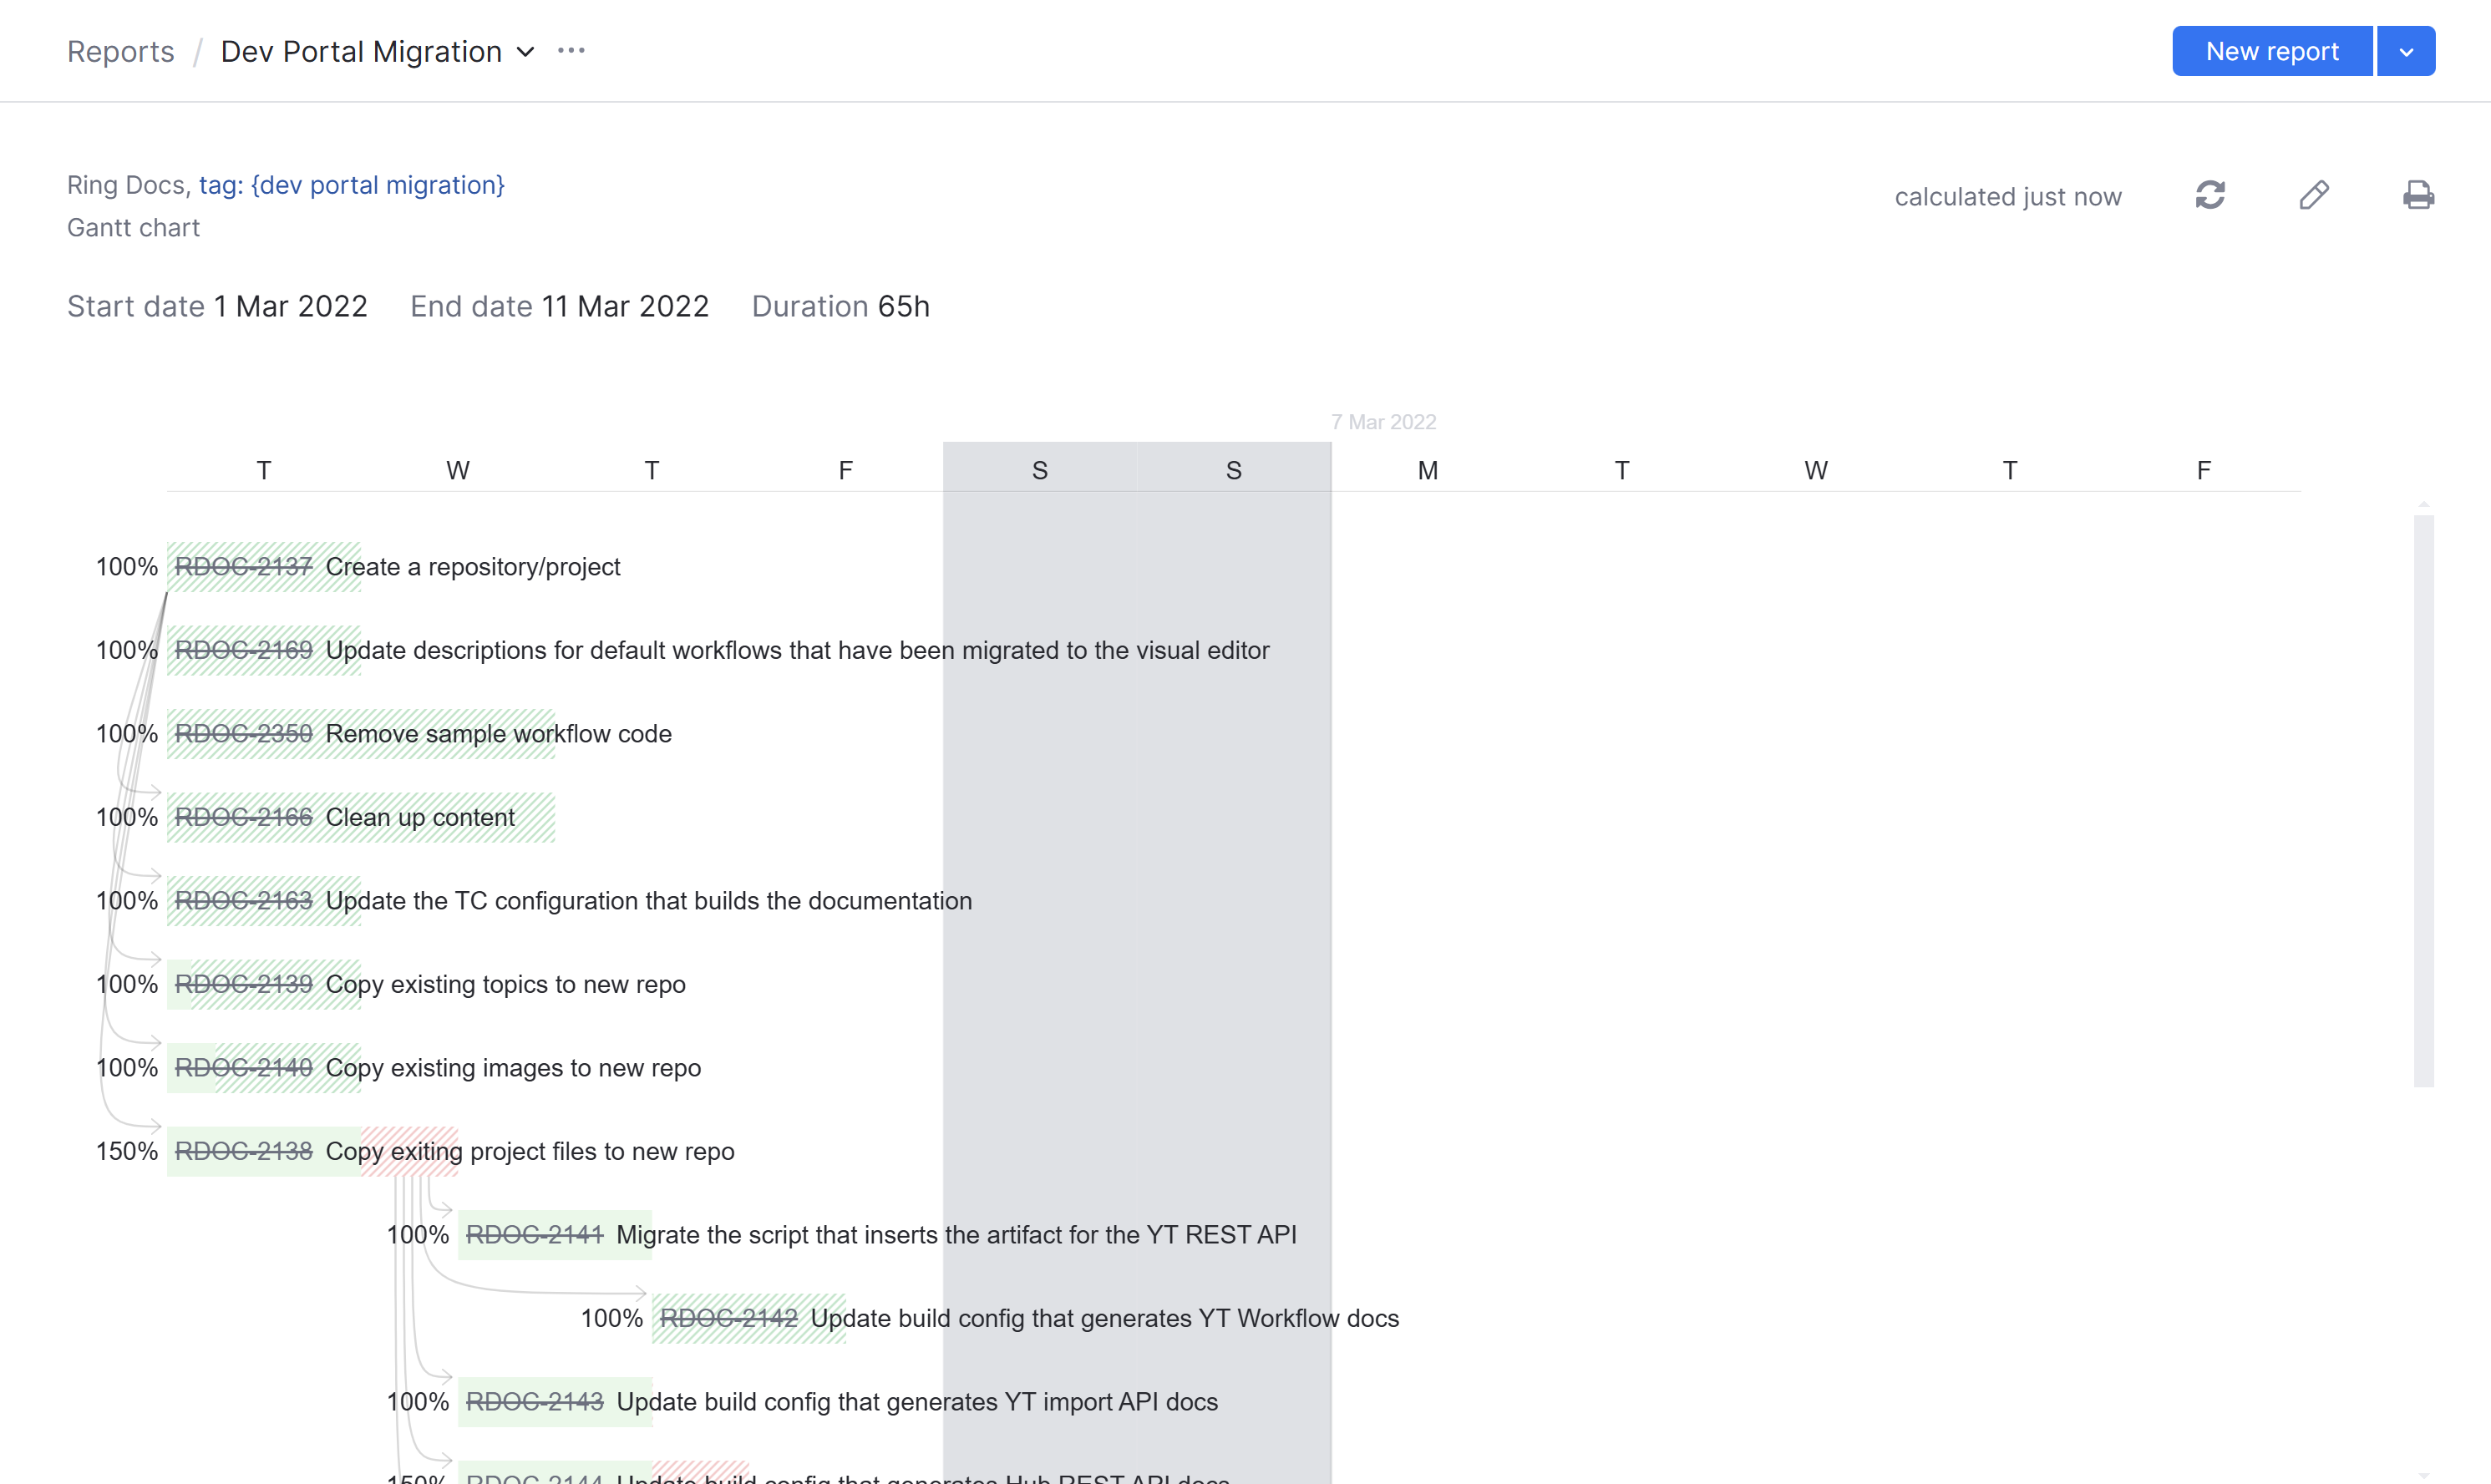
When we increase the capacity to 4 tasks, we see how much faster we can complete all tasks with a few more resources.
Calculations
The values that are displayed in the tooltips for parent tasks are calculated as follows:
Value | Description |
|---|---|
estimated duration | The estimated amount of time that is required to resolve the parent task. This represents the amount of time between the start of the earliest subtask and the estimated completion of the latest subtask. This value is calculated using the longest duration for the cumulative estimation of all subtasks with dependencies. If there are no dependencies between subtasks, this is the estimation for the subtask with the longest duration. The value stored in the estimation field for the parent task is ignored. |
overestimation | This value is shown when the estimated duration is greater than the cumulative spent time. The cumulative spent time is the longest total duration of spent time in a single chain of dependent subtasks. This value is subtracted from the estimated duration. If there are no dependencies between subtasks, the largest amount of spent time in a single subtask is subtracted from the estimated duration. For an example, see Sample Calculations. |
underestimation | This value is shown when the estimated duration is less than the cumulative spent time. The cumulative spent time is the longest total duration of spent time in a single chain of dependent subtasks. This value is subtracted from the estimated duration. If there are no dependencies between subtasks, the largest amount of spent time in a single subtask is subtracted from the estimated duration. The negative number returned by the calculation is displayed as a positive number on the chart. For an example, see Sample Calculations. |
estimated effort | The sum of the estimation for each subtask. This value corresponds with the total working time required to resolve the parent task. |
aggregated spent time | The sum of the spent time for each subtask. |
remaining effort | This value is shown only when the parent task is underestimated. This value is calculated by subtracting the spent time form the estimation of all subtasks that are not underestimated. |
The values that are displayed in the tooltips for subtasks are calculated as follows:
Value | Description |
|---|---|
estimation | The value that is entered in the estimation field for the task. |
spent time | The value that is entered in the spent time field for the task. |
overestimation | This value is shown when the estimation is greater than the spent time and the issue is resolved. This value is calculated by subtracting the spent time value from the estimation value. |
underestimation | This value is shown when the estimation is less than the spent time. This value is calculated by subtracting the spent time value from the estimation value. The negative number returned by the calculation is displayed as a positive number on the chart. |
Sample Calculations
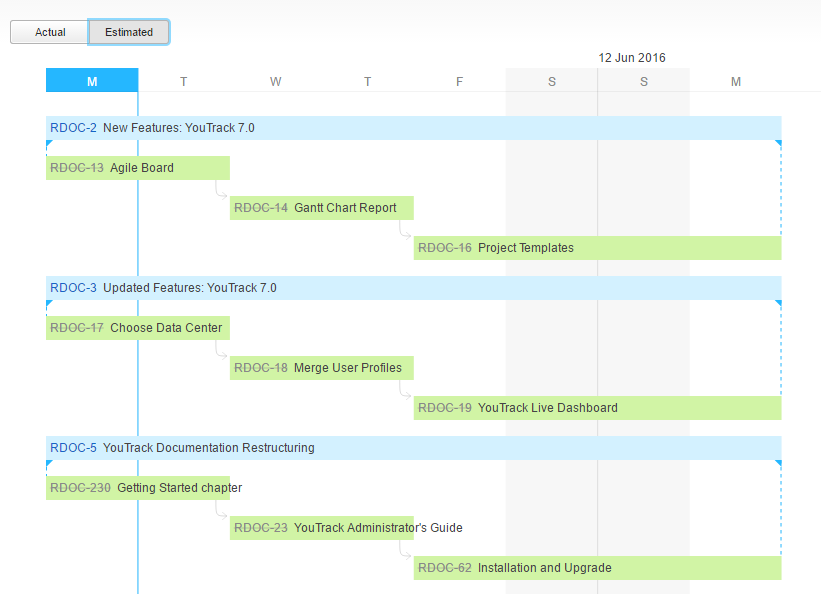
This example demonstrates how overestimation and underestimation values are calculated for parent tasks. The following information is displayed in the report:
There are three parent tasks.
Each summary task has three subtasks. The second and third subtasks depend on the completion of the previous subtask.
Each subtask is estimated to require two days.
All the subtasks are resolved.
The Estimated view is drawn as follows:
When we toggle to the Actual view, the amount of spent time is reflected in the report.
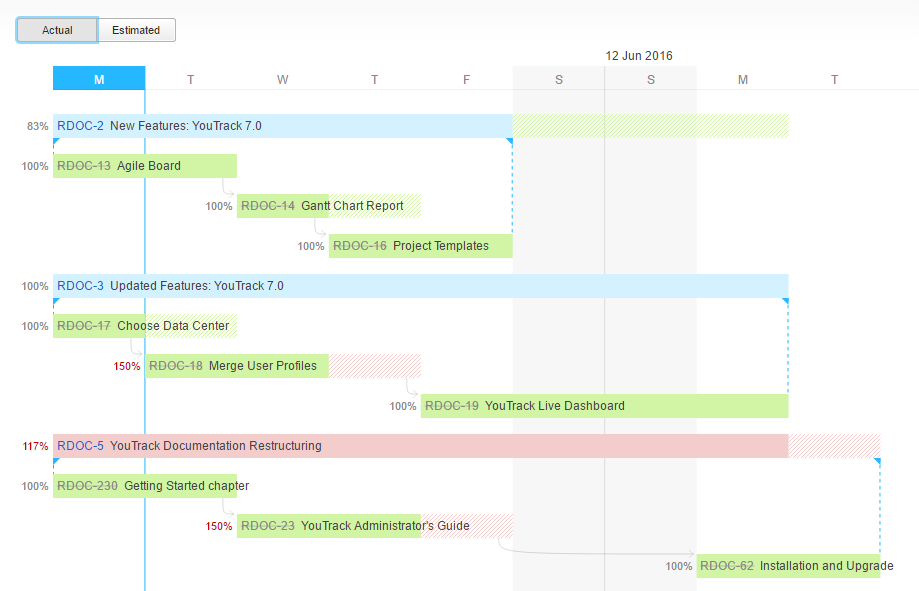
Let's take a closer look at each parent task to see how spent time is used to calculate over- and underestimation values.
In the first parent task, the second subtask was overestimated by one day. As a result, the parent task shows an overestimation. The overestimated value is calculated by subtracting the total duration of the spent time value in each subtask from the estimated duration, as follows:
6d - (2d + 1d + 2d) = 1dIn the second parent task, the first subtask was overestimated by one day, but the second task was underestimated by one day. The third subtask was completed on time. As a result, the parent task was completed on time. The completion time is calculated as follows:
6d - (1d + 3d + 2d) = 0dIn the third parent task, the second task was underestimated by one day. All other subtasks were completed on time. As a result, the parent task was underestimated. The underestimation is calculated as follows:
6d - (2d + 3d + 2d) = -1d
View a Gantt Chart
All reports that you have permission to view are available in a drop-down list in the header of Reports.
To view a Gantt chart:
From the main navigation menu, select
Reports.
Open the drop-down list of reports in the header and select a report.