The State of Developer Ecosystem 2021

This report presents the combined results of the fifth annual Developer Ecosystem Survey conducted by JetBrains. 31,743 developers from 183 countries or regions helped us map the landscape of the developer community.

Here you can find the latest trends in the tech industry, as well as interesting facts about tools, technologies, programming languages, and many other facets of the programming world.


Key Takeaways

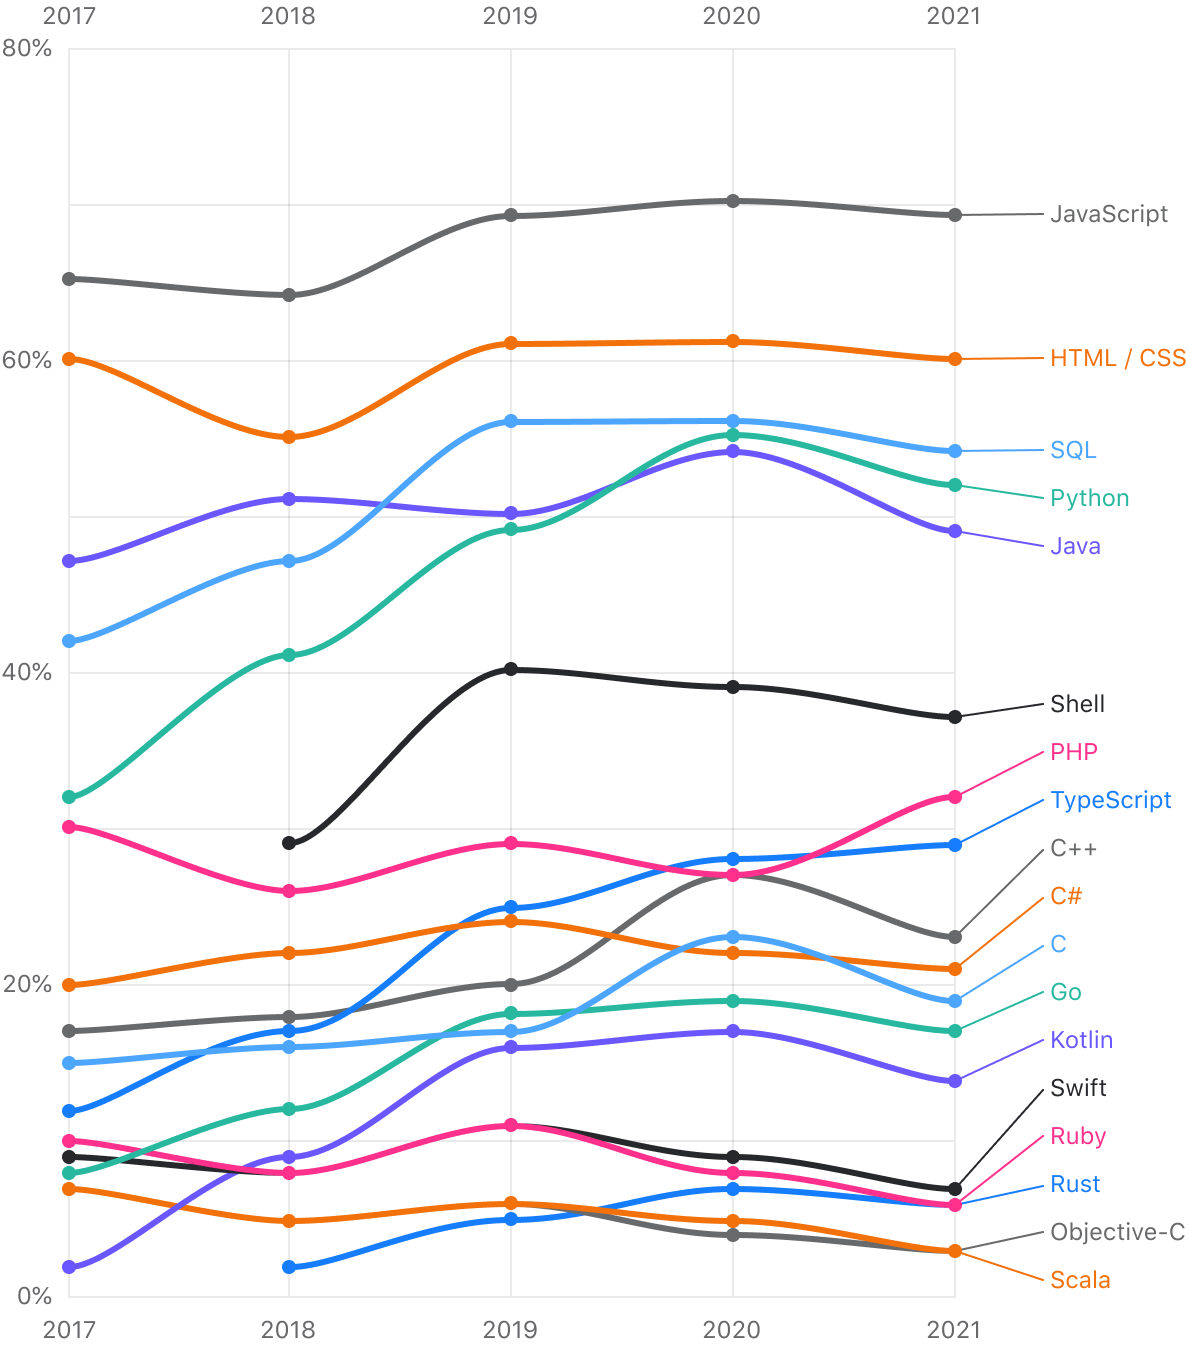
JavaScript is the most popular language.

Python is more popular than Java in terms of overall usage, while Java is more popular than Python as a main language.

The top-5 languages developers are planning to adopt or migrate to are Go, Kotlin, TypeScript, Python, and Rust.

The top-5 languages developers were learning in 2021 were JavaScript, Python, TypeScript, Java, and Go.

Ruby, Objective-C, and Scala have all decreased in popularity over the last 5 years.

The 5 fastest growing languages are Python, TypeScript, Kotlin, SQL, and Go.

A majority of the respondents (71%) develop for web backend.

Programming languages

Used in the last 12 months
Planning to adopt or migrate
JavaScript
69% / 4%
HTML / CSS
60% / 2%
SQL
54% / 3%
Python
52% / 8%
Java
49% / 4%
Shell scripting languages
37% / 2%
PHP
32% / 2%
TypeScript
29% / 9%
C++
23% / 4%
C#
21% / 4%
C
19% / 1%
Go
17% / 11%
Kotlin
14% / 9%
Dart
8% / 4%
GraphQL
8% / 4%
Swift
7% / 5%
Ruby
6% / 3%
Rust
6% / 7%
Groovy
4% / 0%
MATLAB
4% / 1%
R
4% / 2%
Visual Basic
4% / 0%
Assembly
3% / 1%
Lua
3% / 0%
Objective-C
3% / 1%
Scala
3% / 2%
Haskell
2% / 1%
Perl
2% / 0%
Clojure / ClojureScript
1% / 0%
Delphi
1% / 0%
F#
1% / 1%
Julia
1% / 1%
Other
4% / 3%

What programming languages have you used in the last 12 months?

Popularity of programming languages over the last 5 years.

Line chart: Popularity of programming languages over the last 5 years

Please note that some aspects of the survey methodology changed between editions. In 2021 we extended geographical coverage, which resulted in differences in the shares of some languages. For example the share of PHP is 3 percentage points higher, and Python and Java are a bit lower in new regions than in the initial countries.

What are your primary programming languages?

Choose no more than 3 languages

39%32%29%24%22%18%13%12%11% 8% 7%JavaScriptJavaPythonHTML / CSSPHPSQLTypeScriptC#C++GoKotlin
All results

Do you plan to adopt / migrate to other languages in the next 12 months? If so, to which ones?

By primary languages

To
From
Value
-
JavaScriptJavaPythonPHPSQLTypeScriptC#C++GoKotlin
46%50%45%49%49%53%52%46%61%59%No, I'm not planning to adopt / migrate
13%11%14%13%12%13%11%10%0%11%Go
9%13%10%8%11%8%9%11%7%-Kotlin
14%8%9%12%9%-8%7%5%6%TypeScript
10%8%0%11%11%8%9%6%2%6%Python
7%6%9%6%7%12%7%10%17%8%Rust
6%6%6%6%6%6%6%6%4%8%Swift
7%4%5%5%5%7%4%3%4%3%GraphQL
5%4%4%5%4%6%4%3%4%7%Dart
-5%7%2%4%0%4%8%2%3%JavaScript
4%-5%4%4%3%4%6%2%1%Java
4%4%5%3%3%3%-7%1%2%C#
3%4%6%3%3%3%4%0%3%2%C++
3%3%5%1%-2%2%5%1%1%SQL
3%2%3%4%2%2%2%3%1%2%Ruby
14%17%22%11%17%13%16%25%12%12%Other
00.61
JavaScript
Java
Python
PHP
SQL
TypeScript
C#
C++
Go
Kotlin
To
From
Value
-
No, I'm not planning to adopt / migrateGoKotlinTypeScriptPythonRustSwiftGraphQLDartJavaScriptJavaC#C++SQLRubyOther
00.61

On which operating systems are your development environments?

61%Windows
47%Linux
44%macOS
1%Other

Over the last 5 years, developers’ preferences with respect to operating systems have remained constant.

Do you use Windows Subsystem for Linux (WSL) for local development?

65%21%17%14% 2%No, I don’t use itI work with tools installed in WSLI work with the project and tools located in WSLI run my application in WSLOther

This question was shown to all respondents who use Windows as their operating system.

For which platforms do you develop?

71%58%32%30%26%17% 7% 4% 2% 1% 1%Web (Back-end)Web (Front-end)DesktopMobileServer / InfrastructureCloudIoT / EmbeddedI don't develop anythingWebAssemblyConsoles (Xbox / PlayStation / Nintendo etc.)Other

What types of software do you develop (including apps in any programming language, for either professional or personal purposes)?

61%39%29%24%21%19%16%16%14%11% 9%WebsitesUtilitiesDatabase / Data StorageSystem SoftwareLibraries / FrameworksIT InfrastructureFinanceBusiness Intelligence / Data Science / Machine LearningProgramming ToolsEntertainmentGames
All results

In which kinds of activities are you involved?

93%52%44%39%38%27%20%14%13%12%12%Coding / ProgrammingCode ReviewingTestingDeploymentSystem DesignInfrastructure Development / DevOpsSystem AdministrationData AnalysisUX/UI Design/ResearchAcademic ResearchTechnical Writing
All results

What types of software do you develop?

By primary language

Row
Column
Value
-
JavaScriptJavaPythonPHPSQLTypeScriptC#C++GoKotlin
80%56%53%85%66%76%59%39%57%43%Websites
40%37%45%39%38%41%45%44%43%46%Utilities (small apps for small tasks)
30%29%31%36%47%27%37%25%28%21%Database / Data Storage
23%27%24%24%28%23%29%28%31%22%System Software
20%21%20%21%21%30%26%26%31%30%Libraries / Frameworks
16%19%21%19%22%19%17%14%37%15%IT Infrastructure
17%20%13%16%23%20%20%9%16%23%Finance
12%15%31%11%19%12%14%22%13%12%Business Intelligence / Data Science / Machine Learning
13%13%17%14%12%17%15%20%20%16%Programming Tools
12%12%11%11%8%11%12%16%11%20%Entertainment
7%9%10%6%5%8%20%21%6%10%Games
5%6%10%5%5%6%7%10%7%7%Home Automation
5%6%9%5%6%5%6%9%10%5%Security
3%4%6%2%3%3%6%12%4%4%Hardware
2%2%3%1%1%2%6%6%1%3%Augmented Reality / Virtual Reality
2%2%3%2%2%3%2%4%4%2%Blockchain
5%5%5%5%5%7%6%6%5%10%Other
00.85
JavaScript
Java
Python
PHP
SQL
TypeScript
C#
C++
Go
Kotlin
Row
Column
Value
-
WebsitesUtilities (small apps for small tasks)Database / Data StorageSystem SoftwareLibraries / FrameworksIT InfrastructureFinanceBusiness Intelligence / Data Science / Machine LearningProgramming ToolsEntertainmentGamesHome AutomationSecurityHardwareAugmented Reality / Virtual RealityBlockchainOther
00.85

For which platforms do you develop?

By primary language

Row
Column
Value
-
DesktopMobileWeb (Back-end)Web (Front-end)ConsolesServer / InfrastructureIoT / EmbeddedWebAssemblyCloud
61%37%35%31%5%32%35%9%8%Assembly
51%28%39%33%2%27%26%2%12%C
56%35%76%61%4%28%8%5%22%C#
57%32%45%36%4%27%17%3%13%C++
15%20%87%57%0%42%4%6%40%Clojure / ClojureScript
42%15%35%25%-38%4%-26%COBOL
26%37%72%72%-15%---CoffeeScript
60%51%77%73%1%20%1%-5%Crystal
28%92%64%65%1%17%8%1%13%Dart
83%33%61%52%0%24%7%4%11%Delphi
18%21%95%75%-38%5%-30%Elixir
60%16%83%54%-39%11%7%42%F#
21%20%86%47%1%54%8%3%32%Go
--46%54%-----GraphQL
22%23%79%46%0%46%3%1%38%Groovy
59%35%62%51%-23%10%14%18%Haskell
31%36%75%88%1%16%5%2%12%HTML / CSS
30%31%77%50%1%28%7%1%18%Java
28%35%82%86%1%21%5%1%16%JavaScript
26%2%65%19%-46%11%1%34%Julia
21%63%62%43%0%25%6%2%17%Kotlin
39%44%52%34%13%39%11%2%2%Lua
55%18%17%16%1%15%32%1%14%MATLAB
25%94%27%41%0%14%7%3%7%Objective-C
36%29%78%52%-50%14%1%21%Perl
24%31%95%80%0%25%5%1%14%PHP
39%25%66%48%1%32%11%1%22%Python
48%24%36%32%0%24%18%3%21%R
18%27%88%69%1%35%4%1%20%Ruby
45%21%72%46%2%54%17%17%29%Rust
19%10%82%40%0%52%6%2%36%Scala
29%16%69%42%1%58%10%2%34%Shell scripting languages
31%24%86%60%0%31%5%1%20%SQL
32%90%46%45%2%16%9%2%12%Swift
27%37%80%89%0%26%6%4%22%TypeScript
61%26%43%35%0%19%8%1%7%Visual Basic
00.95
Desktop
Mobile
Web (Back-end)
Web (Front-end)
Consoles
Server / Infrastructure
IoT / Embedded
WebAssembly
Cloud
Row
Column
Value
-
AssemblyCC#C++Clojure / ClojureScriptCOBOLCoffeeScriptCrystalDartDelphiElixirF#GoGraphQLGroovyHaskellHTML / CSSJavaJavaScriptJuliaKotlinLuaMATLABObjective-CPerlPHPPythonRRubyRustScalaShell scripting languagesSQLSwiftTypeScriptVisual Basic
00.95

Popularity of programming languages

By region

Row
Column
Value
-
JavaScriptJavaPythonPHPSQLTypeScriptC#C++GoKotlin
47%25%25%33%18%10%13%9%4%5%Africa, Middle East, Central Asia
50%29%21%19%24%13%16%5%5%5%Argentina
36%26%18%15%17%13%16%7%3%5%Belarus
50%28%25%24%24%14%13%5%3%8%Brazil
41%31%36%19%14%16%15%13%5%6%Canada
32%47%30%9%15%11%8%13%15%6%China
36%24%22%28%19%18%15%10%5%6%East Europe, Balkan and Caucasus
47%21%20%43%17%18%8%7%5%4%France
32%33%23%32%15%19%15%11%7%8%Germany
40%38%44%12%16%9%5%23%5%7%India
28%25%29%21%18%18%13%8%10%9%Japan
50%30%30%23%24%14%16%5%4%7%Latin America
52%35%29%23%25%12%18%7%2%7%Mexico
37%24%24%34%18%17%18%8%4%7%Northern Europe and Benelux
43%28%23%30%17%17%13%9%5%6%Other Europe
42%27%27%26%18%13%13%8%8%8%Other South-East Asia and Oceania
28%18%23%19%23%13%15%13%9%8%Russian Federation
40%53%31%5%21%10%6%11%4%10%South Korea
43%34%24%31%23%15%11%4%5%7%Spain
37%23%25%21%20%6%34%7%4%6%Turkey
38%20%18%22%21%14%15%6%6%4%Ukraine
41%22%27%33%18%16%16%8%6%4%United Kingdom
40%27%35%27%21%13%13%12%7%6%United States
00.53
JavaScript
Java
Python
PHP
SQL
TypeScript
C#
C++
Go
Kotlin
Row
Column
Value
-
Africa, Middle East, Central AsiaArgentinaBelarusBrazilCanadaChinaEast Europe, Balkan and CaucasusFranceGermanyIndiaJapanLatin AmericaMexicoNorthern Europe and BeneluxOther EuropeOther South-East Asia and OceaniaRussian FederationSouth KoreaSpainTurkeyUkraineUnited KingdomUnited States
00.53

There are languages not listed in this table that are popular in some regions: Delphi is the primary language of 3% of the developer population in Brazil, for example, while Ruby (9%), Swift (6%), and Scala (4%) are popular in Japan.

Gender and development

In which kinds of activities are you involved?

By gender

94%53%44%40%40%28%20%13%13%12%12%Coding / ProgrammingCode ReviewingTestingDeploymentSystem DesignInfrastructure Development / DevOpsSystem AdministrationData AnalysisUX/UI Design/ResearchAcademic ResearchTeaching Programming
All results

The Other option includes non-binary, genderqueer, or gender non-conforming as well as other — write in and prefer not to say option. Although the sample is too small to make any reliable conclusions from it.

Women are more likely than men to be involved in data analysis, machine learning, and UX/UI design or research. Women are less likely than men to be involved in infrastructure development and DevOps, system administration, or Deployment.

Gender distribution

By region

Male
Female
Other
85%13%2%87%12%1%89%8%3%89%10%1%92%6%2%92%5%3%92%7%1%92%6%1%93%6%1%93%5%1%93%4%3%94%5%1%94%5%1%94%6%1%94%5%1%94%4%2%94%5%1%94%4%2%94%5%1%94%3%3%94%4%2%95%2%3%95%3%2%South KoreaBelarusCanadaArgentinaOther South-East Asia and OceaniaUnited StatesRussian FederationUkraineSpainTurkeyUnited KingdomEast Europe, Balkan and CaucasusAfrica, Middle East, Central AsiaLatin AmericaIndiaNorthern Europe and BeneluxBrazilFranceMexicoGermanyOther EuropeChinaJapan

Professional coding experience

By gender

To
From
Value
-
MaleFemaleOther
81%15%4%I don't have any professional coding experience
88%10%3%Less than 1 year
92%6%2%1–2 years
94%4%2%3–5 years
96%2%2%6–10 years
96%2%2%11–16 years
97%2%2%16+ years
00.97
Male
Female
Other
To
From
Value
-
I don't have any professional coding experienceLess than 1 year1–2 years3–5 years6–10 years11–16 years16+ years
00.97

The diversity in the tech industry is increasing among younger developers.

Which platforms do you target with your projects?

86%Windows
58%Linux
39%macOS
9%Other

This question was only shown to respondents who develop for desktop platforms.

Languages

What language do you use at work?

78%20% 9% 6% 5% 5% 4% 4% 4% 3% 2%EnglishChineseJapaneseSpanishRussianHindiGermanFrenchPortugueseKoreanArabic
All results

Share of English as working language by regions

100%100% 99% 96% 91% 91% 90% 90% 89% 89% 89%United KingdomUnited StatesIndiaCanadaAfrica, Middle East, Central AsiaTurkeyEast Europe, Balkan and CaucasusUkraineNorthern Europe and BeneluxOther South-East Asia and OceaniaGermany
All results

Do you speak at home or with friends in the same language as you use at work?

Yes
No
86%14%

What languages do you use with family and friends?

17%14%13% 9% 7% 4% 4% 4% 3% 3% 3%EnglishChineseHindiSpanishRussianPortugueseArabicFrenchGermanTamilBengali
All results

Migration

Immigration rate

29%23%22%19%18%17%16%12%12% 9% 8%CanadaUnited KingdomNorthern Europe and BeneluxOther EuropeOther South-East Asia and OceaniaUnited StatesGermanySpainJapanLatin AmericaRussian Federation
All results

Immigration rate = the number of people working in a region who were born in a different region / the total number of people working work in that region

Emigration rate

29%20%18%14%14%13%12%12%11%11%10%UkraineBelarusEast Europe, Balkan and CaucasusLatin AmericaTurkeyUnited KingdomCanadaRussian FederationOther EuropeFranceAfrica, Middle East, Central Asia
All results

Emigration rate = The number of people who were born in one country but work in a different one / the total number of people born in that country

Salary

Median value of annual net (after tax) salary in USD, excluding any bonuses

By regions

102000 54000 54000 33000 33000 33000 27000 27000 27000 27000 27000United StatesCanadaUnited KingdomGermanyJapanNorthern Europe and BeneluxFranceOther EuropeOther South-East Asia and OceaniaSouth KoreaUkraine
All results

Salary by job role

5400054000330003300033000330002700027000270002700027000ArchitectCIO / CEO / CTODevOps Engineer / Infrastructure DeveloperData Analyst / Data Engineer/ Data ScientistTeam LeadProduct ManagerDeveloper / Programmer / Software EngineerDBATester / QA EngineerTechnical SupportTechnical Writer
All results

Find the right tool

Choose your technology

Choose

Download the tool you need

Choose
Try for free

Thank you for your time!

We hope you found our report useful. Share this report with your friends and colleagues.

Join JetBrains Tech Insights Lab

Take part in surveys and UX studies to make JetBrains products easier to use yet even more powerful. For participating in our research, you’ll also get the chance to earn rewards.

If you have any questions or suggestions, please contact us at surveys@jetbrains.com.