User interface
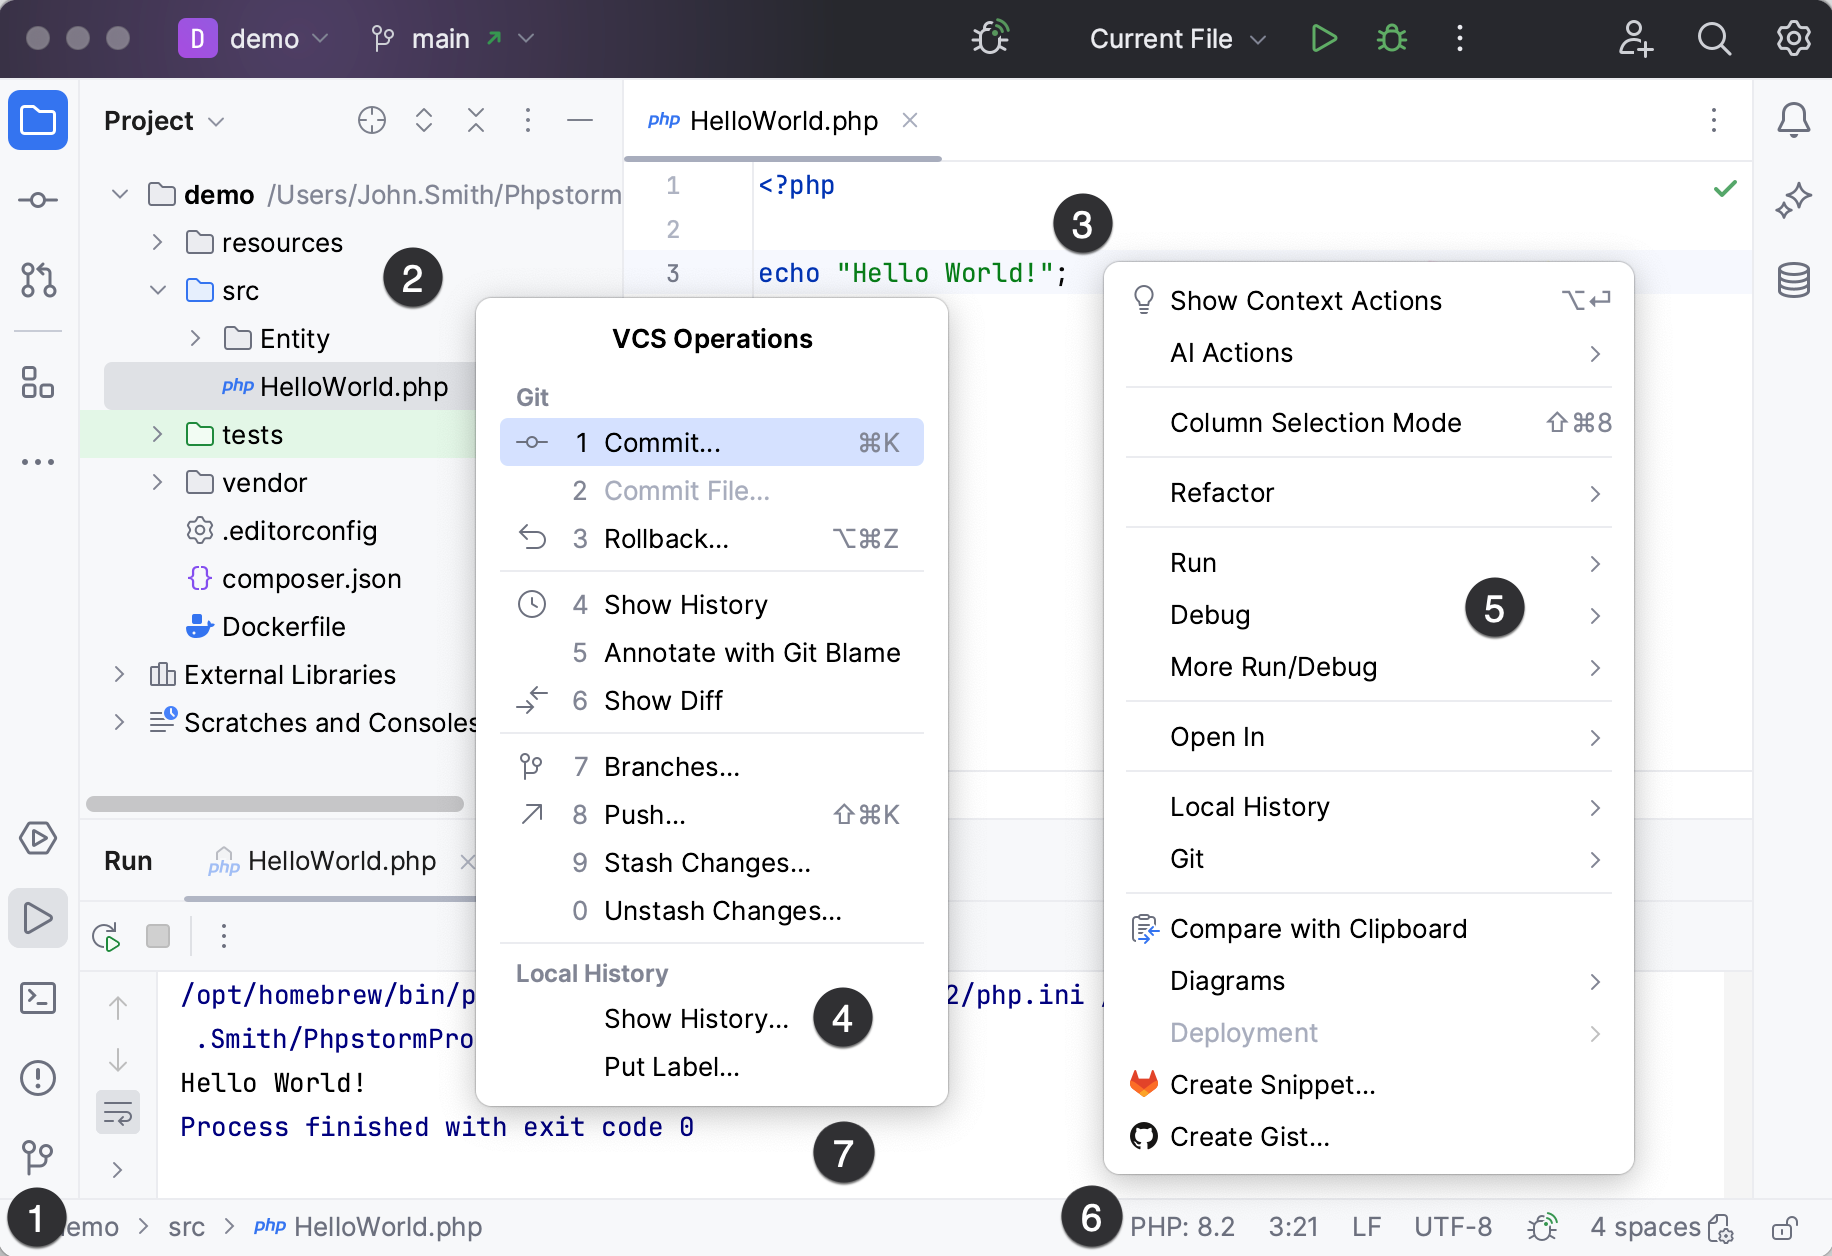
When you open a project in PhpStorm, the default user interface looks as follows:

Depending on the set of plugins and configuration settings, your IDE may look and behave differently.
Focus: AltHome
Show/hide: View | Appearance | Navigation Bar
The navigation bar is a quick alternative to the Project view, where you can go through the structure of your project, open specific files, and jump to specific code elements in the current file.
It is located in the status bar at the bottom of the main window. You can change its location: in the main menu, go to View | Appearance | Navigation Bar and select Top to display the navigation bar in the top part of the IDE window or Don't show to disable it.
note
The main toolbar with buttons for opening and saving files, undo and redo actions is hidden by default. To show it, select View | Appearance | Toolbar.
Focus: Esc
Use the editor to read, write, and explore your source code .
Open the list of available actions: AltEnter
Various icons that appear in the gutter, for example, ![]() , help you notice quick-fixes and other actions. Clicking such action indicator or pressing AltEnter opens an action list with all other actions that are available at the current caret position.
, help you notice quick-fixes and other actions. Clicking such action indicator or pressing AltEnter opens an action list with all other actions that are available at the current caret position.
Show/hide: View | Appearance | Status Bar
The left part of the status bar at the bottom of the main window shows the most recent event messages. Click a message in the status bar to open it in the Notifications tool window. Right-click the message in the status bar and select Copy to paste the message text when you are searching for a solution to a problem or need to add it to a support ticket or to the PhpStorm issue tracker.
The status bar also shows the progress of background tasks. You can click to show the Background Tasks manager.
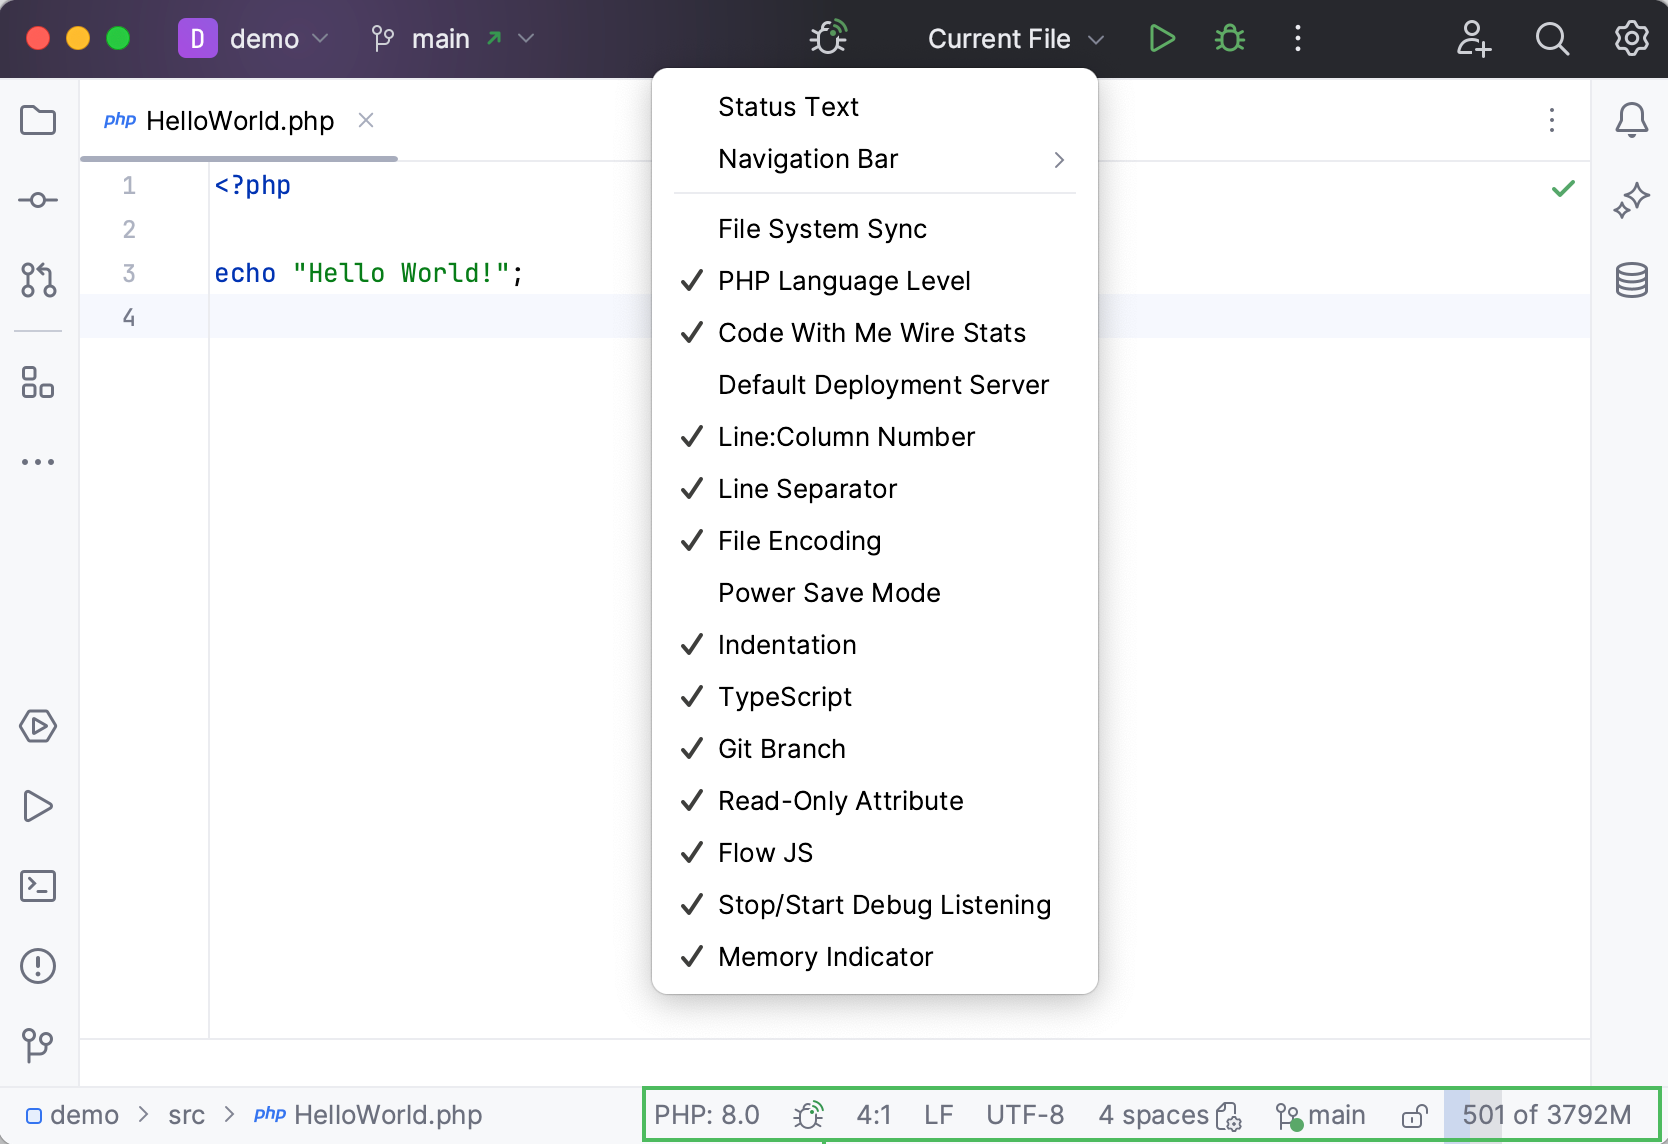
The right part of the status bar contains widgets that indicate the overall project and IDE status and provide access to various settings. Depending on the set of plugins and configuration settings, the set of widgets can change. Right-click the status bar to select the widgets that you want to show or hide.
The blinking icon in the status bar indicates that an internal IDE error has occurred. Click to view the error descriptions and submit reports.

Widget | Description |
|---|---|
| Click to specify the PHP functionality scope to get coding assistance for. Each functionality scope is associated with the PHP version that supports this functionality. Currently PHP 5.3, PHP 5.4, PHP 5.5, PHP 5.6, PHP 7, PHP 7.1, PHP 7.2, PHP 7.3, PHP 7.4, PHP 8.0, PHP 8.1, and PHP 8.2 levels are supported. For more information, refer to supported PHP versions. When you open an existing project, PhpStorm analyzes it for the language features used and sets the appropriate language level automatically.
|
52:11 | Shows the line and column number of the current caret position in the editor. Click the numbers to move the caret to a specific line and column. If you select a code fragment in the editor, PhpStorm also shows the number of characters and line breaks in the selected fragment. |
LF | Shows the line endings used to break lines in the current file. Click this widget to change the line separators. |
UTF-8 | Shows the encoding used to view the current file. Click the widget to use another encoding. |
Column | Indicates that the column selection mode is enabled for the current editor tab. You can press AltShiftInsert to toggle it. |
| Click to lock the file from editing (set it to read-only) or unlock it if you want to edit the file. |
| If version control integration is enabled, this widget shows the current VCS branch. Click it to manage VCS branches. |
2 spaces | Shows the indent style used in the current file. Click to configure the tab and indent settings for the current file type or disable indent detection in the current project. |
| Click to start/stop listening for incoming debug connections in a PHP debugging session. |
| Shows the amount of memory that PhpStorm consumes out of the total amount of heap memory. For more information, refer to Increase the memory heap of the IDE. |
| Click to set any of the configured deployment servers or server groups as default for performing deployment operations. |
Show/hide: View | Tool Windows
Tool windows provide functionality that supplements editing code. For example, the Project tool window shows you the structure of your project, and the Run tool window displays the output of your application when you run it.
By default, tool windows are docked to the sides and bottom of the main window. You can arrange them as necessary, undock, resize, hide, and so on. Right-click the title of the tool window or click in the title for its arrangement options.
You can assign shortcuts to quickly access the tool windows that you frequently use. Some of them have shortcuts by default. For example, to open the Project tool window , press Alt01, and to open the Terminal tool window, press AltF12. To jump from the editor to the last active tool window, press F12.
You can right-click various elements of the interface to see the actions available in the current context of this element. For example, right-click a file in the Project tool window for actions related to that file, or right-click in the editor to see actions that apply to the current code fragment.
Most of these actions can also be performed from the main menu at the top of the screen or the main window. Actions with shortcuts show the shortcut next to the action name.
Popup menus provide quick access for actions related to the current IDE and project context. Here are some useful popup menus and their shortcuts:
AltInsert opens the Generate popup for generating boilerplate code based on the context.
CtrlAltShift0T opens the Refactor This popup with a list of contextually available refactorings.
AltInsert in the Project tool window opens the New popup for adding new files and directories to your project.
Alt0` opens the VCS Operations popup with contextually available actions for your version control system.
You can create custom popup menus using quick lists of actions that you often use.
The bars on the sides of the main window contain icons of tool windows. Click an icon to show or hide the tool window. A right-click on an icon will open the context menu, where you can hide or move the tool window. You can also drag tool window icons to rearrange tool windows.
Tool window icons in the upper parts of the left and right bars open vertical tool windows on the left and right sides of the IDE window.
The icons in the bottom parts of the bars open horizontal tool windows at the bottom of the IDE window.
Learn more from Tool window bars and buttons.
Several widgets are located in the toolbar in the window header. From left to right:

Main menu (Windows and Linux only)
The main menu is now hidden under the
menu icon. To access menu categories, click the icon or press Alt0\. The elements will appear horizontally over other header widgets.
You can display the main menu as a separate toolbar: go to Settings | Appearance & Behavior | Appearance and enable the Show main menu in a separate toolbar option. Alternatively, go to View | Appearance and enable Show Main Menu in Separate Toolbar.
Project widget
The widget shows the name of the current project, allows switching between recent projects, creating new projects, and opening existing ones.
VCS widget
The widget shows the current branch, allows switching branches, and provides the most popular VCS actions like update project, commit and push changes.
It has replaced the branch widget previously located in the status bar at the bottom of the main window, and VCS actions icons previously located in the navigation bar in the upper right corner.
Run widget
The widget allows you to start run/debug configurations, select other configurations to run, and change the mode for the current configuration (run or debug). You can edit, pin, or delete configurations using this widget.
When a process is running, you can restart or stop it using the widget.
tip
The toolbar in the window header is customizable. You can add and remove widgets and buttons, change the toolbar color and project icon, or hide the toolbar.
The gutter is the panel located in the editor on the left. It contains action icons that allow you to fix code issues, run or debug your code, and use other framework-specific features. Line numbers, breakpoints, and bookmarks are also shown in the gutter.
The gutter also allows you to fold code, marks modified lines for projects under version control, and shows code coverage results.
The main window lets you work with a single PhpStorm project. You can open multiple projects in multiple windows or in a single window. By default, the window header displays the name of the project and the name of the currently open file. If there are multiple projects, it will also show the name of the relevant project.
To show the full path to the current file, select Always show full paths in window header on the Appearance & Behavior | Appearance settings page CtrlAlt0S.
Thanks for your feedback!