Action indicators and action list
AltEnter (ReSharper_AltEnter)
Among the most noticeable things that ReSharper adds to the Visual Studio text editor are Action Indicators and the Action List. They appear in all files supported by ReSharper (C#, VB.NET, XML, CSS, JavaScript, ASP.NET, and so on) to notify you about available actions and help you apply them.
Action indicators are icons that, depending on your settings, appear in the Action bar, in the left margin and/or the body of the text editor. These icons identify actions available in the corresponding line and caret position. If there are several actions available in the same place, the icon corresponding to the action of the highest priority is shown.
tip
You can also choose one of several styles for indicator icons using the Application icons theme selector on the Environment | General page of ReSharper options.
There are two types of action indicators: fixed indicators and context-sensitive indicators.
Fixed indicators are always shown and notify about the following:
| The method is a unit test and you can run and debug it. |
| The class is a unit test class and you can run and debug containing tests. |
| The unit test has passed during the last execution. |
| Tests in the unit test class have passed during the last execution. |
| The unit test has failed during the last execution. |
| At least one test in the unit test class has failed during the last execution. |
| The unit test was ignored during the last execution. |
| All tests in the unit test class were ignored during the last execution. |
| The interface or the interface member has implementations; you can navigate to these implementations. |
| The class has derived classes or the class member is overridden elsewhere; you can navigate to these inheritors and overrides. |
| The member hides another member from a base type; you can navigate to the hidden member. |
| The member hides one member and implements another member from the inheritance hierarchy; you can navigate to both the hidden and the overridden members. |
| The type or type member implements an interface; you can navigate to the interface type or member. |
| The member implements an interface member that has a default implementation and you can navigate to it. |
| The class is inherited from another class or the class member overrides a virtual or abstract member; you can navigate to the base class or member. |
| The class implements an interface and inherits from a base class, or the member overrides a virtual or abstract member, which implements an interface member; you can navigate to the overridden and implemented types or members. |
| There are implict namespace imports, such as global imports that affect the current file. You can click this indicator or press AltEnter when the caret is at the first line to view the whole list of implicitly imported namespaces as well as files where they are located: |
| The call is recursive. If this is a tail call, ReSharper suggests a quick-fix to replace recursion with iteration. |
| The resource is overridden for specific cultures and you can navigate to the derived definitions. |
| The resource is defined in the base culture and you can navigate to the definition in the default culture. |
| There is a bookmark at this line. |
| The static method has a run configuration. |
| This indicator appears in C++ header and source files and notifies you that there is either declaration/definition the current symbol or primary template/specialization for the class template. You can use this indicator to navigate to the corresponding items. |
Caret-sensitive indicators show up as soon as you place the caret to a specific place in the code and suggest one or more actions that may be helpful at this place.
tip
Appearance of action indicators is configurable. Use the Action indicator style option on the Environment | Editor | Appearance) page of ReSharper options.
Most of the time ReSharper can indicate several actions at your caret position and therefore often an indicator of a specific action with a higher priority hides several more actions with lower priority.
Caret-sensitive action indicators in the list below are shown in the order of their priorities (from high to low):
| Suggests a quick-fix for the detected code issue with the Error severity level. |
| Suggests to find an unresolved type or namespace in the NuGet package gallery, |
| Suggests an inplace refactoring or a refactoring that can fix the detected code issue. |
| Suggests a quick-fix for the detected code issue with Warning, Suggestion or Hint severity level. |
| Suggests a Visual Studio's code correction or refactoring action. |
| Suggests a quick-fix for redundant code that can be safely removed. |
| Suggests to run current unit tests or unit test class. |
| Suggests to debug current unit tests or unit test class. |
| (appears if JetBrains dotTrace is integrated with Visual Studio) - suggests profiling current unit tests or unit test class. |
| (appears if JetBrains dotCover is integrated with Visual Studio) Suggests performing code coverage on current unit tests or unit test class. |
| Suggests to append current unit tests or unit test class to existing unit test session. |
| Suggests to create a new unit test session for the current unit test or unit test class. |
| (appears if JetBrains dotMemory is integrated with Visual Studio) Suggests installing the dotMemory Unit Testing Framework NuGet package and references it in the unit test project where the current file belongs. |
| (appears when you place the caret at the declaration of a public static method without parameters) Suggests debugging this method with an anonymous run configuration. For more information, refer to Run configurations. |
| (appears when you select a code block) Suggests reformatting selected code. |
| Suggests a context action. |
| Suggests a code annotation context action. |
| (appears when you select a code block) Suggests a surround action and surround templates for the selection. |
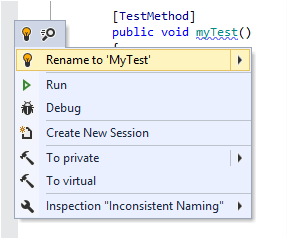
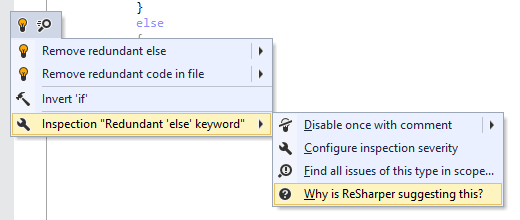
If you click a particular action indicator or press AltEnter while your caret is in the corresponding position, all available actions appear in a popup called Action list:

You are free to choose whether to use the suggestions or not, but it often worth taking a look at what is available at the current caret position.
note
The most of suggested actions appear as a result of Code inspections. Therefore, if the code inspection is disabled, ReSharper will only suggest context actions and surround actions.
Action list also displays the search ![]() icon. It appears to remind you that you can navigate to action right from the action list by starting to type the action name or related words.
icon. It appears to remind you that you can navigate to action right from the action list by starting to type the action name or related words.
If ReSharper detects one or more code issues under your caret, the Inspection [name of inspection] ![]() sub-menu appears in the action list for each issue detected with a configurable inspection. You can use items of this sub-menu to configure options of the corresponding inspection.
sub-menu appears in the action list for each issue detected with a configurable inspection. You can use items of this sub-menu to configure options of the corresponding inspection.
