Performance tuning tips
This article provides an overview of techniques to help improve CLion performance when working with large-scale projects.
CLion Nova is an improved version of CLion that uses the ReSharper C++/Rider C++ language engine instead of the legacy CLion Classic engine. It provides better responsiveness, accuracy, and performance for the IDE.
CLion Nova is enabled by default for new users. If you are using CLion Classic and would like to try CLion Nova, click the IDE and Project Settings button () on the toolbar and then click Switch to Nova Engine:
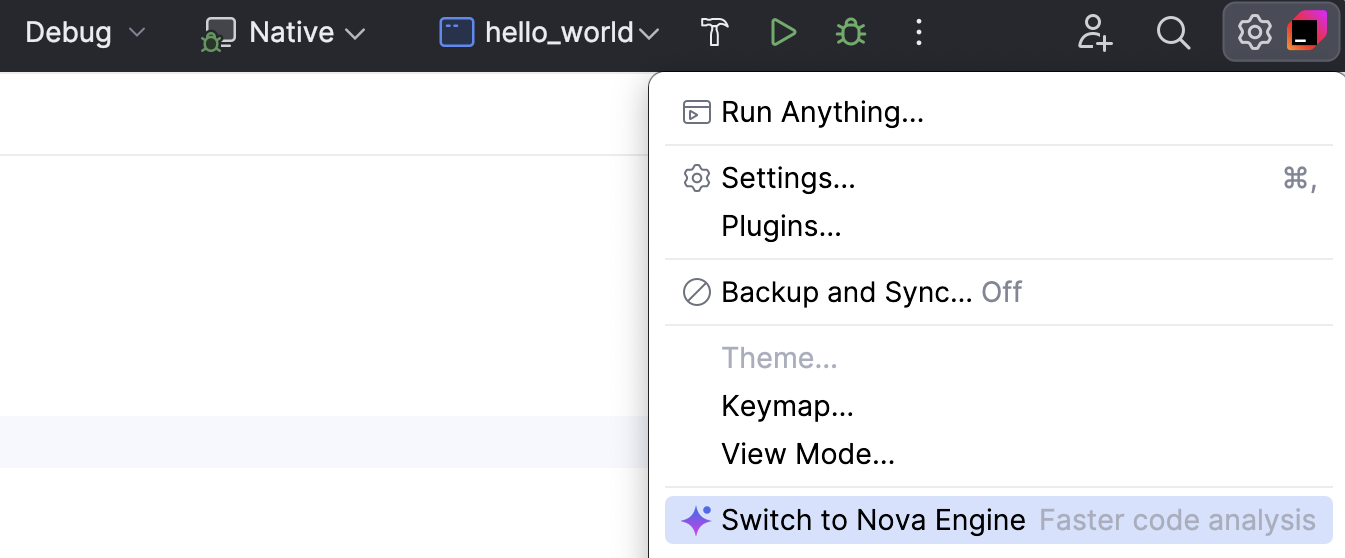
You can also enable CLion Nova in Advanced Settings.
We recommend using the latest version of the IDE with CLion Nova enabled. For example, various improvements in v2024.3 have reduced CLion Nova’s memory usage and improved overall IDE performance compared to v2024.2. This is especially noticeable in large projects like Chromium ones.
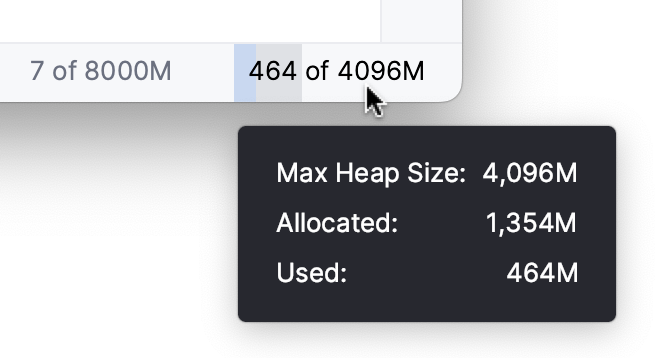
You can check whether performance slowdowns are caused by low heap memory by monitoring two indicators in the bottom right corner of the status bar: the general Memory Indicator and the Clangd Memory Usage indicator.
Press CtrlShift0A to open the Find Action dialog.
Start typing memory, then enable two options, Show Clangd Memory Usage and Show memory indicator:

CLion will add the indicators to the status bar:

tip
Both indicators can be switched on/off from the status bar context menu.
Select Help | Change Memory Settings from the main menu.
In the dialog that opens, set a higher memory heap value in the Maximum Heap Size field.
Click Save and Restart.
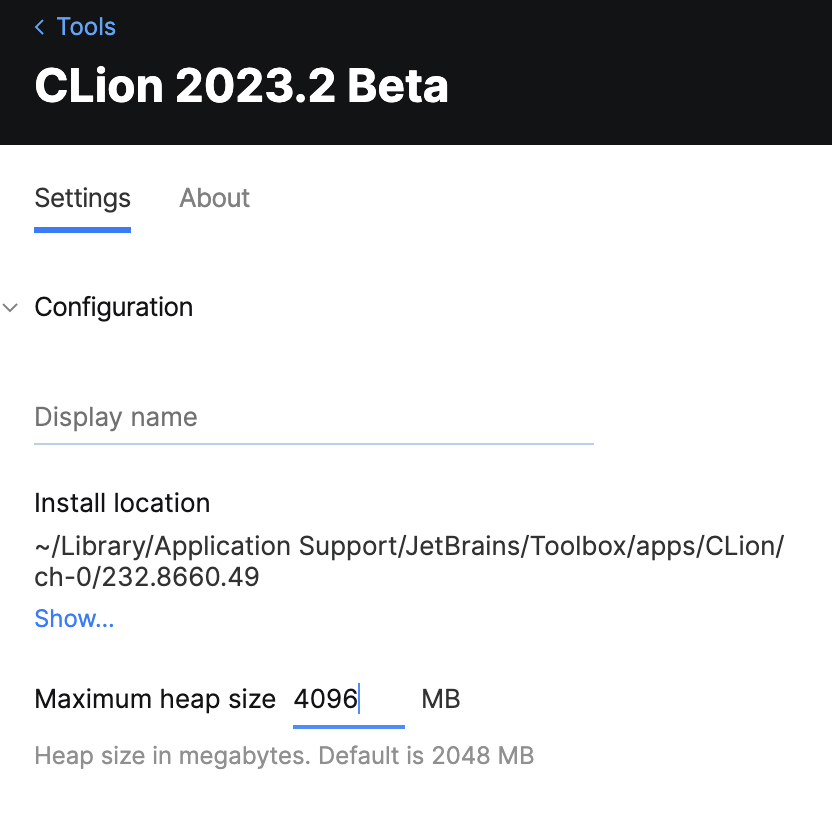
You can also change the heap size from the Toolbox app:
In Toolbox, select your CLion version and click the screw nut button on the right.
From the menu that opens, select Settings:

Go to the Configuration section and set a new value in the Maximum heap size field:
Restart CLion.
To increase the memory heap, you can change the -Xmx option, which sets the maximum heap size for the JVM:
In the main menu, go to Help | Edit Custom VM Options. This action creates a copy of the .vmoptions file in the IDE configuration directory and opens it in the editor.
Update the
-Xmxvalue. For example, use-Xmx4096mto allocate 4 GB of memory instead of the default 2 GB.Restart CLion to apply the changes.
If the amount of free heap memory drops below 5% of the maximum heap size, a warning will appear. To adjust the -Xmx value, click Configure in the Memory Settings dialog.

Press CtrlShift0A to open the Find Action dialog.
Search for Registry:
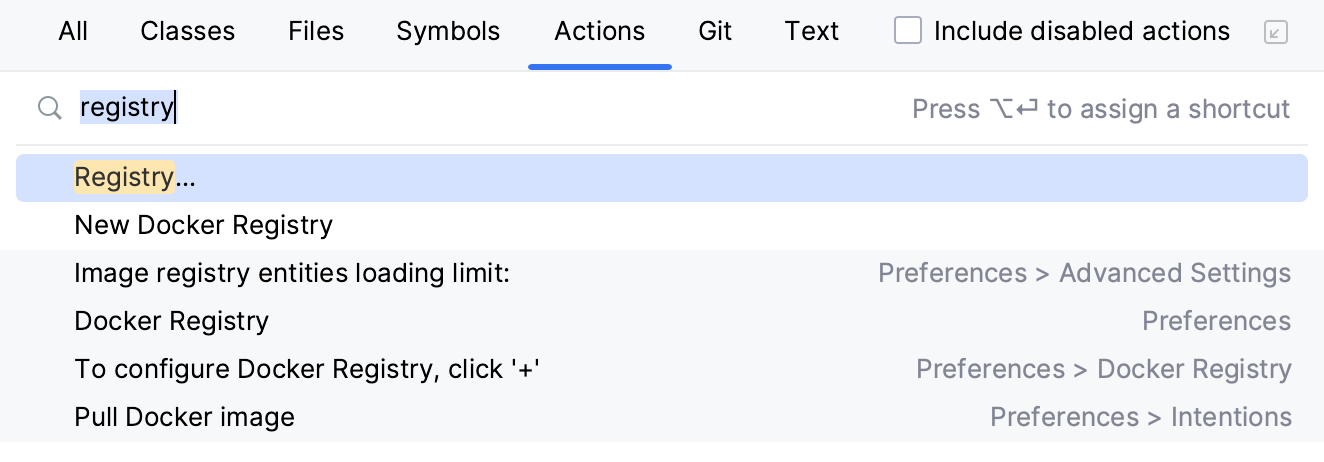
In the Registry dialog, start typing clion.clangd.max.memory.
Set the desired value and close the dialog.

tip
You can also change the limit of clangd indexer memory here.
On-the-fly code analysis is one of the most performance-consuming processes in CLion. Here's what you can do to lighten it up.
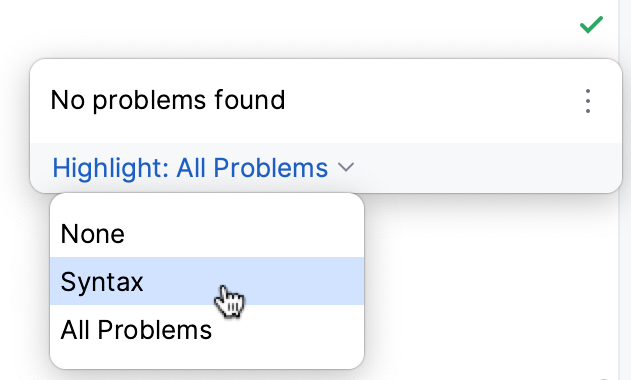
On-the-fly code analysis is one of the most performance-consuming processes in CLion. To lighten it up, you can configure the highlighting level for the currently opened file: none, syntax, or all problems.
Use the inspection widget in the upper-right corner of the editor:
You can enable Power Save Mode or battery efficiency mode using one of the following options:
As an alternative to disabling individual checks or files one by one, try using Power Save Mode. This mode disables all inspections and other resource-intensive background tasks across the entire IDE.
To enable Power Save Mode, go to File | Power Save Mode.

Right-click the status bar and select Power Save Mode. The
 Power Save Mode icon will appear on the status bar.
CLion incorporates a complementary Clangd-based language engine which is enabled by default. Currently, it works for error/warning annotation, certain navigation tasks, code formatting via ClangFormat, and code highlighting with quick-fixes.
In most cases, Clangd-based engine works faster than the built-in one (and sometimes provides more accurate results). However, it is not used for all operations. For example, Clangd provides the location for a quick-fix, while the fix itself is performed by the CLion’s own engine. Or, Find Usages employs Clangd to search through the files currently opened in the editor and the CLion’s own engine for all other usages.
We recommend you take Clangd engine specifics into account when investigating performance issues. Use Settings | Languages & Frameworks | C/C++ | Clangd to experiment with the engine settings and see if they affect the performance on certain tasks.
By default, CLion indexes all directories listed in CMakeLists.txt (including
sourcesandinclude_directoriespaths) to ensure proper code resolution.Your project may include folders with binaries, logs, or build artifacts that do not affect CLion code insight. Indexing such folders can also be resource-intensive due to their size or location. In these cases, it is reasonable to exclude the folders manually: right-click the directory in the project tree and select Mark Directory as | Excluded.

Once files are excluded, their symbols are no longer available to CLion. The following features will be disabled for excluded files: code completion, auto-import (unless the excluded directory is referenced by
include_directoriesin CMakeLists.txt) , code generation, Find in Files (except in open files), navigation, and refactoring.tip
If you are working in remote development mode, excluded directories will not be synchronized with the remote machine. See Remote with local sources: excluded paths.
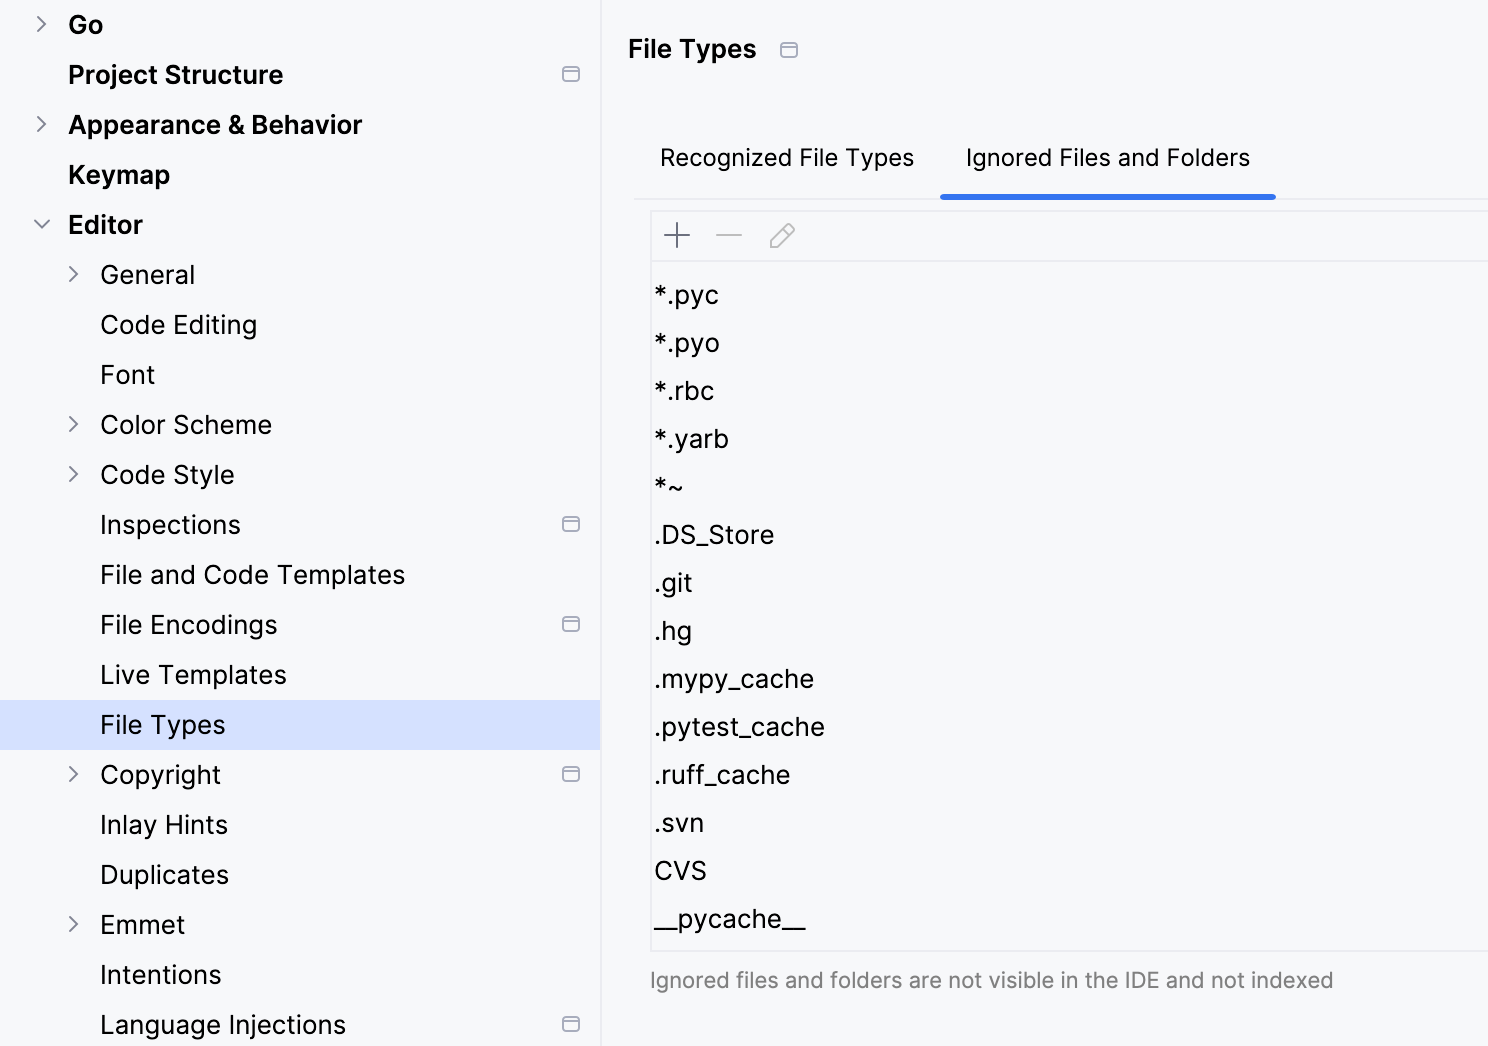
You can also exclude files such as logs or generated data by file type. To do so, go to Settings | Editor | File Types and add the pattern to the list of ignored file types:

tip
You can also exclude directories from test indexing without removing them from the standard IDE index. See Speed up tests indexing.
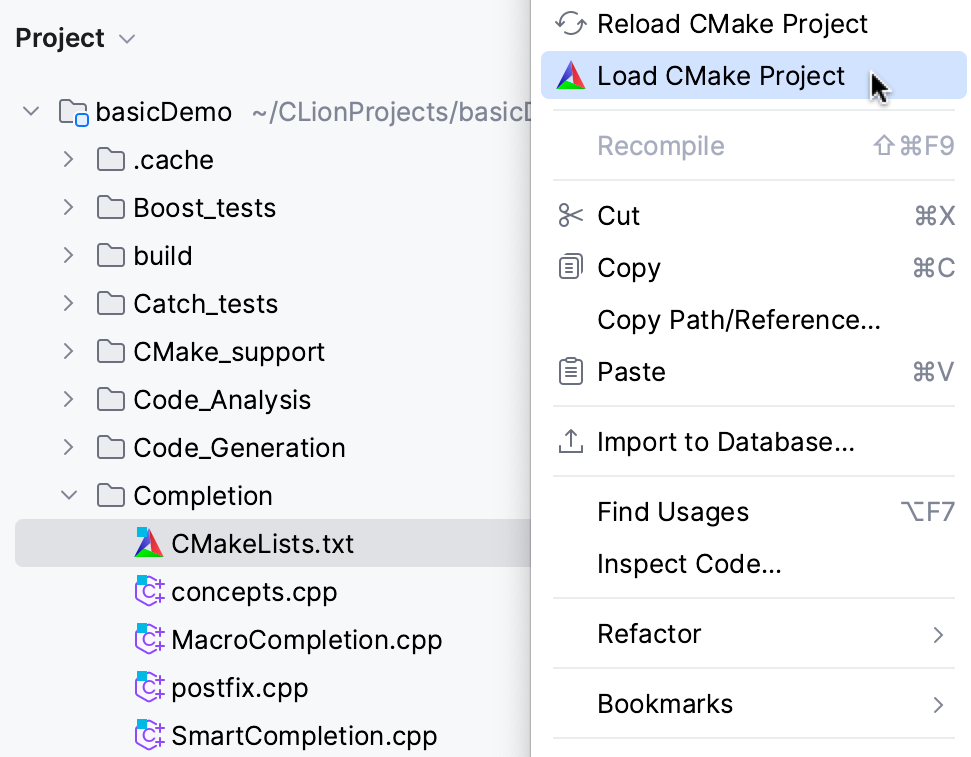
The scope of files being parsed is determined by the loaded CMake script. So if your project is split into several subdirectories with self-contained CMakeLists.txt in each of them, you can load smaller subprojects separately (for this, run Load CMake project on sub-CMakeLists.txt):
Another alternative for the case when you need to explore only a part of a big project is to create a compilation database, reduce it to the part of interest, and then open as a project in CLion.
IDE freezes may happen during the parsing of intricate preprocessor macros. To eliminate such problematic definitions from your code, replace them with some dummy ones using the __CLION_IDE__ (or __JETBRAINS_IDE__) macro:

This macro affects parsing only, and it is undefined when you build or run your code.
To increase the IDE performance, try disabling the plugins you don't need. You will always be able to turn them on again later.
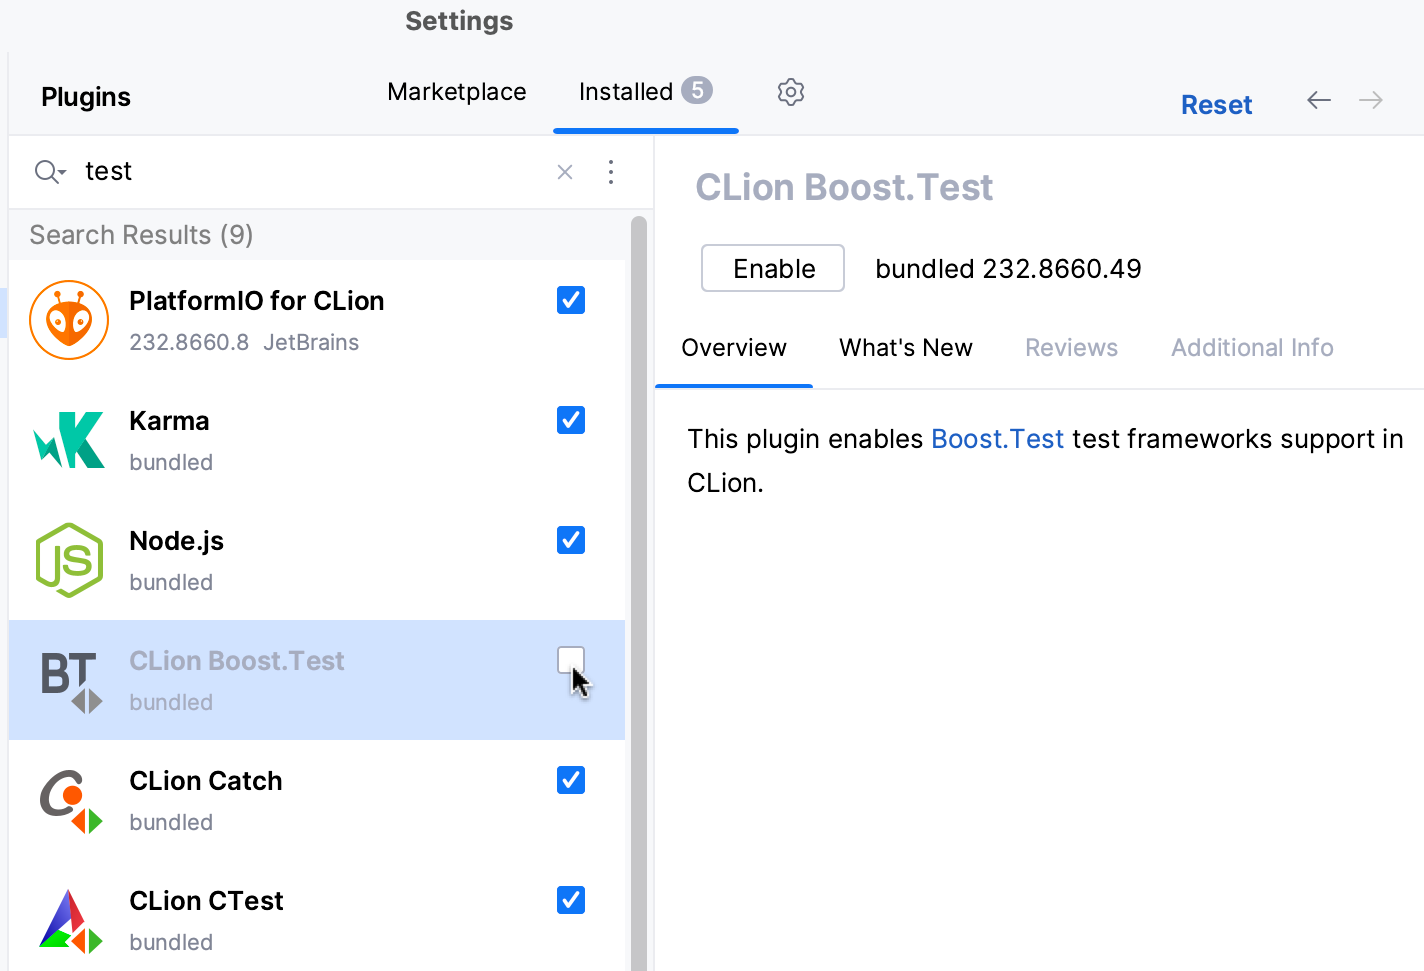
For example, if you are using a particular testing framework, consider disabling the plugins for other testing frameworks supported in CLion.
Go to Settings | Plugins.
Browse the Installed tab and disable the unnecessary plugins:
You can also disable all manually installed plugins at once (the non-bundled ones) from the menu under
:

If you experience an IDE freeze or high CPU or memory usage, and the tips listed above do not help, please provide us with the IDE logs, thread dumps, and performance snapshots. For details on how to collect and send this information, refer to this instruction.
Thanks for your feedback!