CMake profiling
With CMake profiling, you can identify which operations of the project reload are most time-consuming, and optimize your CMake scripts if necessary.
Profiling works for CMake version 3.18 and later. CMake stores the results in Google’s Trace Event format. CLion's integration helps you run the tracing and visualize the results.
note
Profiling is not available for presets-based CMake profiles.
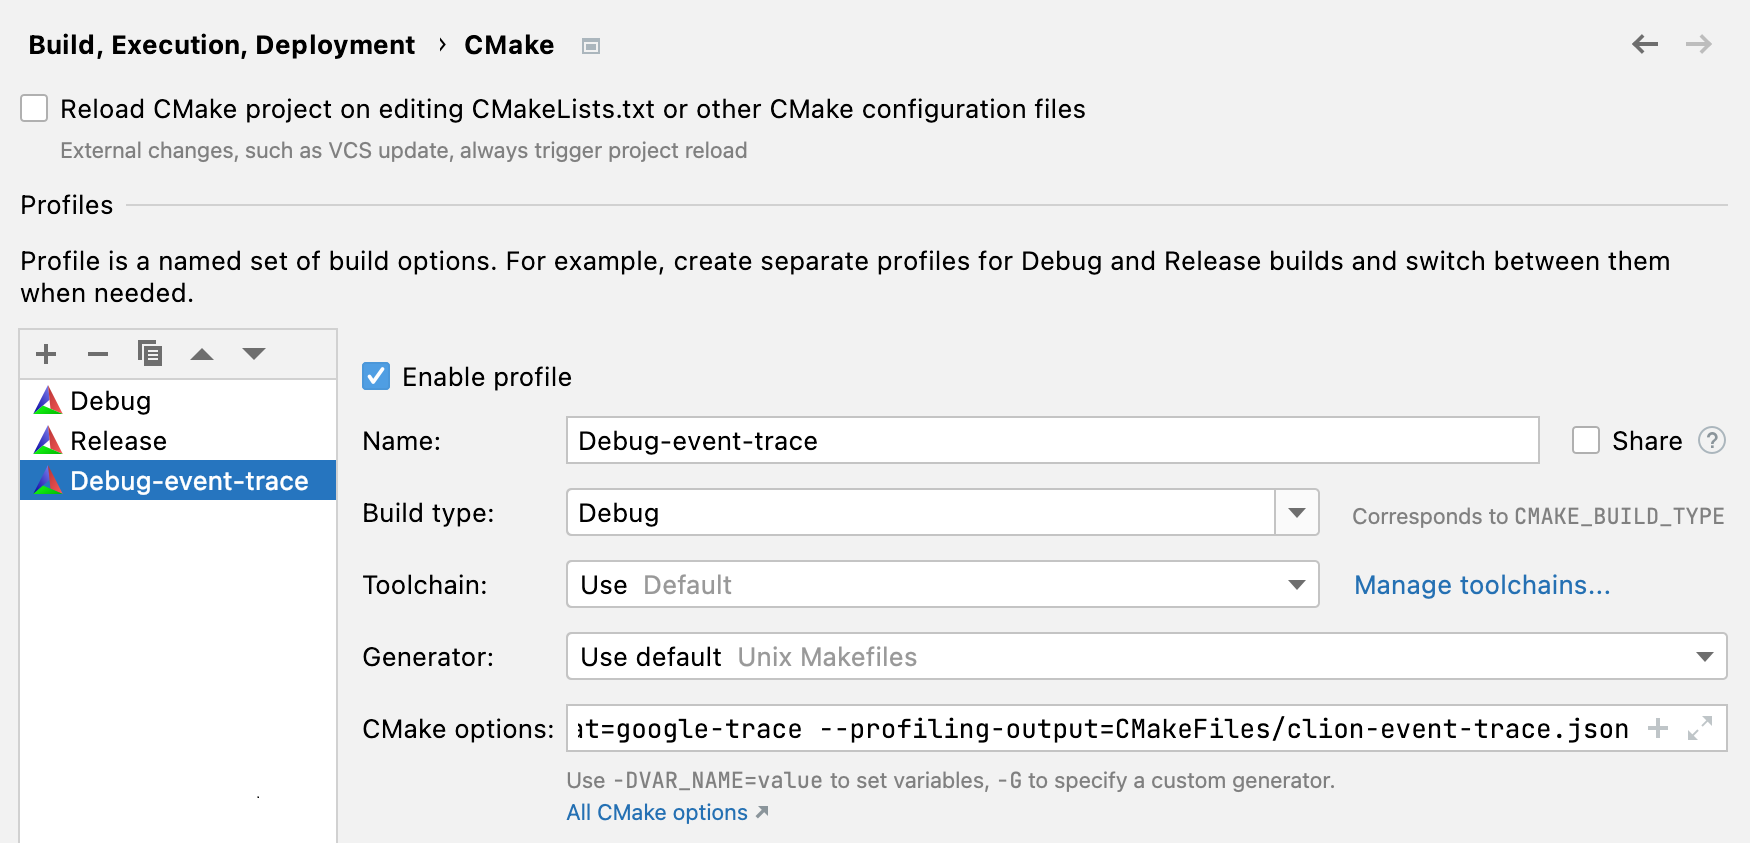
Two flags are required to enable tracing: --profiling-format=google-trace and --profiling-output=path. With these flags presented, CMake generates a JSON file with tracing results and puts it under the specified path.
In CLion, you can use one of these options to enable tracing:
Manually
Go to Settings | Build, Execution, Deployment | CMake and select the profile you want to trace. Add the flags to CMake options.
Automatically
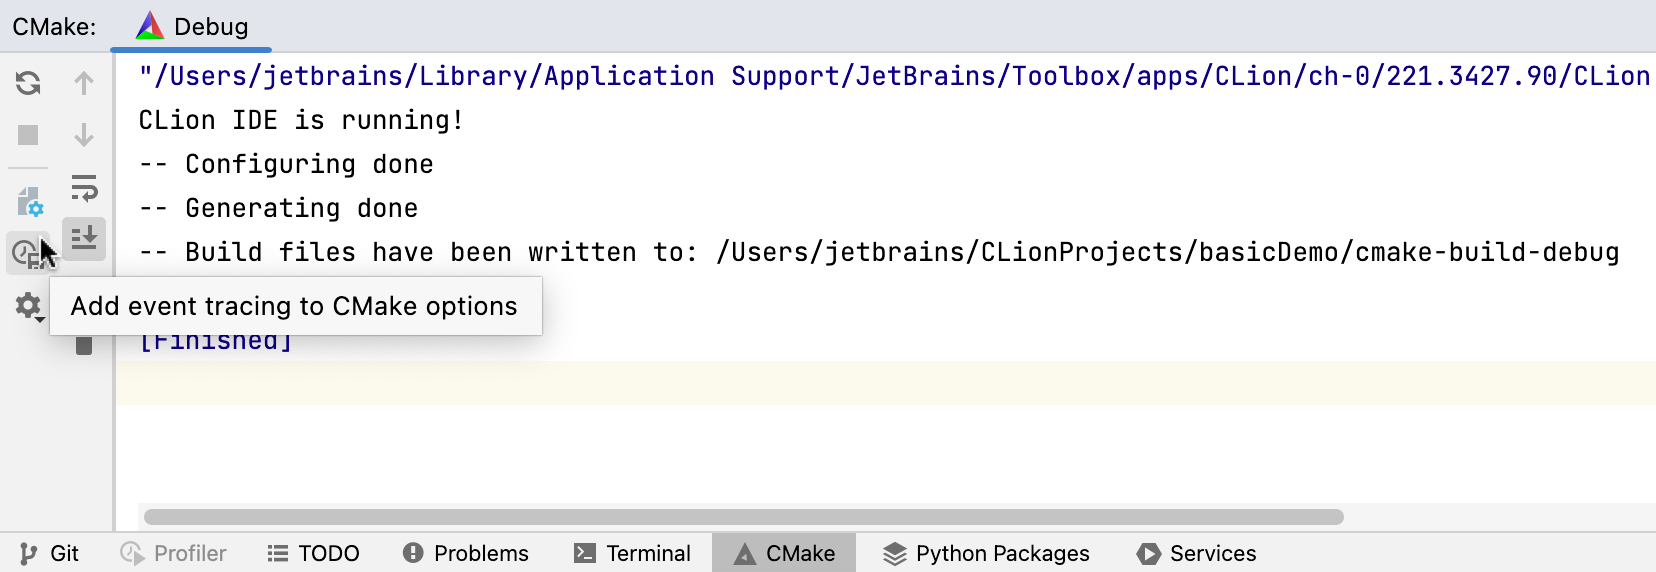
After loading the profile you want to trace, click Add event tracing to CMake in the CMake tool window:
CLion will create a copy of the profile and add the required options. The new profile will have the same name with the -event-trace suffix:
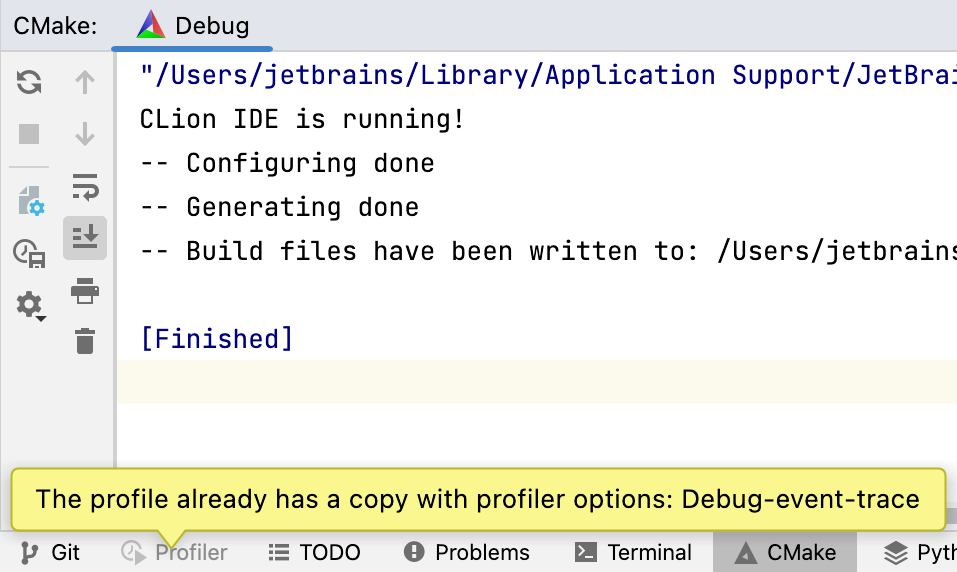
If there is a tracing profile already, the IDE will detect it and show a notification:
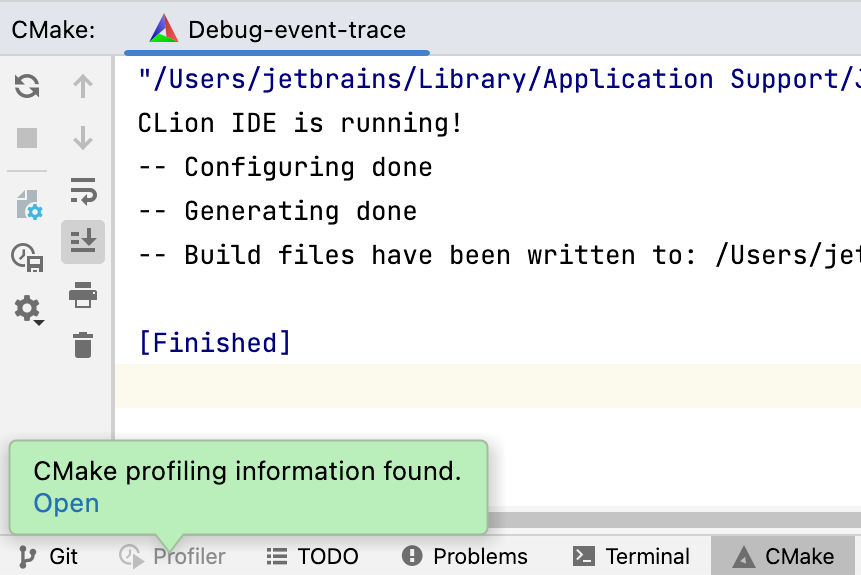
Once the profiling flags are added, CLion will collect the tracing info on every project reload. Click the link in notification to open the results:
tip
If you already have a .json file with tracing results, you can open it in CLion via Run | Open Profiler Snapshot.
CLion presents the results in the Profiler tool window:
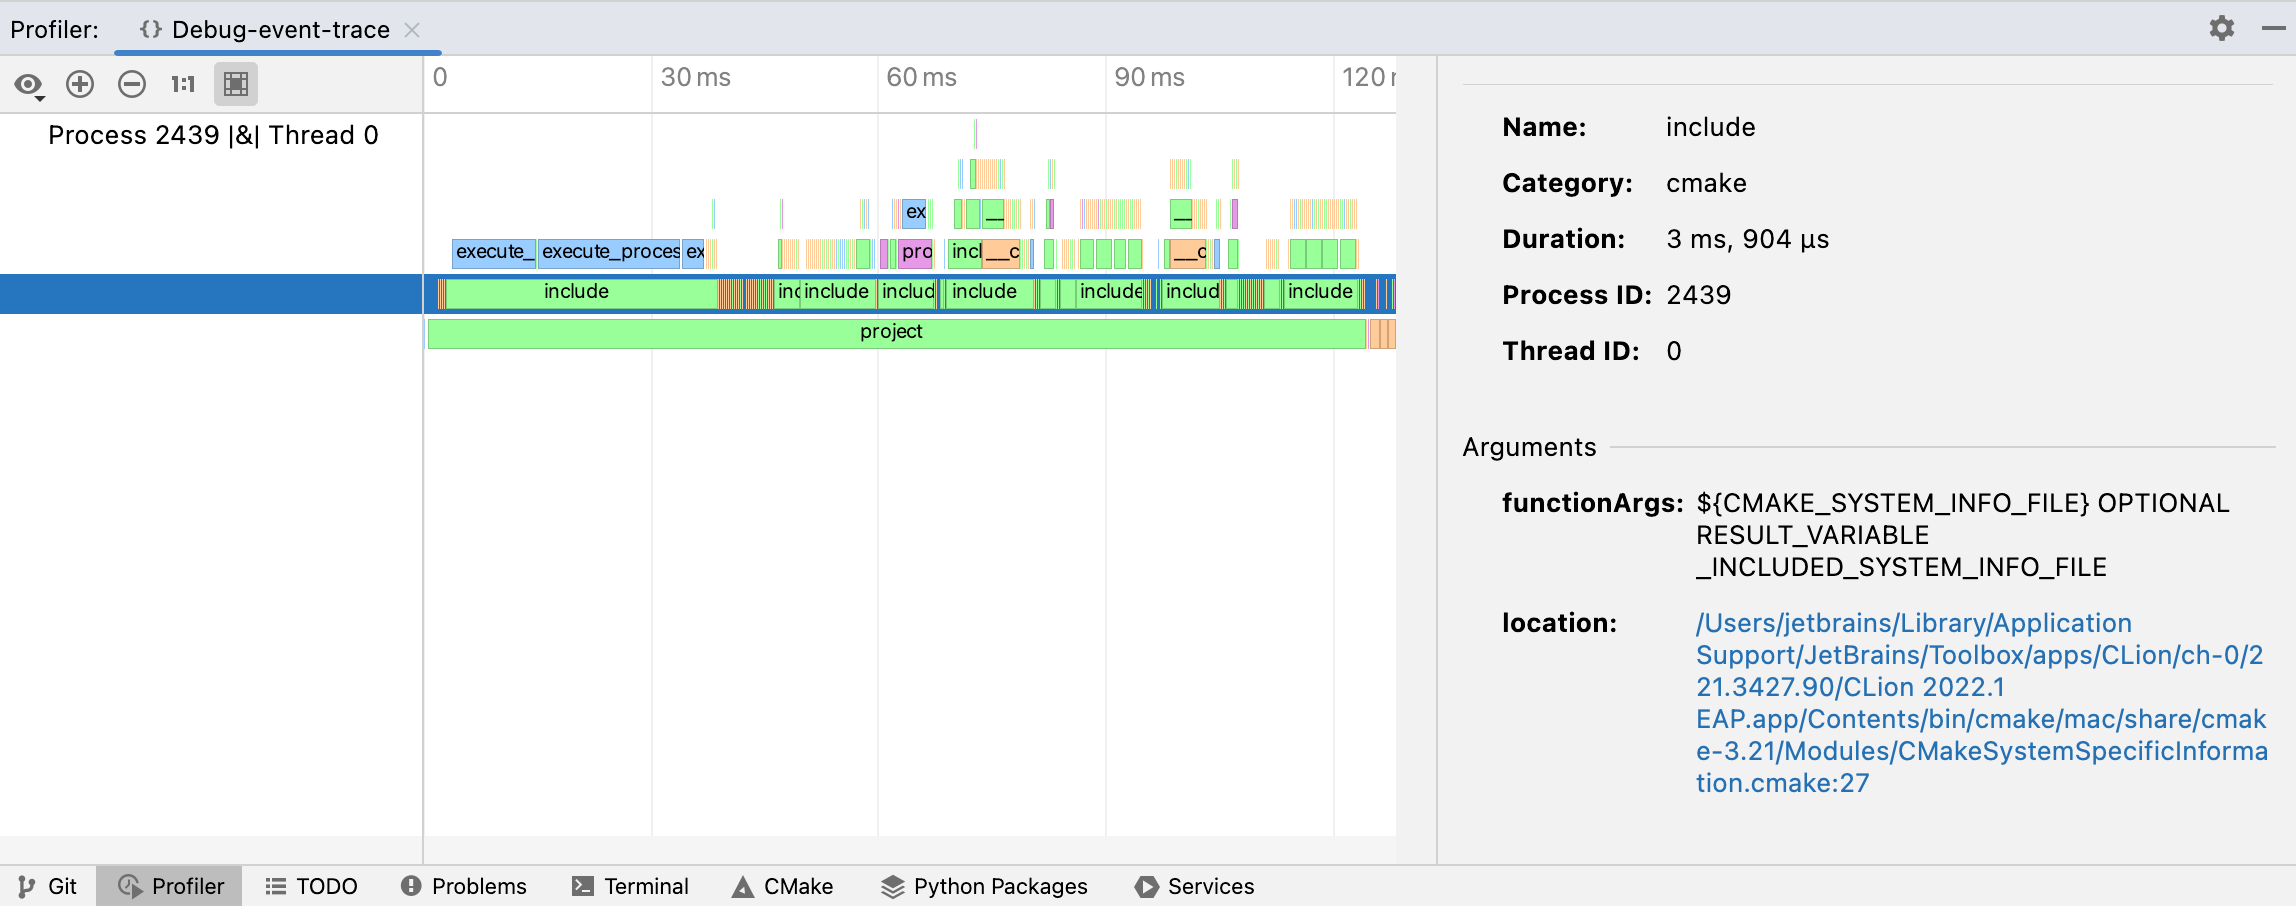
In the left-hand pane, you can find the process and thread IDs for the CMake reload process.
In the central pane, you can examine the process's flame chart. It shows the collection of stack traces: the rectangles stand for frames of the call stack, ordered by width.
tip
To zoom in and out within the flame chart, press Ctrl while turning your mouse wheel or use the
and
buttons.
In the right-hand pane, you can explore the details of the event you select in the flame chart. This includes function name, duration, function arguments, and the location of the function in your CMake scripts.
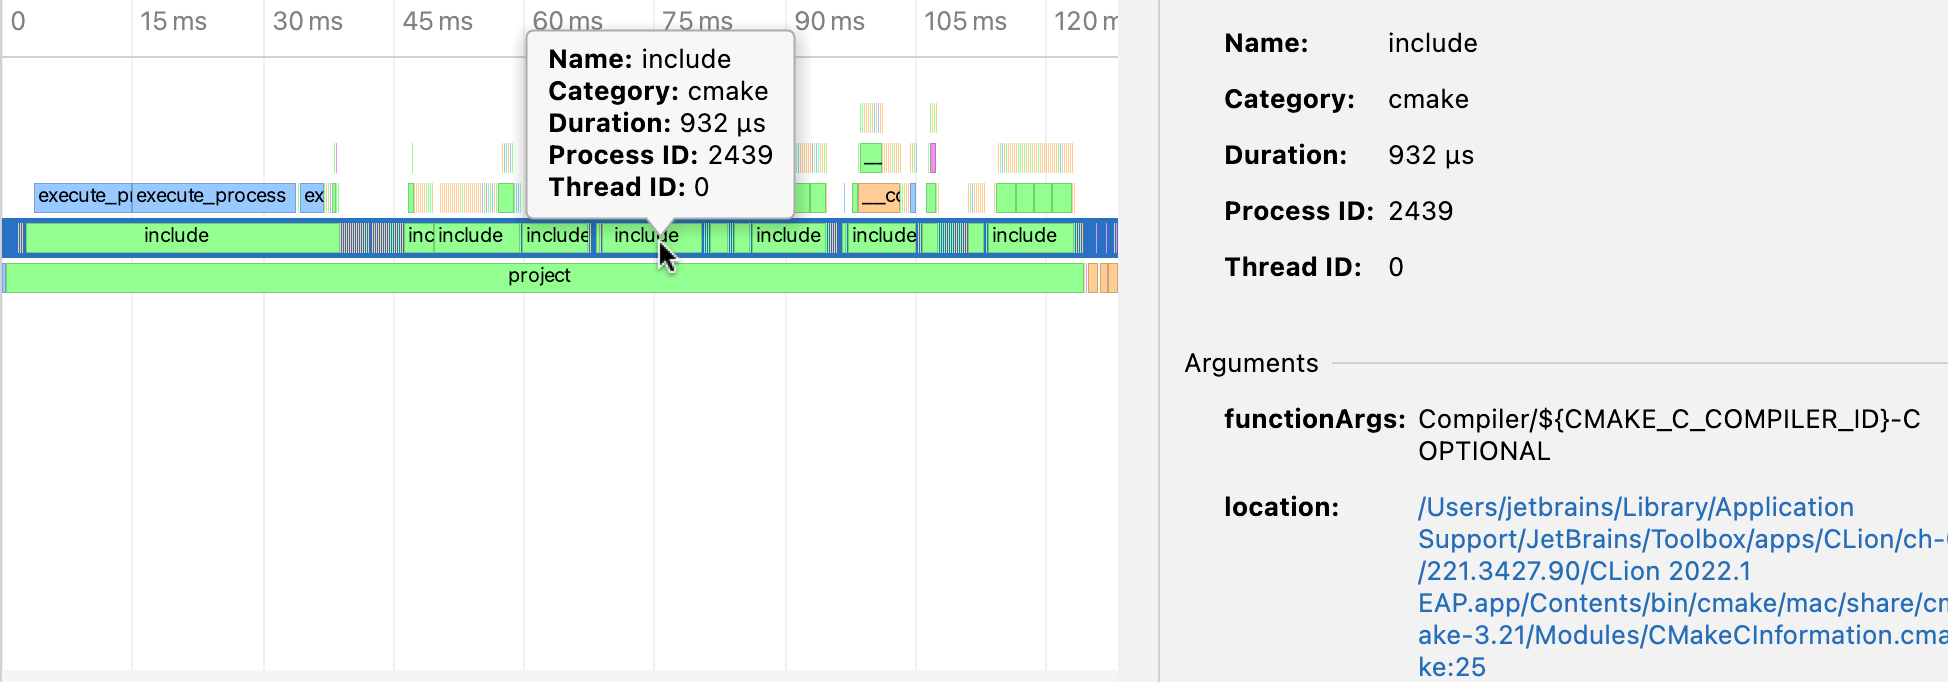
You can also hover the mouse pointer over a block to display a tooltip with the event details:
tip
Click the location link to jump to the corresponding line.
Thanks for your feedback!