Code coverage
In CLion, you can run CMake applications and tests with code coverage measurements. Code coverage results provide the percentage of code lines executed during a run and the number of times a particular line was hit.
CLion relies on llvm-cov/gcov integration to collect and show code coverage data. These tools require special coverage compiler flags, which you can pass manually or let CLion add them automatically.
The Run with Coverage action is available for CMake Application and test configurations (Boost.Test, Google Test, or Catch).
You can call Run with Coverage from the toolbar next to the configuration switcher or from the gutter menu:


When you call Run with Coverage, but no coverage files (.gcov or .profraw) are found, CLion suggests adding the coverage flags:

If you click Fix and rerun, CLion will do the following:
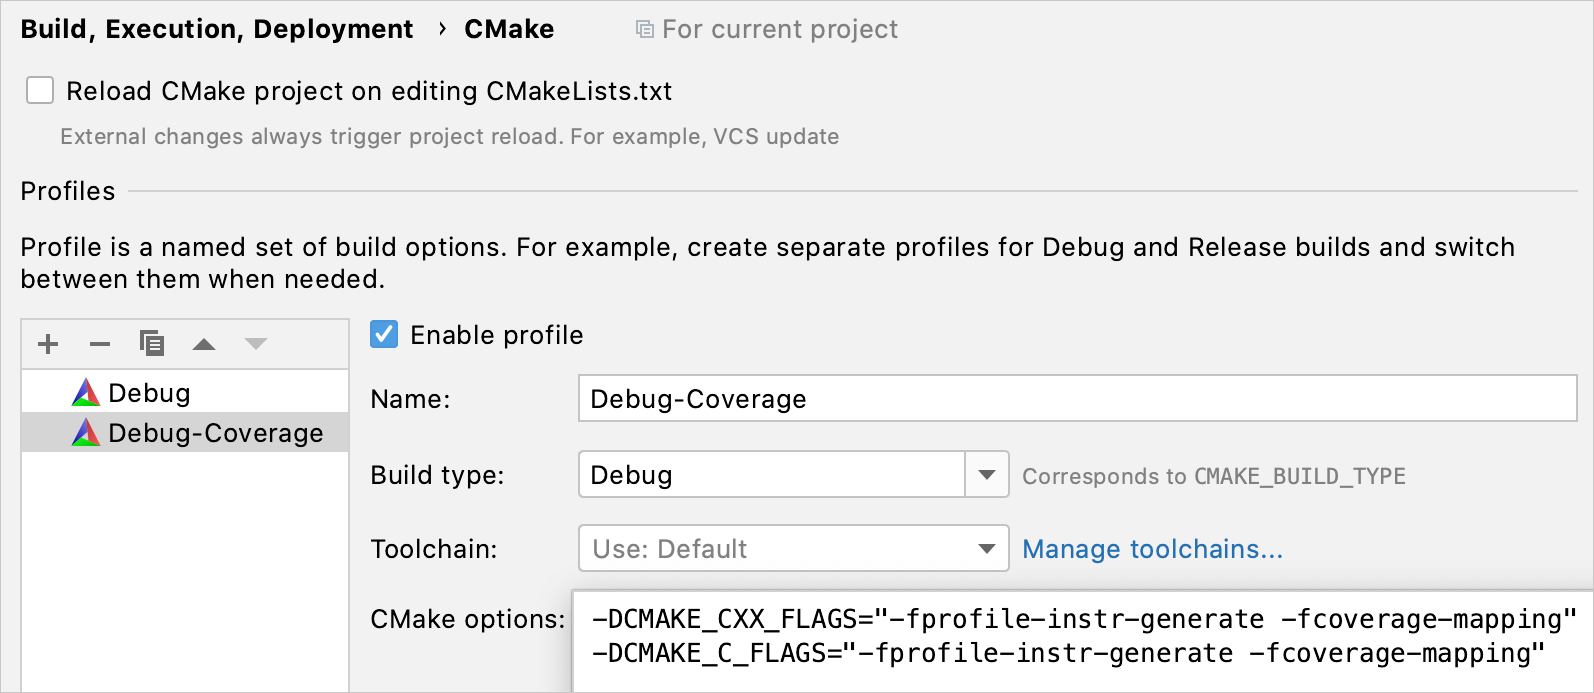
Search for an existing CMake profile, which has the same build type, toolchain, and CMake options as in the currently used profile, but with added compiler options for coverage (see Coverage compiler flags). If one is found, CLion will switch to it and use it to run your configuration with coverage.
If no such profile is found, CLion will create a new one, copying the Build type, Toolchain, and CMake Options parameters from the current profile and passing the coverage flags as
CMAKE_CXX_FLAGSandCMAKE_C_FLAGSin CMake options. Then CLion will switch to this newly created profile and use it to run you configuration with coverage.
If you pass coverage flags manually, you can use one of the following options depending on the compiler and coverage tooling you prefer:
GCC
-fprofile-arcs -ftest-coverageor--coverageIn this case, the gcov tool will be used.
Clang / Clang-cl
Two options here:
Use the same flags as for GCC to get the gcov-style coverage collected with llvm-cov gcov.
Use
-fprofile-instr-generate -fcoverage-mappingto invoke the Clang’s instrumentation-based profiling which uses a pair of thellvm-profdata mergeandllvm-cov exportcommands.
note
For Clang-cl, code coverage is available only for the x86 architecture. Make sure to select it in the Architecture field of your Visual Studio toolchain.
You can provide the flags by setting the CMAKE_CXX_FLAGS variable (CMAKE_C_FLAGS for C projects) or using other alternatives like the add_compile_options command.
tip
If you get linker errors while building your project with gcov compiler flags, try passing the same flags to the linker through
add_link_optionsorset(CMAKE_EXE_LINKER_FLAGS "").
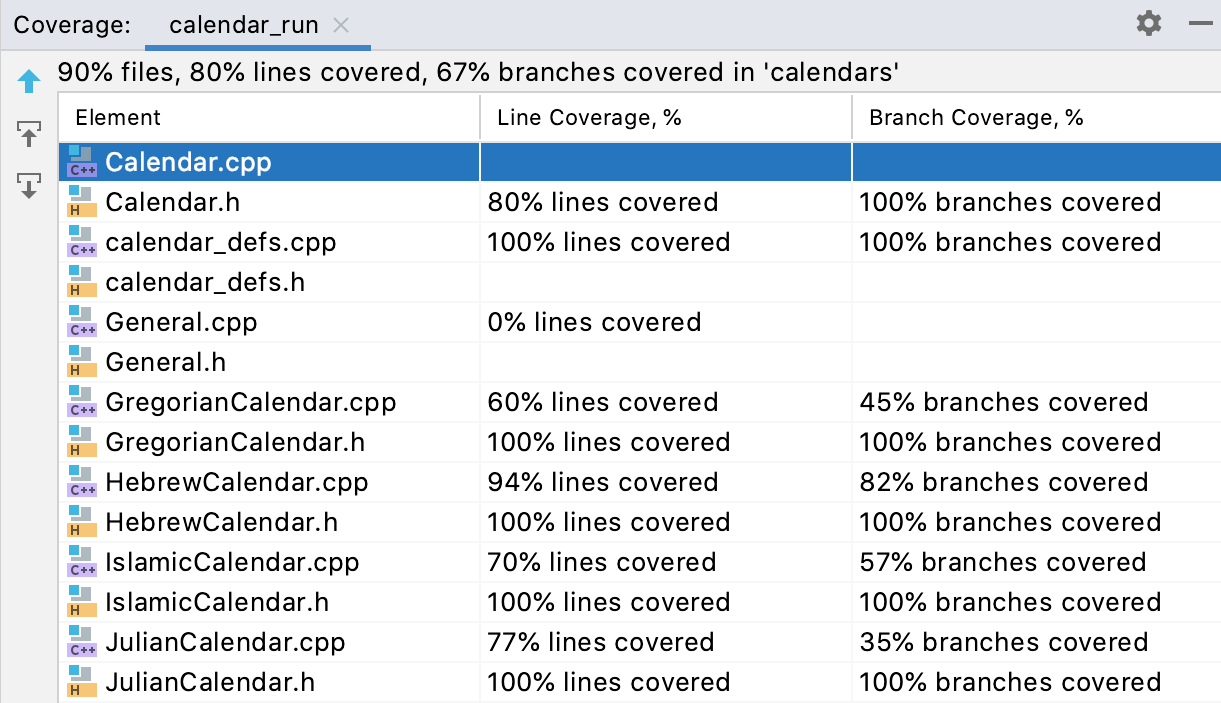
When coverage data is ready, the Coverage tool window opens up automatically. Initially, it shows the percentage of files per folder covered during the launch. If you double-click a folder, you will see the Line Coverage and Branch Coverage columns.

Line Coverage shows how many lines per file were covered. Note the following difference in how it works depending on the compiler and the flags you are using:
GCC/gcov (the
--coverageflag) gives exact line coverage. When there are several code blocks in one line, that line is considered fully covered (marked green in the editor) if at least some of the statements were executed.Clang/llvm-cov, when the program is compiled with
-fprofile-instr-generate-fcoverage-mapping, provides statement coverage. If not all the statements in a line were executed, the line is marked as partially covered (yellow).Branch Coverage takes into account all the branches of each control structure.
It is supported for LLVM version 12.0.0 or later and for any version of GCC. On macOS, the version of AppleClang matches to an earlier LLVM version (see this table). AppleClang 12.0.x corresponds to LLVM 10.0.x, which doesn't support branch coverage. To workaround this, you can switch to GCC or change the coverage compiler flags to
--coverage:
GCC and the gcov tool consider the compiler-generated branches when calculating branch coverage. This might affect the results if, for example, you use exception handling.
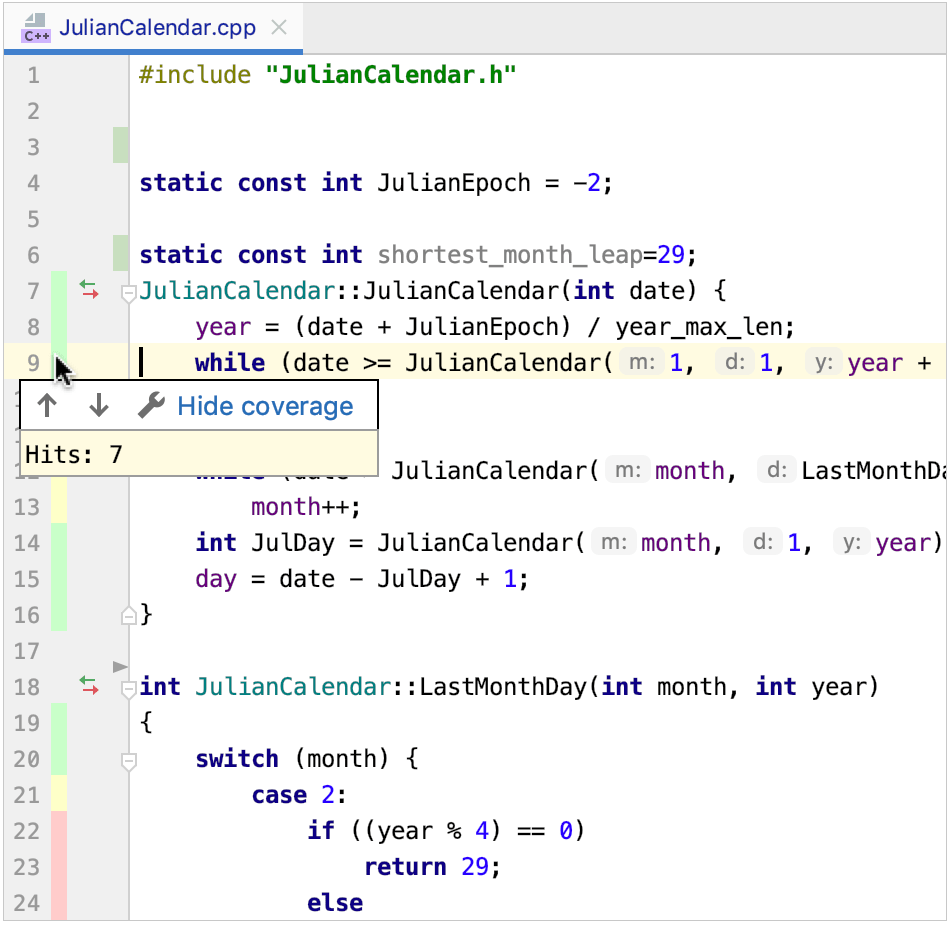
In any file, you can check the gutter indicator and click it next to a particular line to learn how many times it was hit:

A line executed fully is marked green. Yellow marker means that it was only partically executed.
To modify the colors of coverage highlighting, click or go to Settings | Editor | Color Scheme | General and expand the Line Coverage node.
CLion also shows coverage statistics in the Project view:

When you rerun coverage analysis, CLion prompts you to choose how you prefer the new results to be presented:

Add to active suites – new results will be added to the previously collected statistics.
Replace active suites – the already collected data will be overwritten.
Do not apply collected coverage data – new results will be ignored.
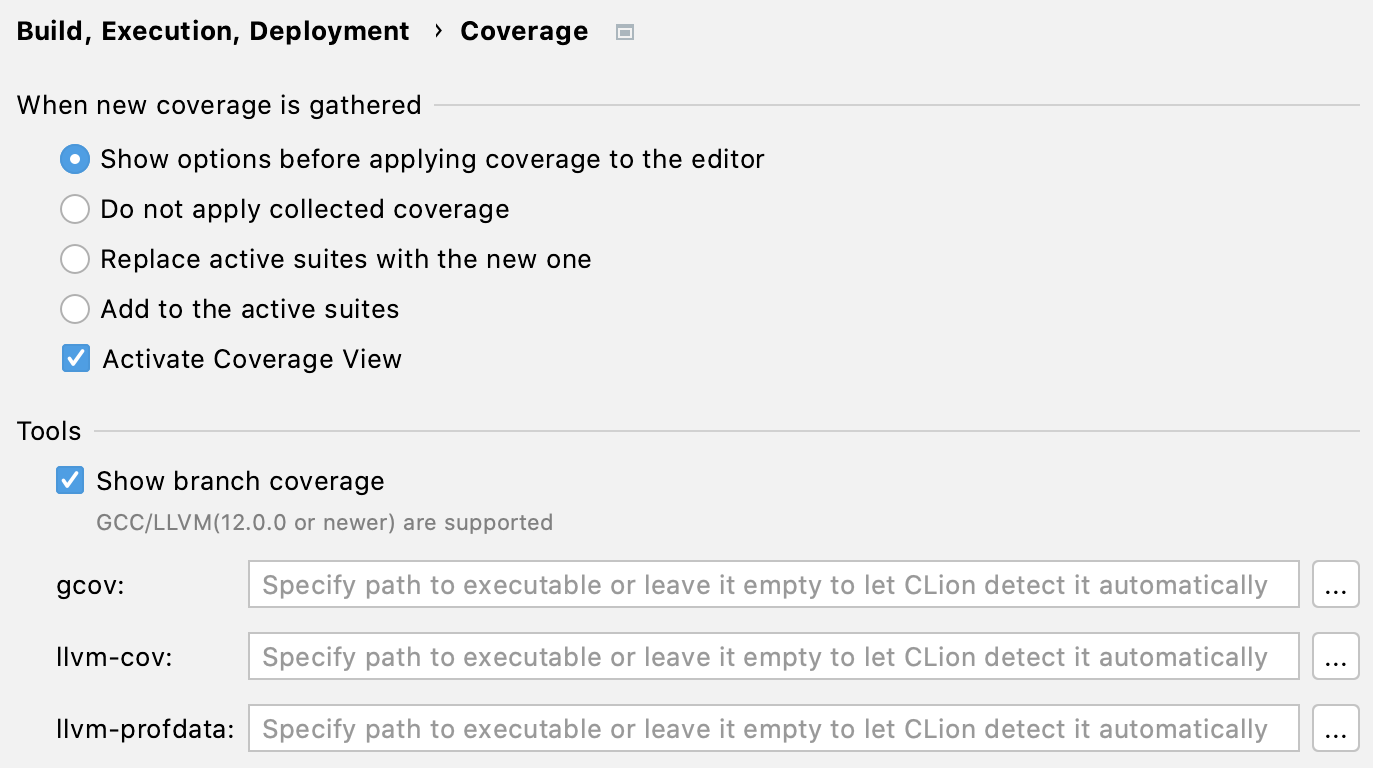
Code coverage settings are gathered in the Settings | Build, Execution, Deployment | Coverage:

In the Tools section, you can provide custom paths to gcov / llvm-cov / llvm-profdata. By default, CLion takes the paths from the PATH environment varible.
If you get empty coverage reports, check whether your compiler version matches the version of gcov / llvm-cov tool (default or custom) that you are using.

Keep this in mind when changing compilers or switching from one Windows toolchain to another.
Thanks for your feedback!