Rust
warning
This page is no longer maintained. Find full documentation for IntelliJ Rust on the plugin's Marketplace page.
tip
The Rust plugin is an open-source GitHub project. Your feedback, feature requests, and bug reports are all welcome in the project's tracker.
Go to and select the project root directory containing Cargo.toml.
Check the Cargo tool window () to make sure the project was imported successfully.

Start a new project () and choose Rust as your project type.
In the New Project dialog, provide the paths to the toolchain and the standard library (which you can download via rustup right from the wizard):

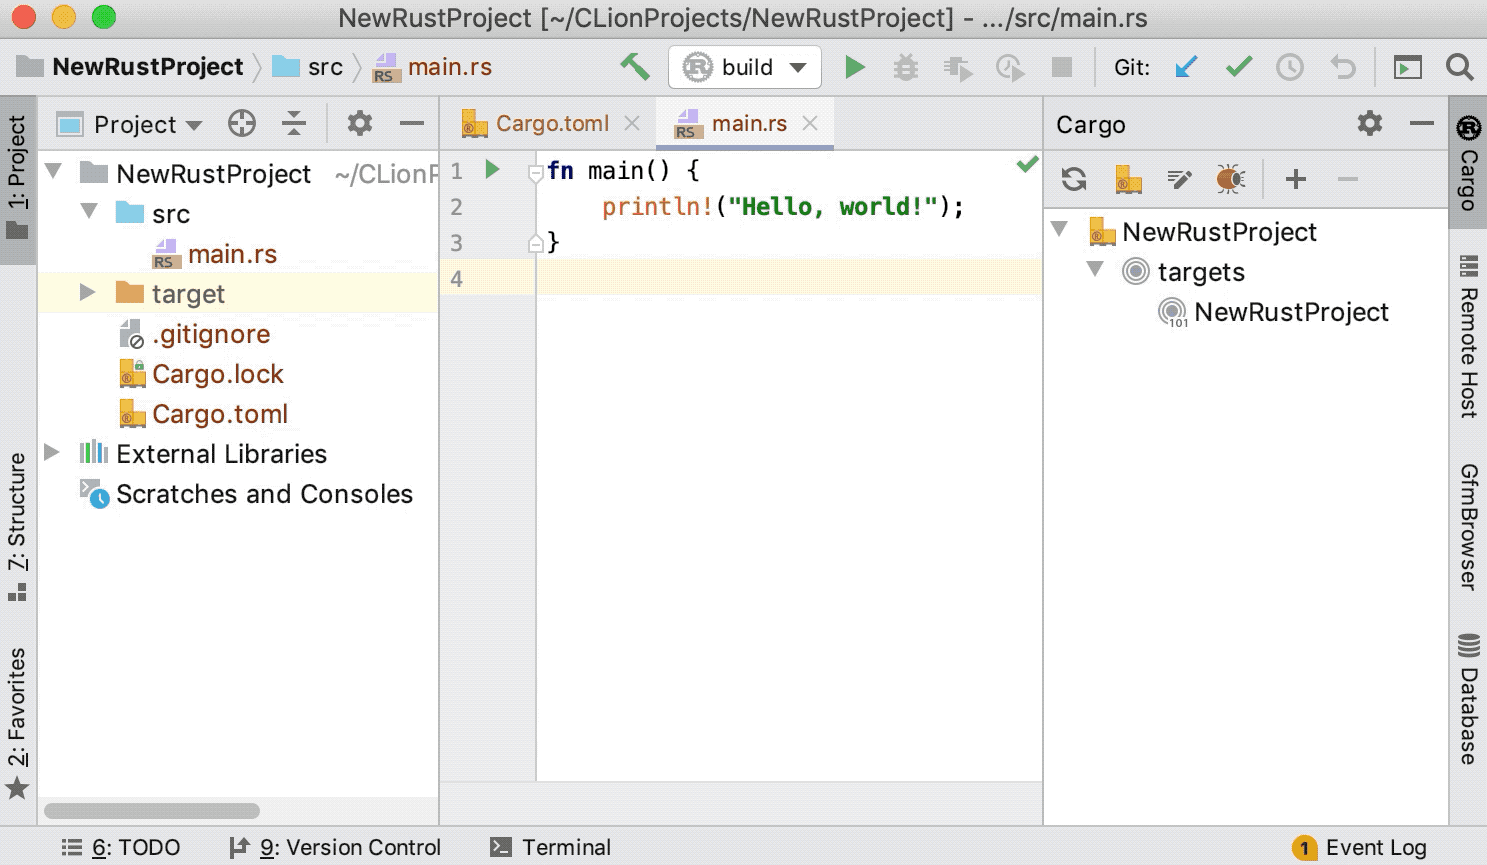
Click Create, and CLion will generate a new project with the following structure:

In the Rust dialog, adjust the general project settings.

Use the Expand declarative macros switcher if you want to disable the default new macro expansion engine (in case it fails for your code at some point). You can switch to the old engine or turn macro expansion off completely.
In the Cargo dialog, you can configure the external linter if you plan to use one. Choose between Cargo Check and Clippy:

You can enable the external linter to work on the fly, but this might affect performance especially on big projects. To run the linter on demand, use the Run External Linter action.
Macro expansion engine for declarative macros.
The default engine provides code insight for generated items such as structs, enums, functions, and traits. On top of that, it performs highlighting, name resolution, and completion for generated modules and methods from
implblocks, and enables navigation in macro calls. Gif
Giftip
For more information about how IntelliJ Rust works with declarative macros, refer to this blog post.
On-the-fly code analysis with a list of Rust-specific inspections.
You can explore the inspections and edit their severities and scopes in :

For most of the inspections, quick-fixes are available via AltEnter. For example, you can implement missing members via a quick-fix, and the plugin will correctly substitute a generic type parameter and lifetimes:
 Gif
GifVarious Rust-specific code generation options and intention actions, for example:

Full list of intentions is available in .
A set of live templates for Rust. You can customize the built-in templates and create your own in .
 Gif
GifQuick Documentation popup Ctrl0Q, including documentation for library functions:

The Cargo tool window () shows all workspace members and targets. From this tool window, you can quickly run a target by clicking on it, refresh your project ![]() , reformat it with rustfmt, and run the external linter configured in .
, reformat it with rustfmt, and run the external linter configured in .
To run a Cargo command, click ![]() or press Ctrl twice to invoke the Run Anything popup:
or press Ctrl twice to invoke the Run Anything popup:

Go to , click
 , and select Cargo Command.
Specify the settings for your Cargo Command configuration:

Use the following pattern for the Command field:
[run]or[test][build options] [--] [program arguments].Notice the
--prefix followed by an extra space. It separates the input arguments from the build options that will be passed to Cargo. For example, when you debug this configuration, the plugin will start by callingcargo build [build options]and then it will launch the binary under the debugger with[program arguments].The Emulate terminal in output console option can be useful for crates like color-backtrace, which behave differently when a process is run under TTY (refer to the feature description). This option is not available on Windows.
Backtrace lets you set the
RUST_BACKTRACEenvironment variable, which prints the unwound stack trace into error messages and controls its length. For more information, refer to Debugging Rust code in CLion: More debug features.
After saving the configuration, you can use it to run or debug your Rust application.
The test runner window shows a progress bar for the running tests and groups all tests into a tree view according to their status and duration. From this window, you can rerun ![]() the tests or toggle automatic rerun on changes in your code, sort the tests alphabetically
the tests or toggle automatic rerun on changes in your code, sort the tests alphabetically ![]() or by duration
or by duration ![]() , and open previous results
, and open previous results ![]() :
:

tip
For more information about debugging Rust code in CLion, refer to the dedicated blog post.

After the configuration is set up, you can Debug![]() it with all the CLion debug features (breakpoints, variable monitor, stepping, and others) available for your Rust application:
it with all the CLion debug features (breakpoints, variable monitor, stepping, and others) available for your Rust application:

CLion's dynamic analysis tools are also available for your Cargo configuration: click ![]() to profile your application or
to profile your application or ![]() to run it with Valgrind memcheck.
to run it with Valgrind memcheck.
Prepare a debug binary (take a look at these instructions on cross-compilation).
Create a GDB Remote debug configuration and fill in the settings:

As a symbol file, try using the binary itself. By default, it is placed into the ~
/target folder./debug/ Launch your program remotely under gdbserver, place breakpoints in the code, and start a debug session. You will be able to use all the CLion debug features as if the program was running locally:
 Gif
Gif
Thanks for your feedback!