Peripheral view
During a debug session, you can monitor registers and peripherals defined in .svd files. Peripheral view is available for two configuration types: Embedded GDB Server and OpenOCD Download & Run.
Configure Peripheral View
Set up an Embedded GDB Server or OpenOCD Download & Run configuration and start a debug
session.
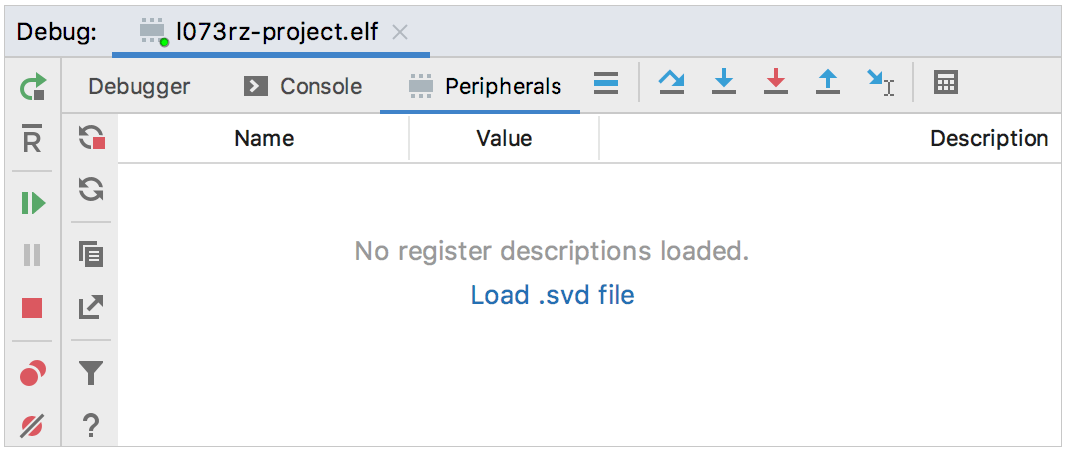
In the Debug tool window, open the Peripherals tab:

Click Load .svd file. You can load several .svd files at once and select the active peripherals you need from each of them on the next step.
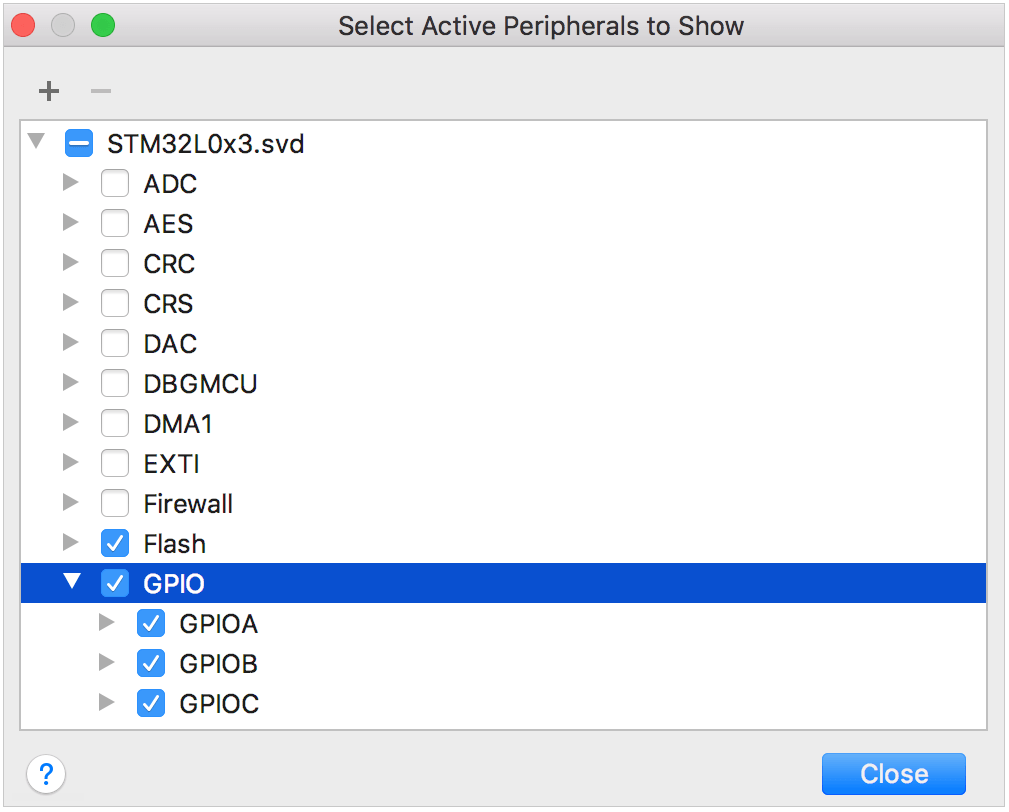
Select the active peripherals or particular registers to be shown:

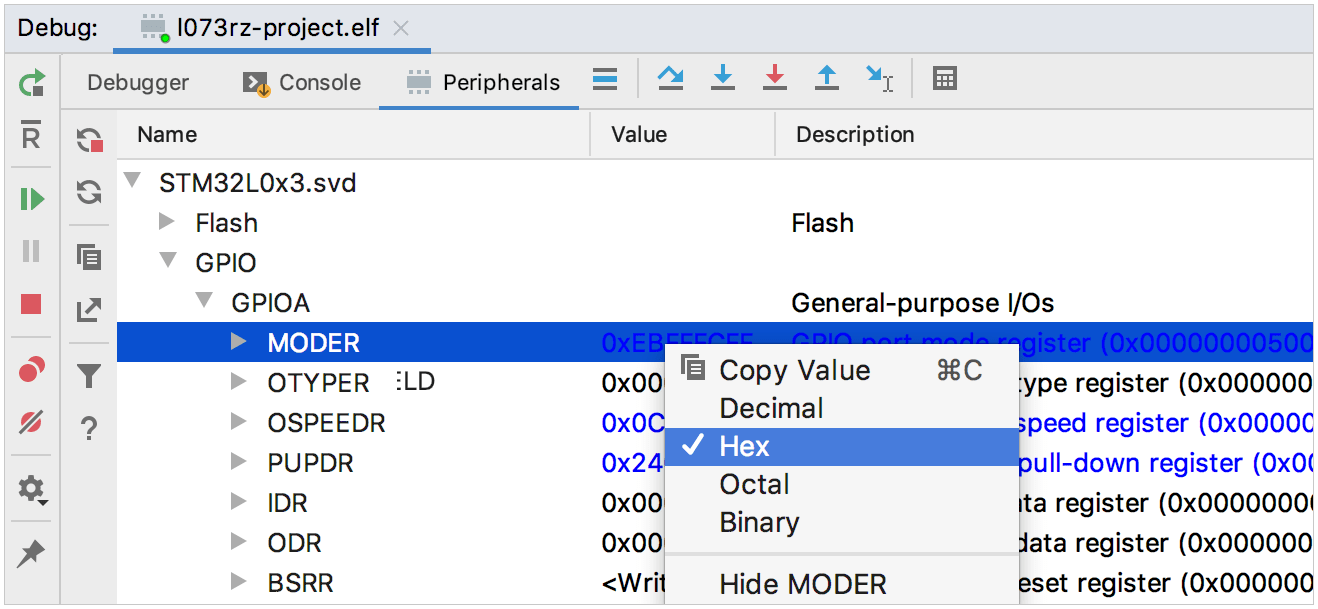
The selected registers are displayed in the tab (currently, the values are read-only). You can switch between Decimal, Octal, Hex, and Binary views using the context menu:

The Stop refreshing button stops the on-the-fly updates of the peripherals on stepping. It can be useful when the operation is time-consuming. Click Refresh to trigger the update manually.
The Configure button opens the Select Active Peripherals dialog.
Save the Peripheral view data
Export as CSV to Clipboard and Open as CSV in Editor buttons of the Peripherals tab can be useful if you want to compare peripherals from several runs or save it for future investigation.
Peripheral view data is stored in .csv files in the Scratches directory. To access scratch files, open in the project tree and expand the Scratches node.
To compare two files, select them in the project tree and call Compare files from the context menu, or press Ctrl+D.
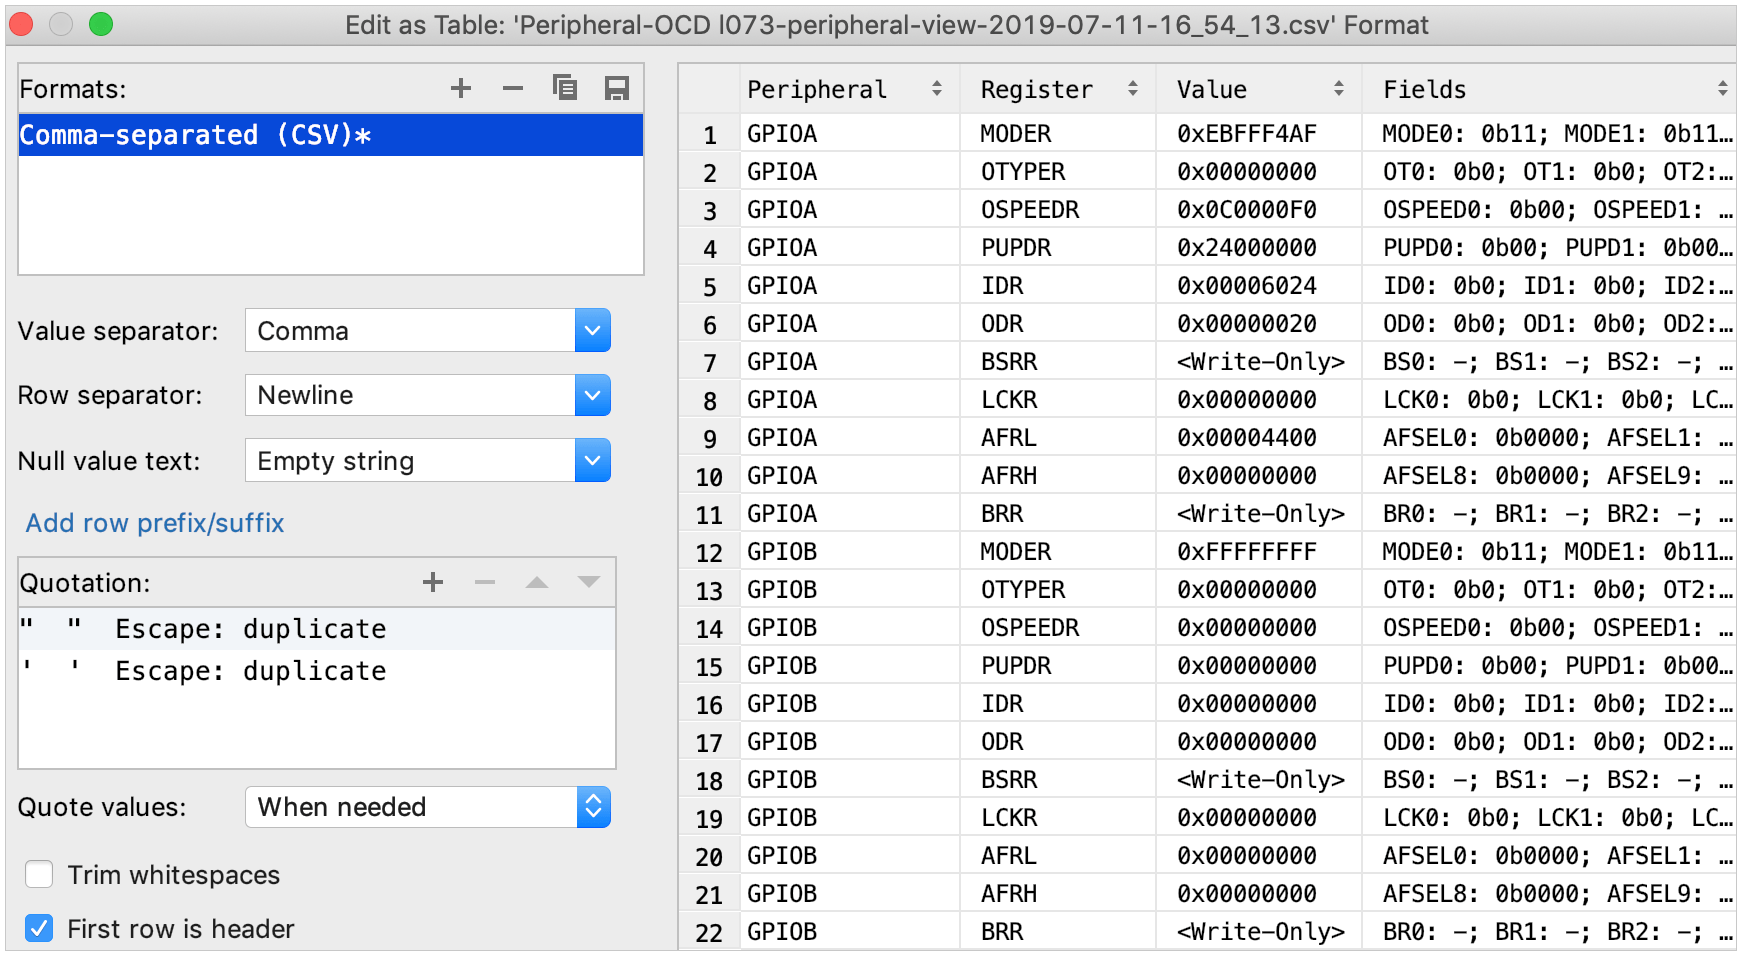
You can also edit .csv files as tables: right-click inside a file and choose Edit as table. For readability, select the First row is header checkbox:
