Start/pause/stop debug session
Before debugging
Set breakpoints in the source code.
If necessary, create or modify the corresponding Run/Debug configuration.
The debug session starts with the selected run/debug configuration. Note that several debug processes can be launched simultaneously.
Start a debug session
Select the run/debug configuration to execute, and then do one of the following:
Click
icon in the left gutter, and then choose
.
Click
on the toolbar.
Select from the main menu.
Press Shift+F9.
Invoke the Run Anything dialog by pressing Ctrl (or search for Run anything in Ctrl+Shift+A).
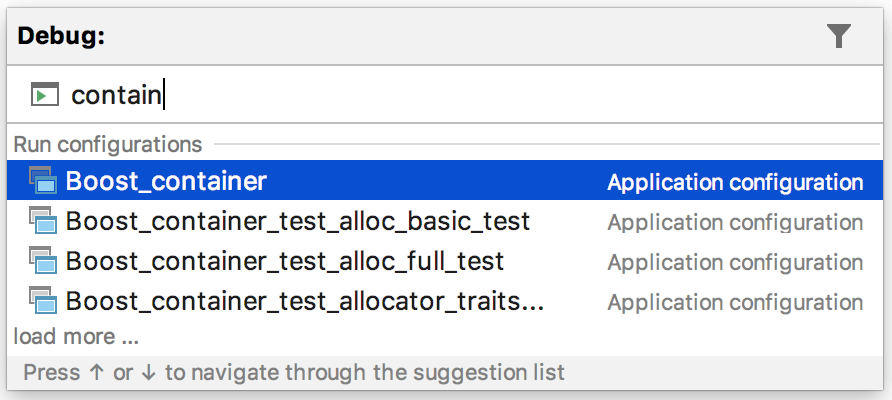
In the Run Anything dialog, start typing the configuration name, select it from the list, then hold down Shift to switch to Debug mode, and press Enter to debug the selected configuration:

Note that after you've launched a debug session, the Debug tool window icon () toggles to
![]() indicating that the debugging process is active.
indicating that the debugging process is active.
Pause a debug session
In the main menu, go to .
Click
on the Debug toolbar.
Resume a debug session
In the main menu, go to .
Click
on the Debug toolbar.
Press F9.
Terminate a debug session
Click the Stop button on the toolbar of the Debug tool window. Alternatively, press Ctrl+F2 and select the process to terminate (if there are two or more of them).