Step through
CLion provides a set of stepping actions for various debugging strategies (for example, whether you need to go directly to the next line or enter the functions called on your way there).
Stepping actions are located on the Debugger window toolbar and in the menu:

Step over
Steps over the current line and takes you to the next line even if the current line includes function calls. The calls are skipped, and you move straight to the next line of the caller.
Click the Step Over button
or press F8.
If there are breakpoints inside the skipped methods, the debugger will stop at them. To skip any breakpoints on the way, use Force step over.
Step into
Steps inside the code of a called function.
Click the Step Into button
or press F7.
Some methods are skipped by Step into as you normally might not need to debug them. This list can be fine-tuned on the page of the Settings dialog (Ctrl+Alt+S) .
Smart step into
Smart step into is helpful when there are several method calls on a line, and you want to be specific about which method to enter. This feature allows you to select the method call you are interested in.
Select Smart Step Into from the
menu or press Shift+F7.
Click the method. Alternatively, select the method using the arrow keys or the tab key, and then confirm the selection by pressing either Enter or F7.
You can configure Smart Step Into to be used instead of the regular Step Into every time there are multiple method calls on the line. This is done in .
Step out
Steps out of the current function and takes you to the code of the caller.
Click the Step Out button
or press Shift+F8.
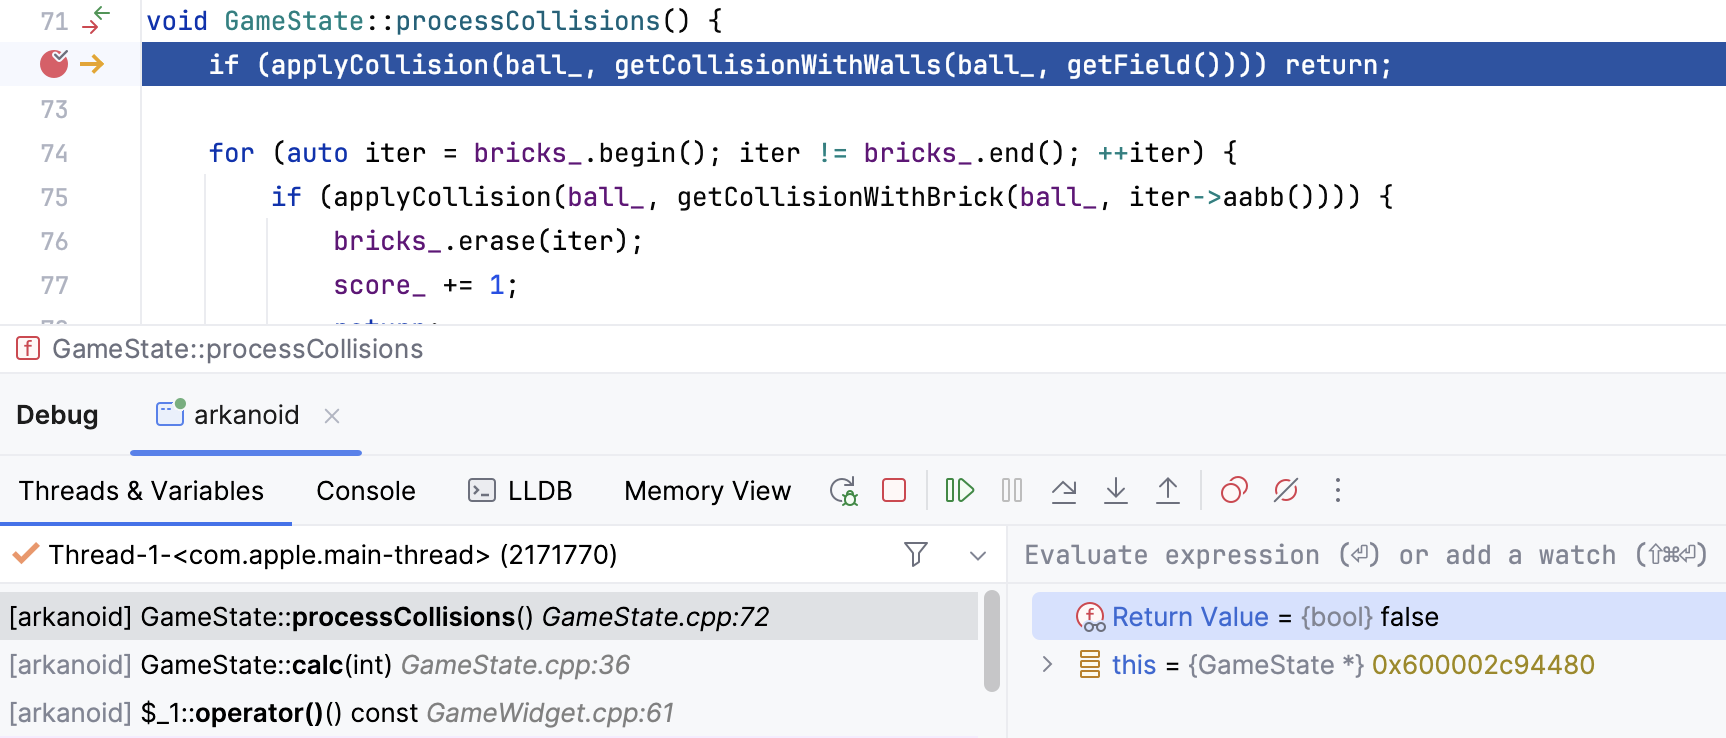
If the function you step out of has a non-void return type, the returned value is shown in the Variables pane:

Run to cursor
Continues the execution until the position of the caret is reached.
Place the caret at the line where you want the program to pause.
Select Run to Cursor from the
menu or press Alt+F9.
Also, you can Run to Cursor by hovering over the line and clicking the Run to Cursor icon.

You can configure whether you want Run to Cursor to work on clicking a line number in .
To skip any breakpoints on the way, use Force run to cursor.
Force step into
Steps into the function even if it is skipped by the regular Step Into by default.
Select Force Step Into from the
menu or press Alt+Shift+F7.
In case the source code of the function that you want to step into is unavailable, you can debug disassembled code in a dedicated view.
Force run to cursor
Continues the execution until the position of the caret is reached. All breakpoints on the way are ignored.
Place the caret at the line where you want the program to pause.
Select Force Run to Cursor from the
menu or press Ctrl+Alt+F9.
Force step over
Steps over the current line of code and takes you to the next line even if the current line has method calls in it. If there are breakpoints in the called methods, they are ignored.
Select Force Step Over from the
menu or press Alt+Shift+F8.
Reversible debugging
Although reversible debugging is not supported in CLion out-of-the-box, you can set it up on Linux using the Undo plugin.
The plugin integrates the Undo ’s record, rewind and replay technology in CLion. With Undo, you can record the program’s execution down to single instruction for further replay and analysis. This way, the debugger gets reversible: you can step forwards and backwards in your code and see exactly what is happening.
Read this blog post and watch this webinar recording for more information.