Debug disassembled code
During a debug session you can open the disassembled code
on demand for any frame when the sources are available,
by force stepping into it when the sources are not available.
Open disassembly view for a frame
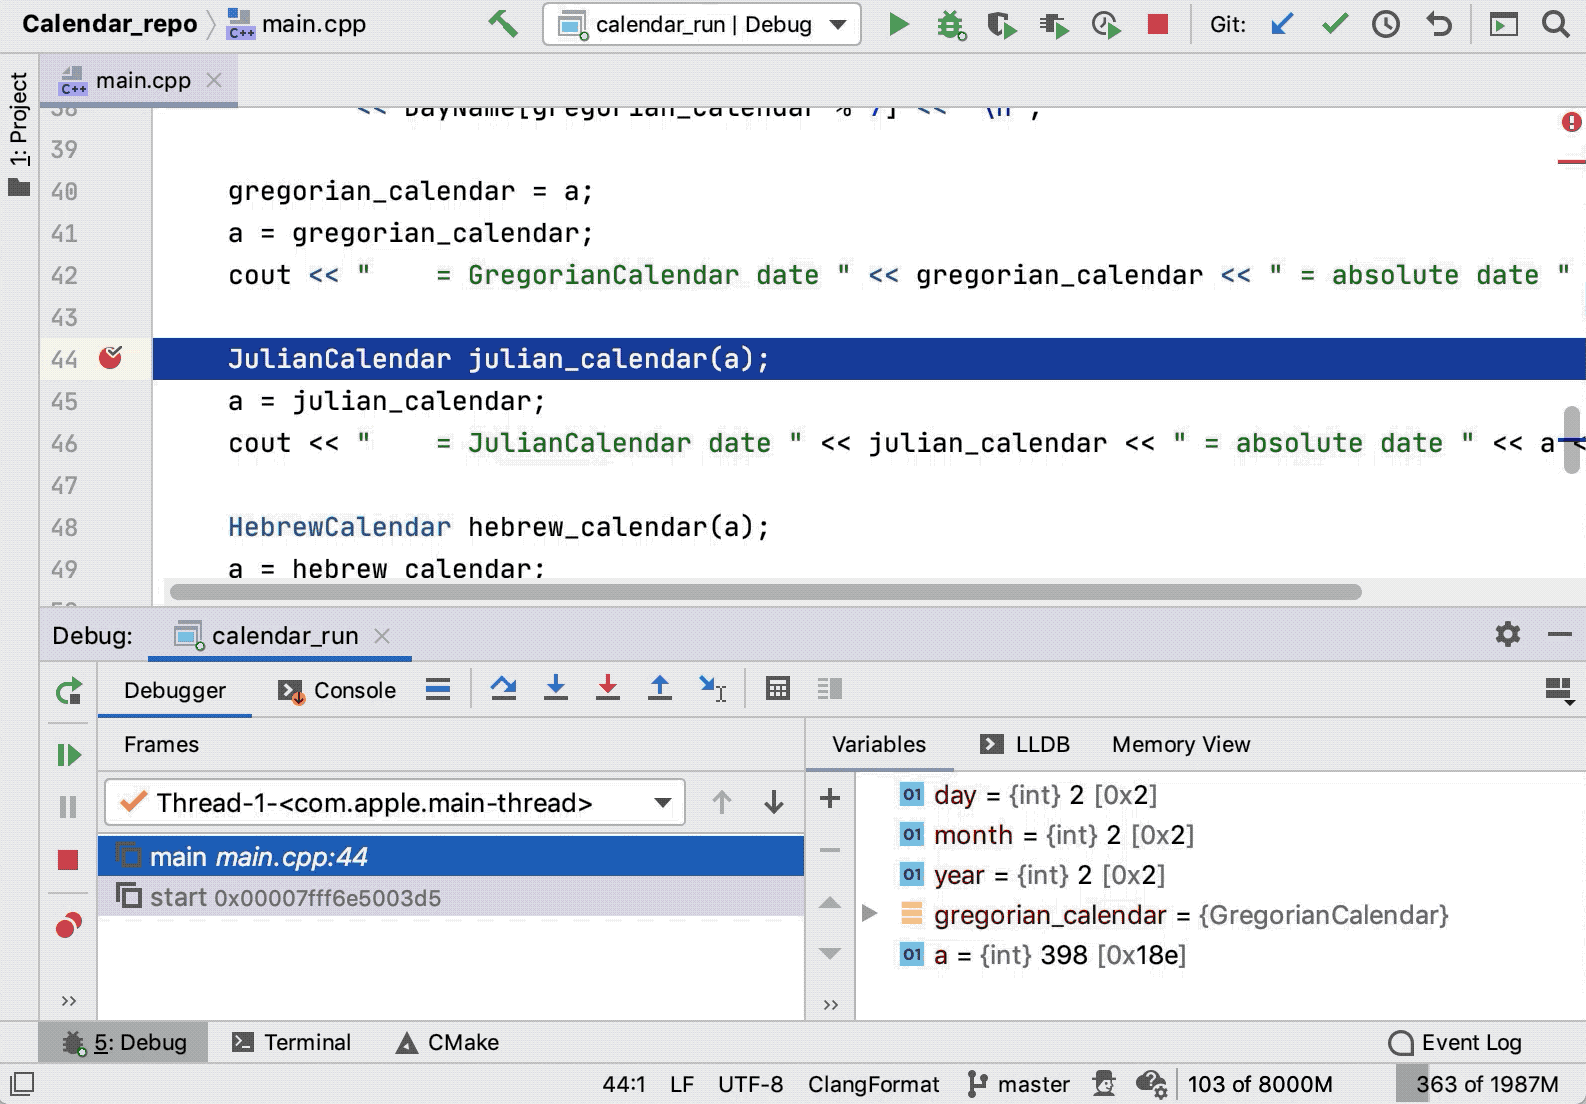
Right-click the desired frame in the Debug tool window and select Disassemble:

Disassembly view will be opened side-by-side with the source code:

Once opened, the disassembly view stays synchronized with the currently selected frame. When frames are switched, both the editor and the disassembly view scroll to the execution point.
Open disassembly view when sources are unavailable
When debugging your code, use the Force Step Into
 Alt+Shift+F7 command instead of Step Into F7. Step Into acts like Step Over for functions with no source code.
Disassembly view opens automatically when CLion cannot locate the source files during debugging. This can happen, for example, when you debug a custom executable using a fake CMake project or when there is a library built on CI without the source code being in the project.
To explicitly specify the source, click Select file in the notification:

Navigate to the desired frame in the Debug tool window.
Disassembly also opens automatically when you launch a debug session for the attached process that does not provide debug information.
Step through in disassembly
While in disassembly view, you can investigate your code using regular stepping actions.
You can also use the Set Execution Point action to jump to an arbitrary line of code in disassembly:

Breakpoints in disassembly
You can set breakpoints in disassembly the same way you do in the source code. These breakpoints are called address breakpoints.
Right-click a breakpoint to view the available options:

Click More or press Ctrl+Shift+F8 to edit address breakpoints in the Breakpoints dialog:

Go to address
Use the Go to field to jump to a desired code line. In this field, you can enter an address or any expression that can be evaluated into an address.
If you need to include a register into the expression, start its name with $ (the GDB notation).

Use x86 syntax in disassembly
Use the
 menu to switch to x86 assembly (Intel) syntax:
This option is also available in Assembly view for files. The configurations are independent: the Disassembly view configuration does not affect the Assembly view, and vice versa.
Syntax highlighting in assembly files
Syntax highlighting is available for AT&T assembly code.
By default, the .s and .asm files are recognized as assembly code files, but you can configure other types:
Go to .
Select Assembly Language in the list of recognized file types and add a new extension to the list.