Examine suspended program
After the debugger session has started, the Debug tool window will appear, and the program will run normally until one of the following happens:
a breakpoint is hit
you manually pause the program
After that, the program is suspended, allowing you to examine its current state, control its further execution, and test various scenarios at runtime.
Examine frames
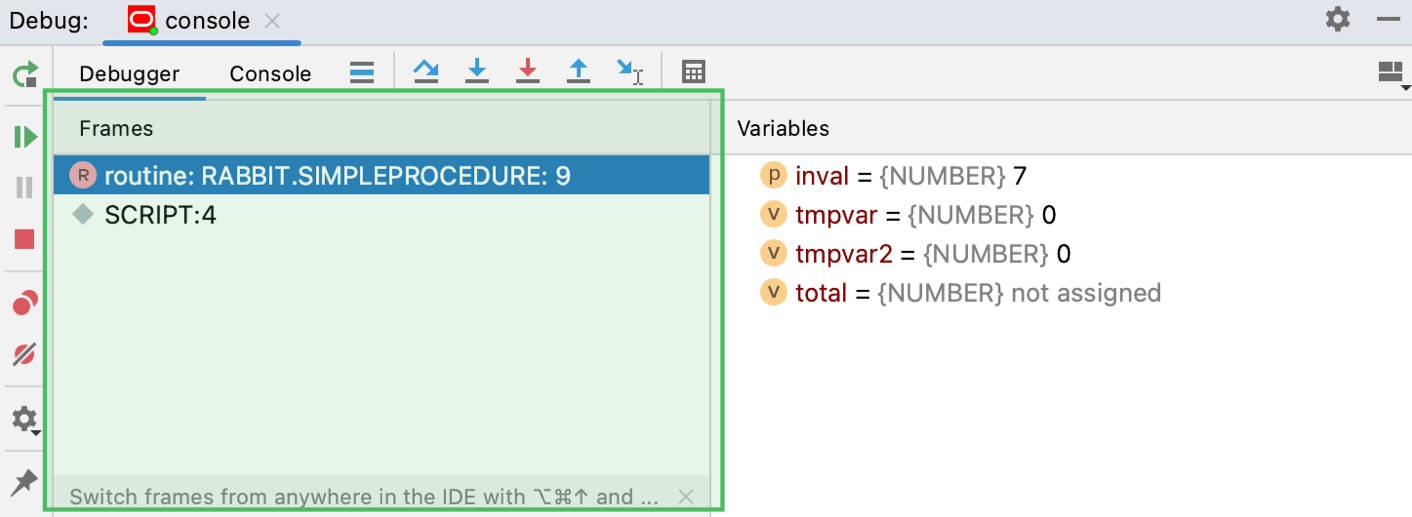
The state of the program is represented by frames. When the program is suspended, the current frame stack is displayed on the Frames tab of the Debug tool window.

Examining frames helps you understand why particular parameters were passed to a PL/SQL object and what the state of the caller was at the time of calling.
Copy stack to clipboard
To copy the call stack , right-click anywhere on the Frames tab and select Copy Stack.
Examine variables
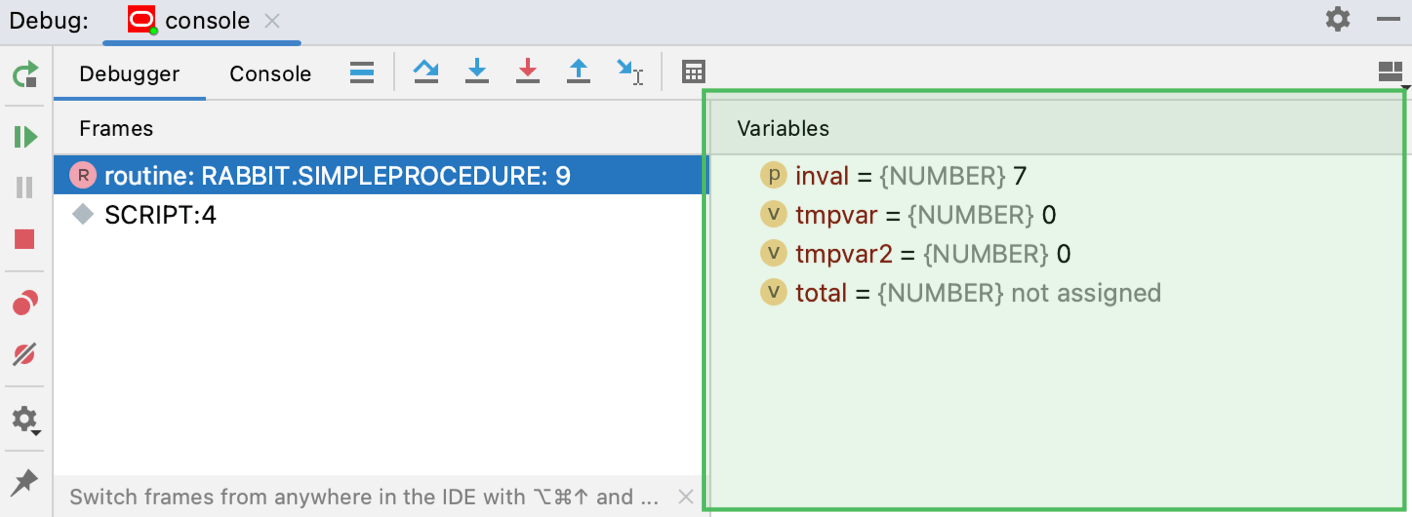
The Variables tab shows the list of the variables in the selected frame/thread. The examination of variables is instrumental to understanding why the program operates in a certain way.

The icon on the left of each variable indicates its type.
Variable types
Icon | Description |
|---|---|
A parameter | |
Variables |
Copy variables
When examining variables, you may need to copy a variable name or value to paste it somewhere else or to compare it with another variable.
To copy the value that a variable holds, right-click the variable and select Copy Value Control+C.
To copy the name of a variable, right-click the variable and select Copy Name.
Compare variables with clipboard
When you need to compare a variable value with some other value, use the Compare Value with Clipboard option. This is helpful, for example, when a variable holds a long string, and you need to compare it with another long string.
Copy the content you are going to compare (for example, from a text file).

In the Variables tab, right-click the variable which you are going to compare with and select Compare Value with Clipboard.
Examine the differences in the Diff Viewer that opens. For additional information on how to efficiently use the Diff Viewer, refer to the Comparing Files and Folders topic.

View variables in a dedicated dialog
DataGrip allows you to inspect variables in a dedicated dialog. This is useful when you need to keep track of some variable (or the object whose reference it holds) and at the same time be able to navigate between frames.
Right-click a variable on the Variables tab and select Inspect.
Return to the current execution point
Examining the program state involves navigating in code, and you often need to return to the place where your program is suspended.
Do one of the following:
From the main menu, select .
Press Alt+F10.
Click
on the stepping toolbar of the Debug tool window.
The current execution point is indicated with a blue line. The code at this line has not been executed yet.