Step through the program
Stepping is the process of controlling step-by-step execution of the program.
DataGrip provides a set of stepping actions, which are used depending on your strategy (for example, whether you need to go directly to the next line or enter the methods invoked on your way there).
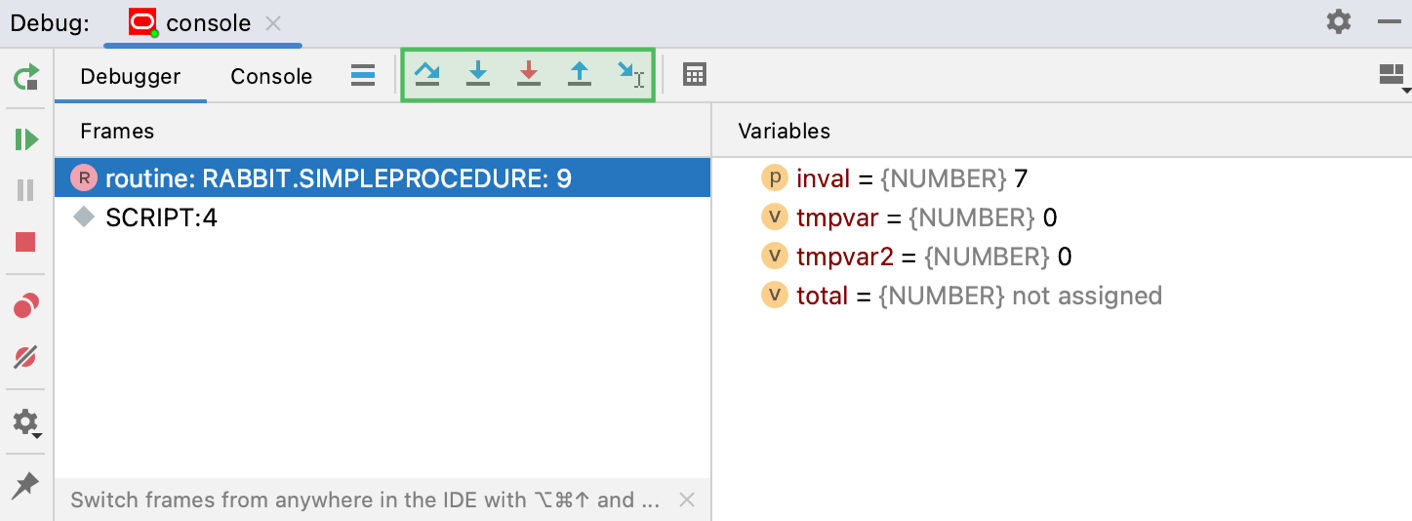
The stepping buttons are located on the Debug window toolbar.

Step over
Steps over the current line of code and takes you to the next line even if the highlighted line has method calls in it. The implementation of the methods is skipped, and you move straight to the next line of the caller method.
Click the Step Over button
or press F8.
Step into
Steps into the method to show what happens inside it. Use this option when you are not sure the method is returning a correct result.
Click the Step Into button
or press F7.
If there are several method calls on the line, DataGrip asks you which method to enter. This feature is called Smart step into.
Smart step into
Smart step into is helpful when there are several method calls on a line, and you want to be specific about which method to enter. This feature allows you to select the method call you are interested in.
From the main menu, select or press Shift+F7.
Click the method. You can also select it using the arrow keys or tabs and press Enter/F7.
You can configure Smart Step Into to be used instead of the regular Step Into every time there are multiple method calls on the line. This is done in .
Step out
Steps out of the current method and takes you to the caller method.
Click the Step Out button
or press Shift+F8.
In the example, stepping out skips all iterations of the loop and takes you straight to the main method (the caller).
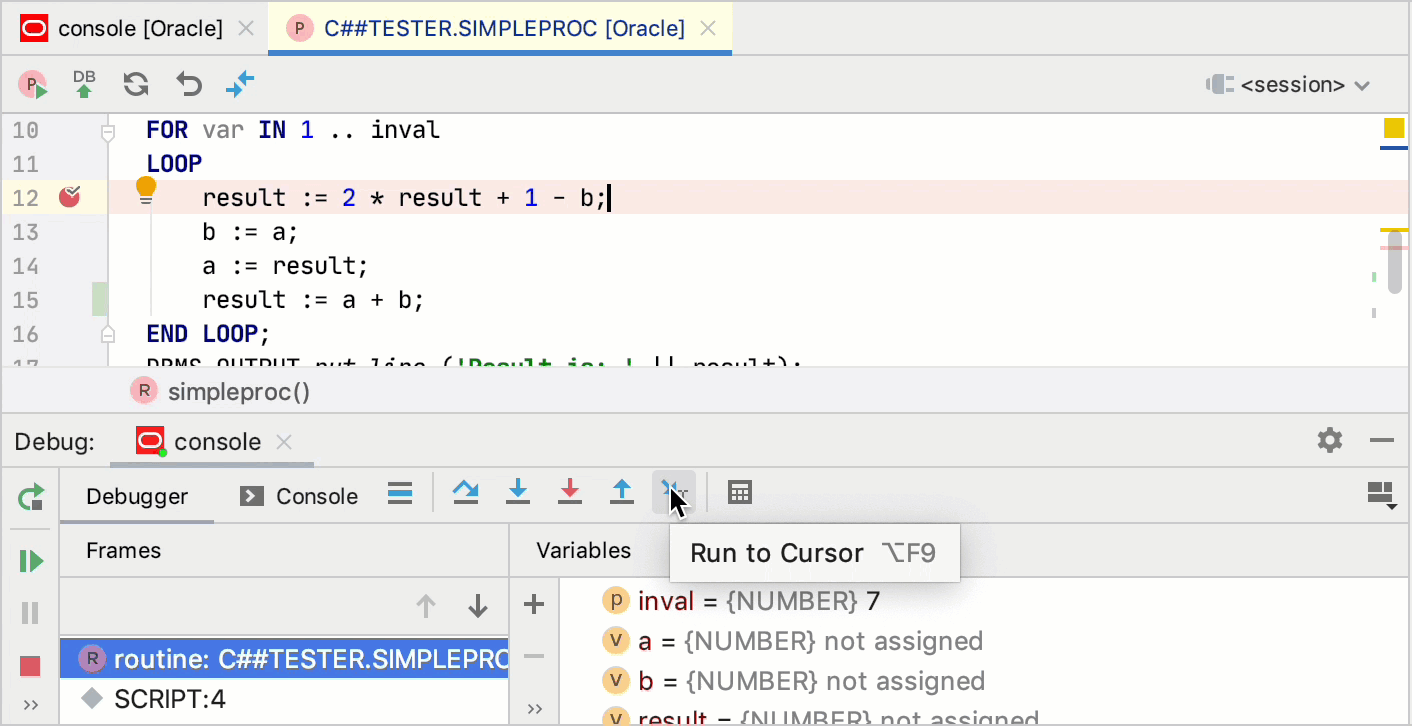
Run to cursor
Continues the execution until the position of the caret is reached.
Place the caret at the line where you want the program to pause.
Click the Run to Cursor button
or press Alt+F9.
Also, you can Run to Cursor by clicking the line number in the gutter.

You can configure whether you want Run to Cursor to work on clicking a line number in .
When a breakpoint is reached , the Debug tool window becomes active and enables you to get control over the program's execution. For this purpose, you can use the Run menu commands, or the icons on the stepping toolbar of in the Debug tool window.
Each stepping action advances the execution point to the next execution location, depending on the action you choose.
Stepping modes
When you debug PL/SQL code, you can select between two stepping modes: Graceful and Native.
In Graceful mode, you can pause the session that you debug (the target session), set and remove breakpoints. If no valid breakpoints are set, the debugger steps through code on a line-by-line basis.
In Native mode, the debugger uses Oracle native debugging commands. You cannot pause the target session or manage breakpoints but you might experience a boost in performance in CPU-intensive operations (operations that include a lot of computations and loops). You can read more about Oracle debugging commands in the official Oracle documentation. If no valid breakpoints are set, the debugger executes the whole routine.
Change the stepping mode
Open settings (Control+Alt+S) and navigate to .
From the Stepping mode list, select the stepping mode that you need.
Pause at the beginning of debuggable code
You can force the debugger to pause at the beginning of debuggable code. The place where the debugger pauses is detected automatically. If you assign variable values in the declaration section, the debugger pauses at the variable declaration. If no values are assigned to variables, the debugger skips the declaration section and pauses at the BEGIN keyword in the execution section.
Open settings (Control+Alt+S) and navigate to .
Select Pause at begin.
