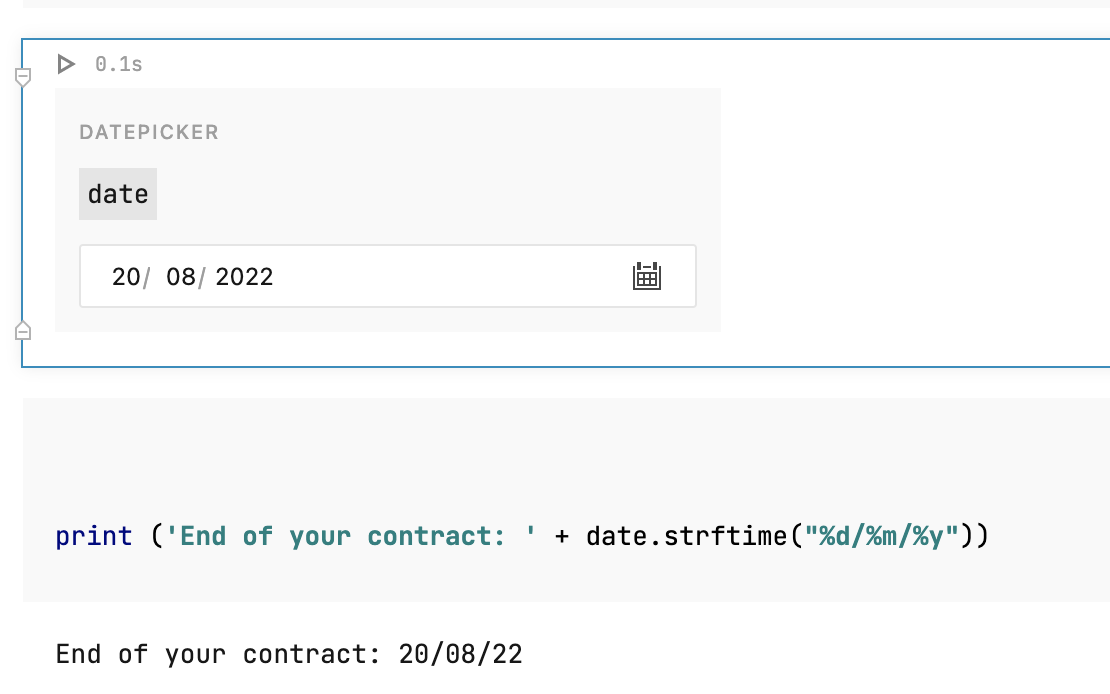
Interactive controls
Interactive controls are a special cell type that helps you quickly customize the output without manually changing the code. Use one of the controls (dropdown, slider, text field, and checkbox) to provide values for one of the variables in your code and update the output on the fly.
We suggest that you go to this tutorial to see how you can use interactive controls. Click Edit copy in the upper right corner and try it for yourself.
Add a dropdown control
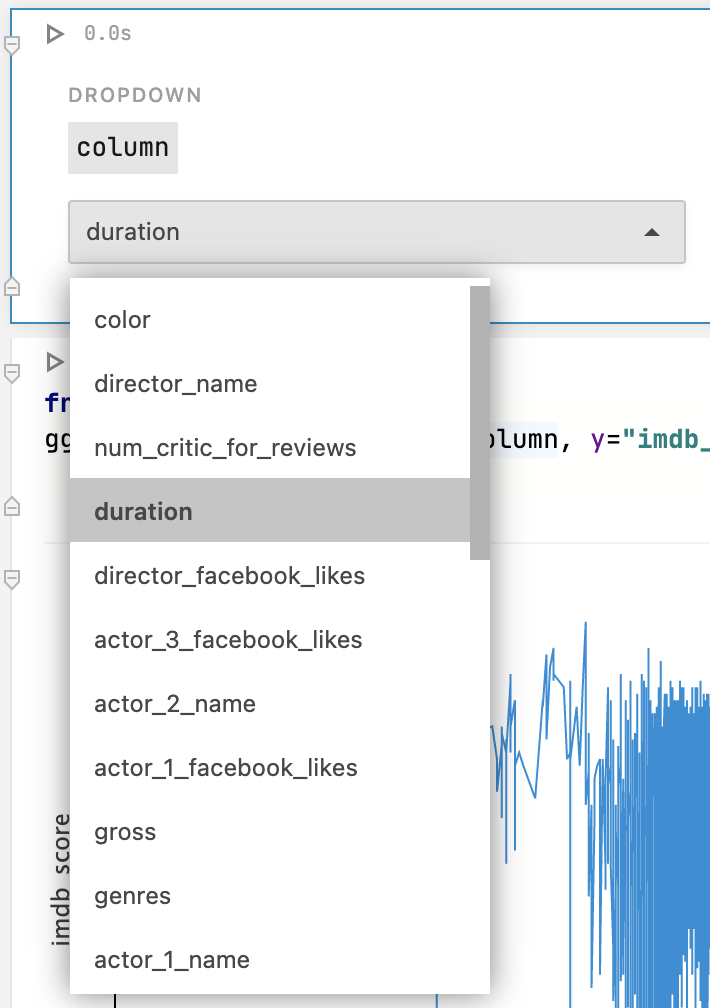
A dropdown control allows you to choose from a set of options that will be used as values for one of the variables in your code.
Create an array or list to use as a source of values for your dropdown control. This step allows you to use a dynamic dataset based on the visualized DataFrame, as opposed to manually provided values. Follow the example below:
[array_name] = [DataFrame_name].columns.valuesUse this array when selecting a set of variables for your dropdown control.
Run this cell to make the array available for your dropdown control.
Add a dropdown cell:
Hover over the lower border of the previous cell, click More cell types, and select Dropdown.
Use the cell context menu to add the required cell type.
Hover over the control in the cell and click the settings icon.
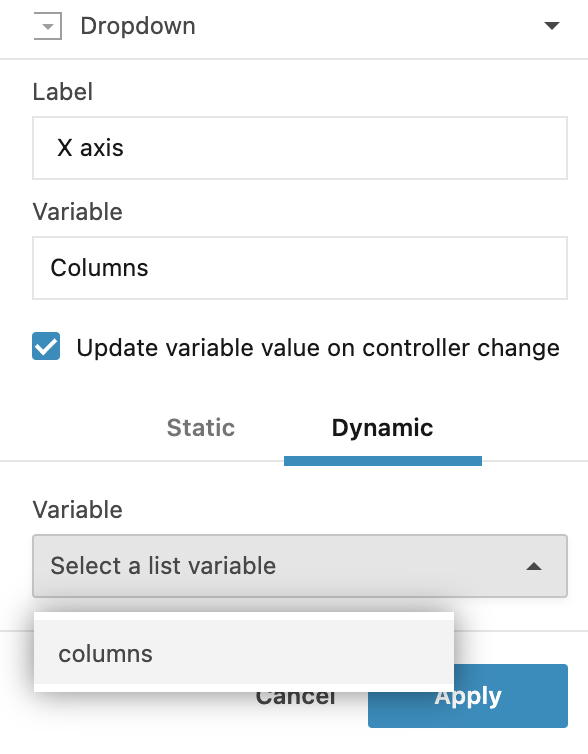
In the Dropdown dialog, do the following:
Provide a name for the control.
Provide a name for the variable. You will reference this variable in your code.
Provide the values:
(Recommended) Use an array of values created earlier. Switch to the Dynamic tab to select a source of values. This is where you can select the array created in the first step.
Enter the values manually on the Static tab. Separate each entry with a comma.
Optionally, click Multiselect to allow selecting multiple options.
Click Apply to close the dialog. The control is added to the notebook.
Edit the code by inserting the variable name from the previous step. For example, in the code below, the
columnvariable is used to provide values for the X axis.from lets_plot import * ggplot() + geom_line(aes(x=columns, y="imdb_score"), data=df, sampling=sampling_systematic(n=5000)) + scale_x_log10()Use the added control to set a value for the specified variable and run the cell with the code to verify how it works.
Add a slider control
Add a slider cell:
Hover over the lower border of the previous cell, click More cell types, and select Slider.
Use the cell context menu to add the required cell type.
Hover over the control in the cell and click the settings icon.
In the Slider dialog, do the following:
Provide a name for the control.
Provide a name for the variable. You will reference this variable in your code.
Fill in the Minimum value expression, Maximum value expression, and Step size expression (optional) fields. If the step size is not specified, the slider supports floating numbers.
Enter numerical values.
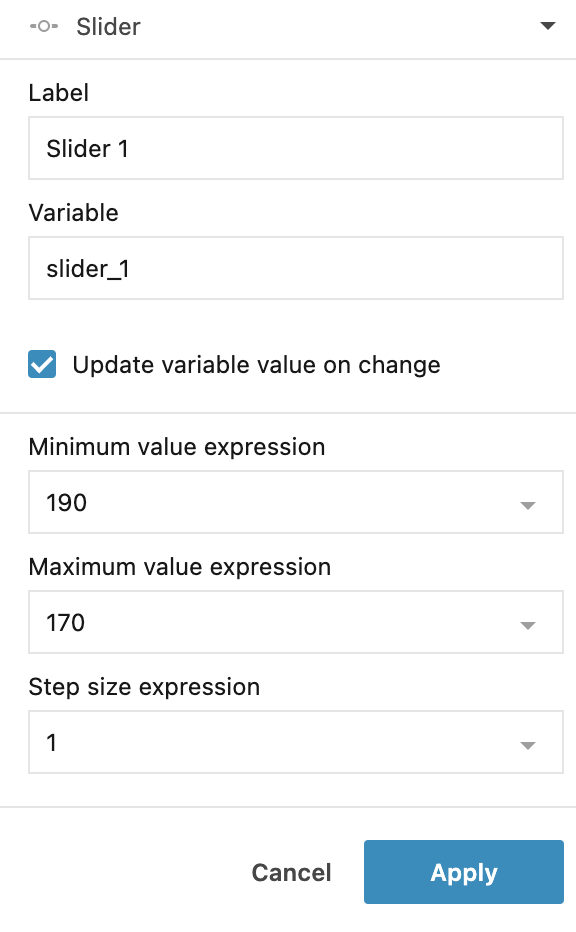
Click the expand icon and choose a numeric variable from your code.
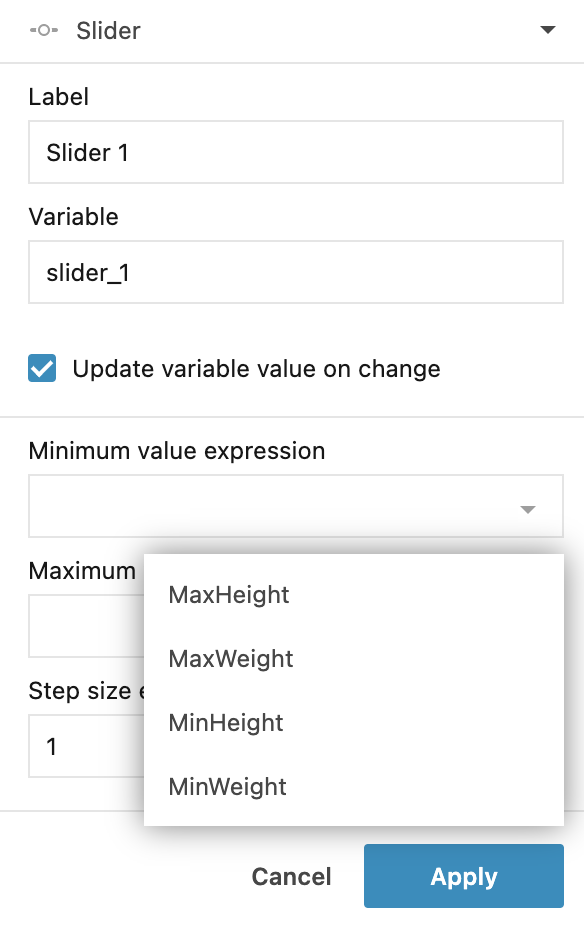
Click Apply to close the dialog. The control is added to the notebook.
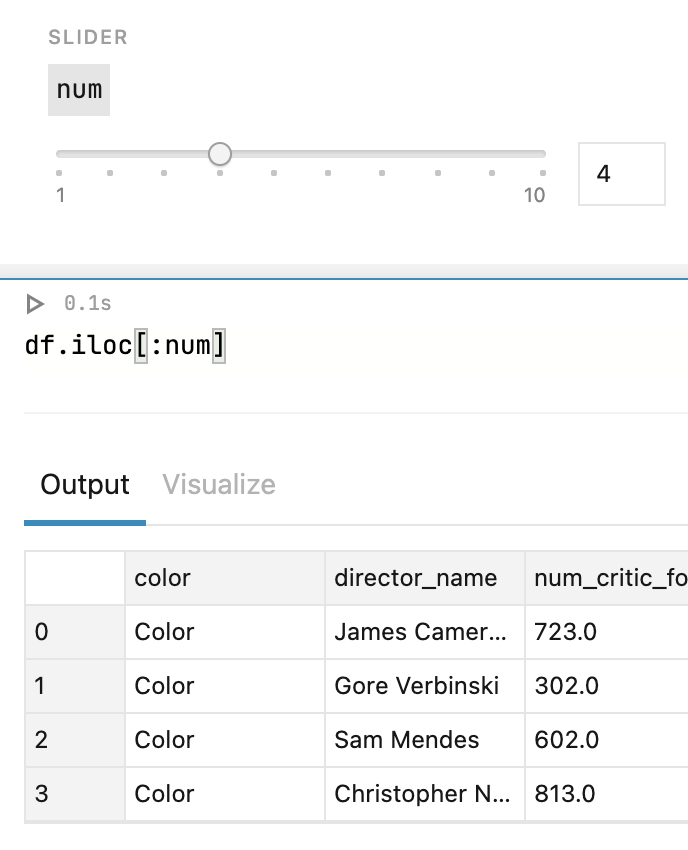
Edit the code by inserting the variable name from the previous step. For example, in the code below, the
numvariable is used to define the number of rows to be displayed.df.iloc[:num]Use the added control to set a value for the specified variable and run the cell with the code to verify how it works.
Add a text control
Add a text cell:
Hover over the lower border of the previous cell, click More cell types, and select Text.
Use the cell context menu to add the required cell type.
Hover over the control in the cell and click the settings icon.
In the Text dialog, do the following:
Provide a name for the control.
Provide a name for the variable. You will reference this variable in your code.
Select the Multiline input checkbox to enable multiple lines of input in the text field.
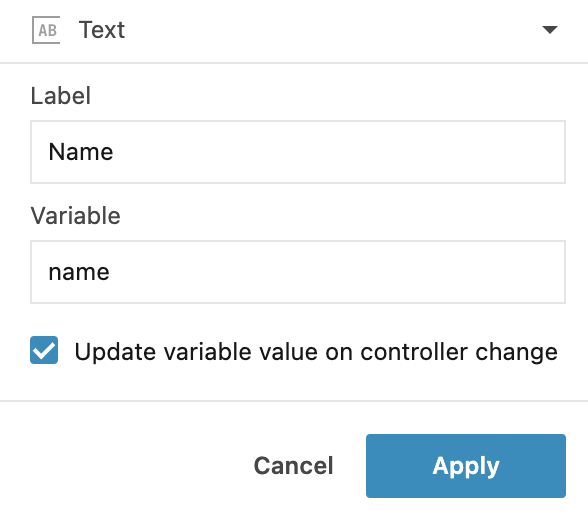
Click Apply to close the dialog. The control is added to the notebook.
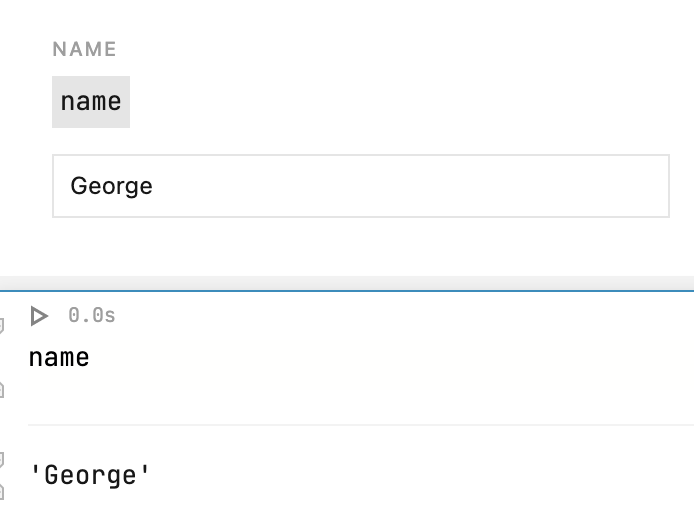
Add the variable name from the previous step to your code cell.
Enter a text in the added text control and run the cell with the code to verify how it works.
Add a checkbox control
Add a checkbox cell:
Hover over the lower border of the previous cell, click More cell types, and select Checkbox.
Use the cell context menu to add the required cell type.
Hover over the control in the cell and click the settings icon.
In the Checkbox dialog, do the following:
Provide a name for the control.
Provide a name for the variable. You will reference this variable in your code.
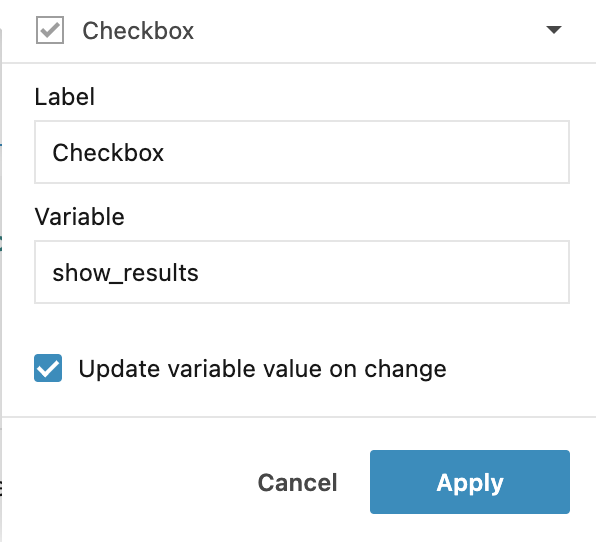
Click Apply to close the dialog. The control is added to the notebook.
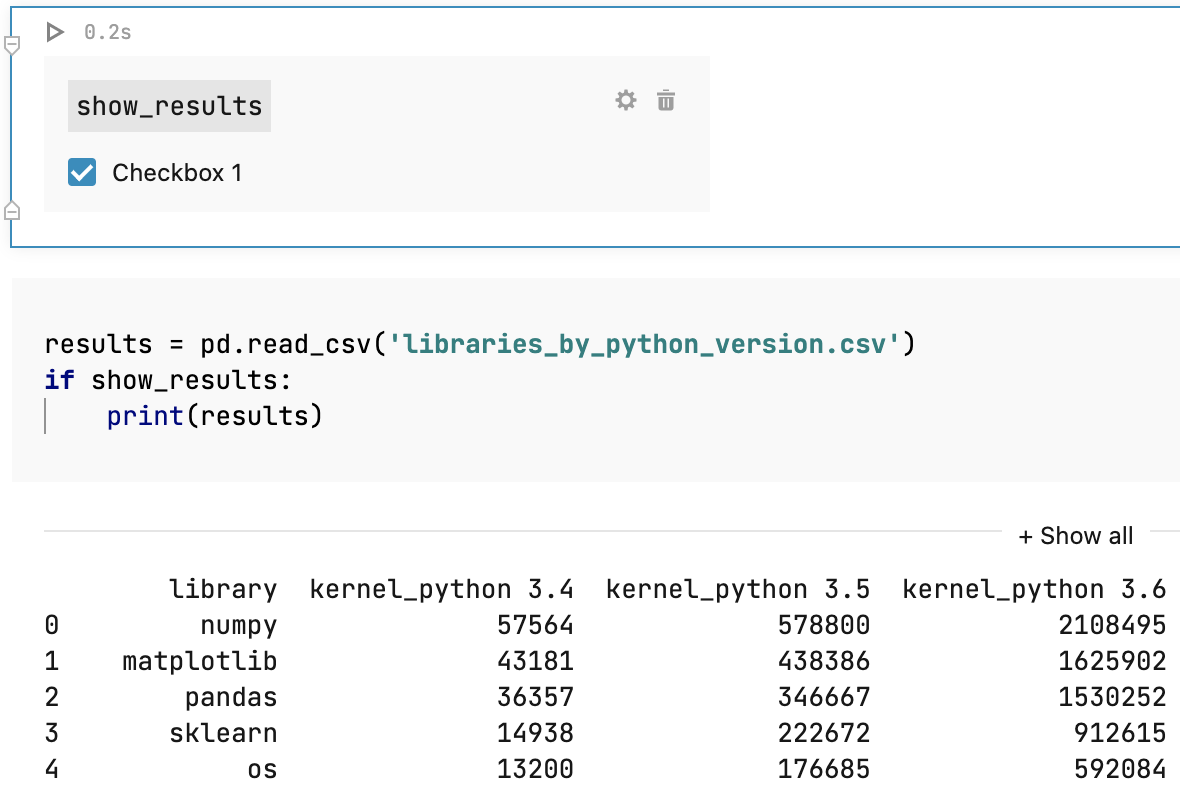
Edit the code by inserting the variable name from the previous step. For example, in the code below, the
show_resultsvariable is used to define whether the results dataframe content is displayed.results = pd.read_csv('libraries_by_python_version.csv') if show_results: print(results)Select the checkbox in the control that you added to verify how it works.
Add a datepicker
Add a datepicker cell:
Hover over the lower border of the previous cell, click More cell types, and select Datepicker.
Use the cell context menu to add the required cell type.
Hover over the control in the cell and click the settings icon.
In the Datepicker dialog, do the following:
Provide a name for the control.
Provide a name for the variable. You will reference this variable in your code.
Select the Range selector option to add a datepicker with a range selector.
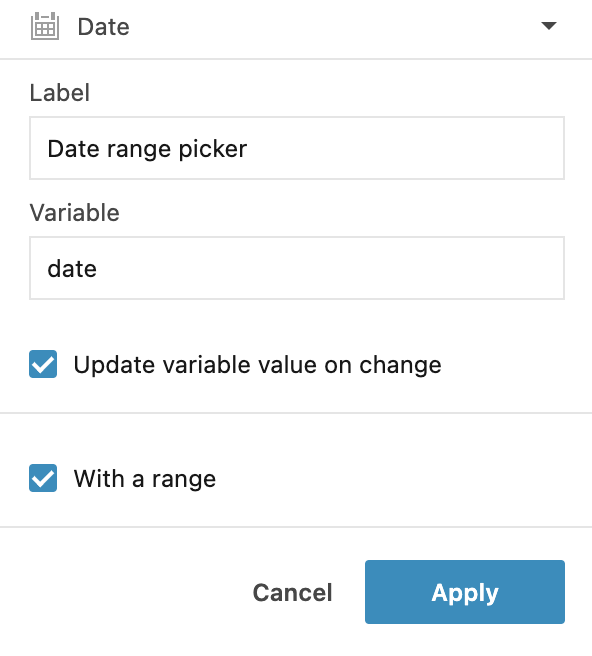
Click Apply to close the dialog. The control is added to the notebook.
Edit the code by inserting the variable name from the previous step. For example, in the code below, the
datevariable is used to specify contract expiry dates.print ('End of your contract: ' + date.strftime("%d/%m/%y"))Click the datepicker icon and select a date to verify how it works.
