Set up Coverage on JetBrains TeamCity
Normally, a continuous integration (CI) build for a .NET solution consists of a series of tasks that involve compiling and running tests. In terms of JetBrains TeamCity CI server, these tasks are called build steps. As TeamCity comes bundled with dotCover command-line tool, you can collect code coverage data by just enabling the corresponding build step option. TeamCity-collected coverage results can be viewed as a report inside TeamCity or downloaded as a coverage snapshot and viewed inside Visual Studio.
For example, we have a simple solution that consists of two projects: one stands for the application and the other one for the test assembly. Our task is to set up continuous integration build that compiles the application, runs tests, and collects tests coverage statistics. Note that the workflow differs depending on the unit test runner you use:
MSTest/NUnit
The MSTest and NUnit test runners are provided by TeamCity out of the box, so, generally, all you need is to add a build step with the corresponding runner.
Set up coverage analysis of MSTest/NUnit tests in TeamCity
In TeamCity, create a new build project and setup the VCS root. Then add a new Build Step: Create a new project and a new build configuration inside the project.
Add a first build step, that will build the solution and tests. In our particular example, we use the .NET runner (requires the following software to be installed on a build agent), but you have a number of other options on how to build: directly run MSBuild, run batch file, and so on.

Notice that all we are doing here is building the solution. No coverage settings yet.
Add a build step that runs the tests. If you use MSTest tests, select the .NET runner with `vstest` as a Command. Our sample solution uses NUnit tests, therefore, we choose the NUnit runner. Here we also specify the NUnit version, .NET runtime parameters and path to the tests assembly.

Now, it's time to set up coverage. In the .NET coverage tool, choose JetBrains dotCover.
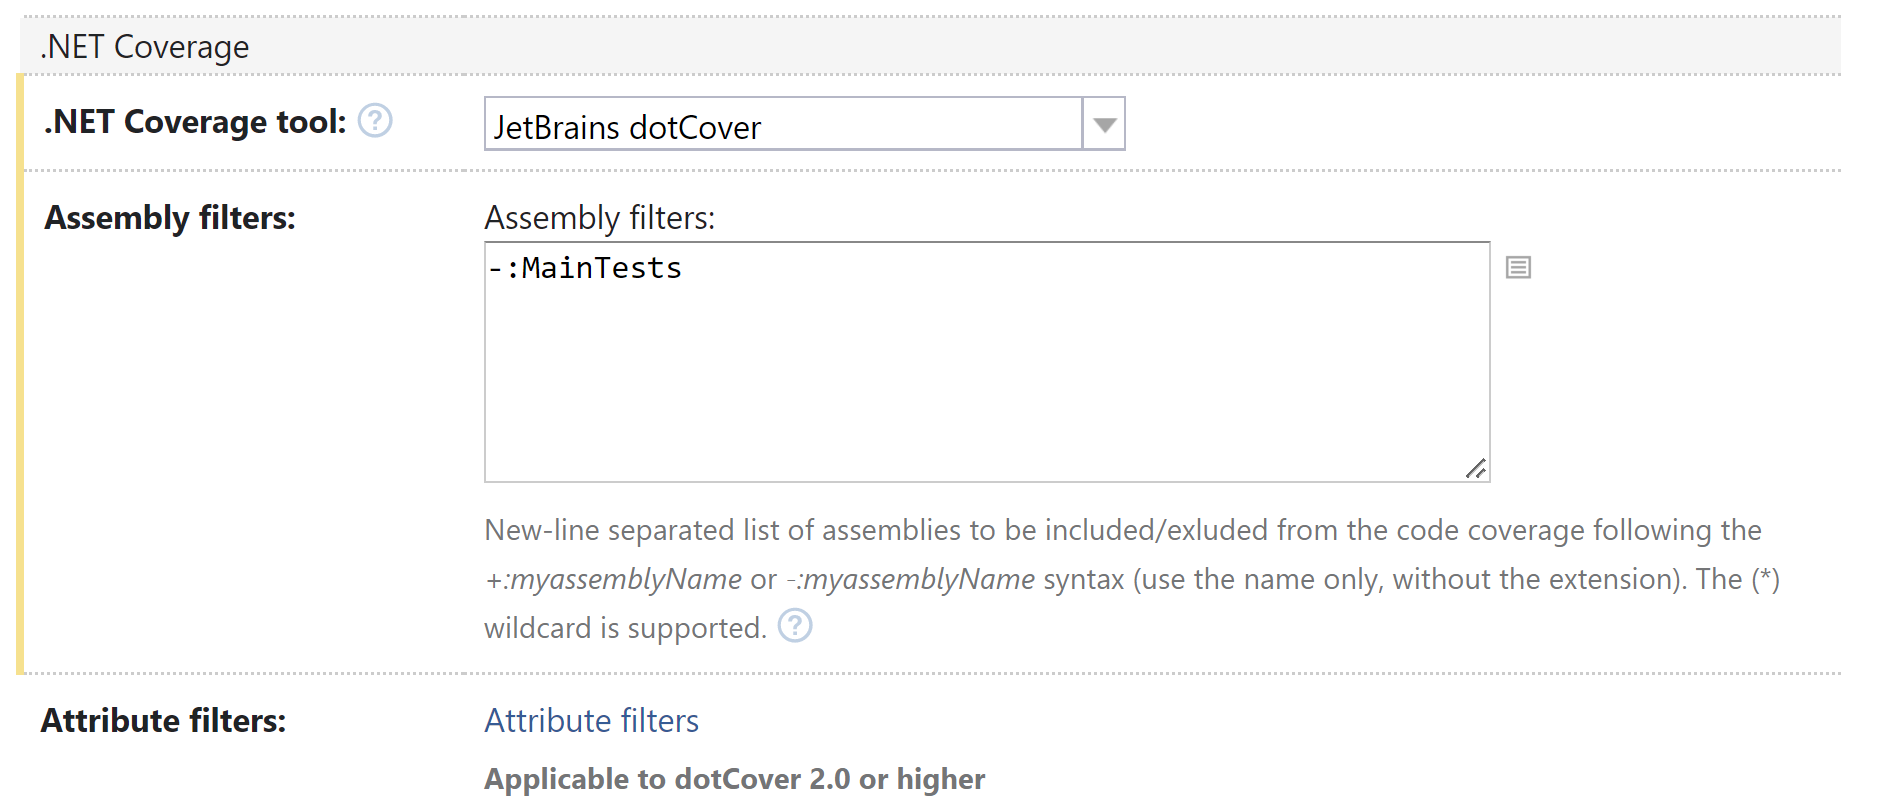
In Assembly Filters, add the assemblies you want coverage for (just the name of the assembly) prefixing them with
+:and filter out those you do not want coverage for with–:. In our example, we exclude theMainTestsassembly that contains running tests.Save the configuration and run it to see how it works.
Once the build is finished, the Overview tab will contain a short report on code coverage.

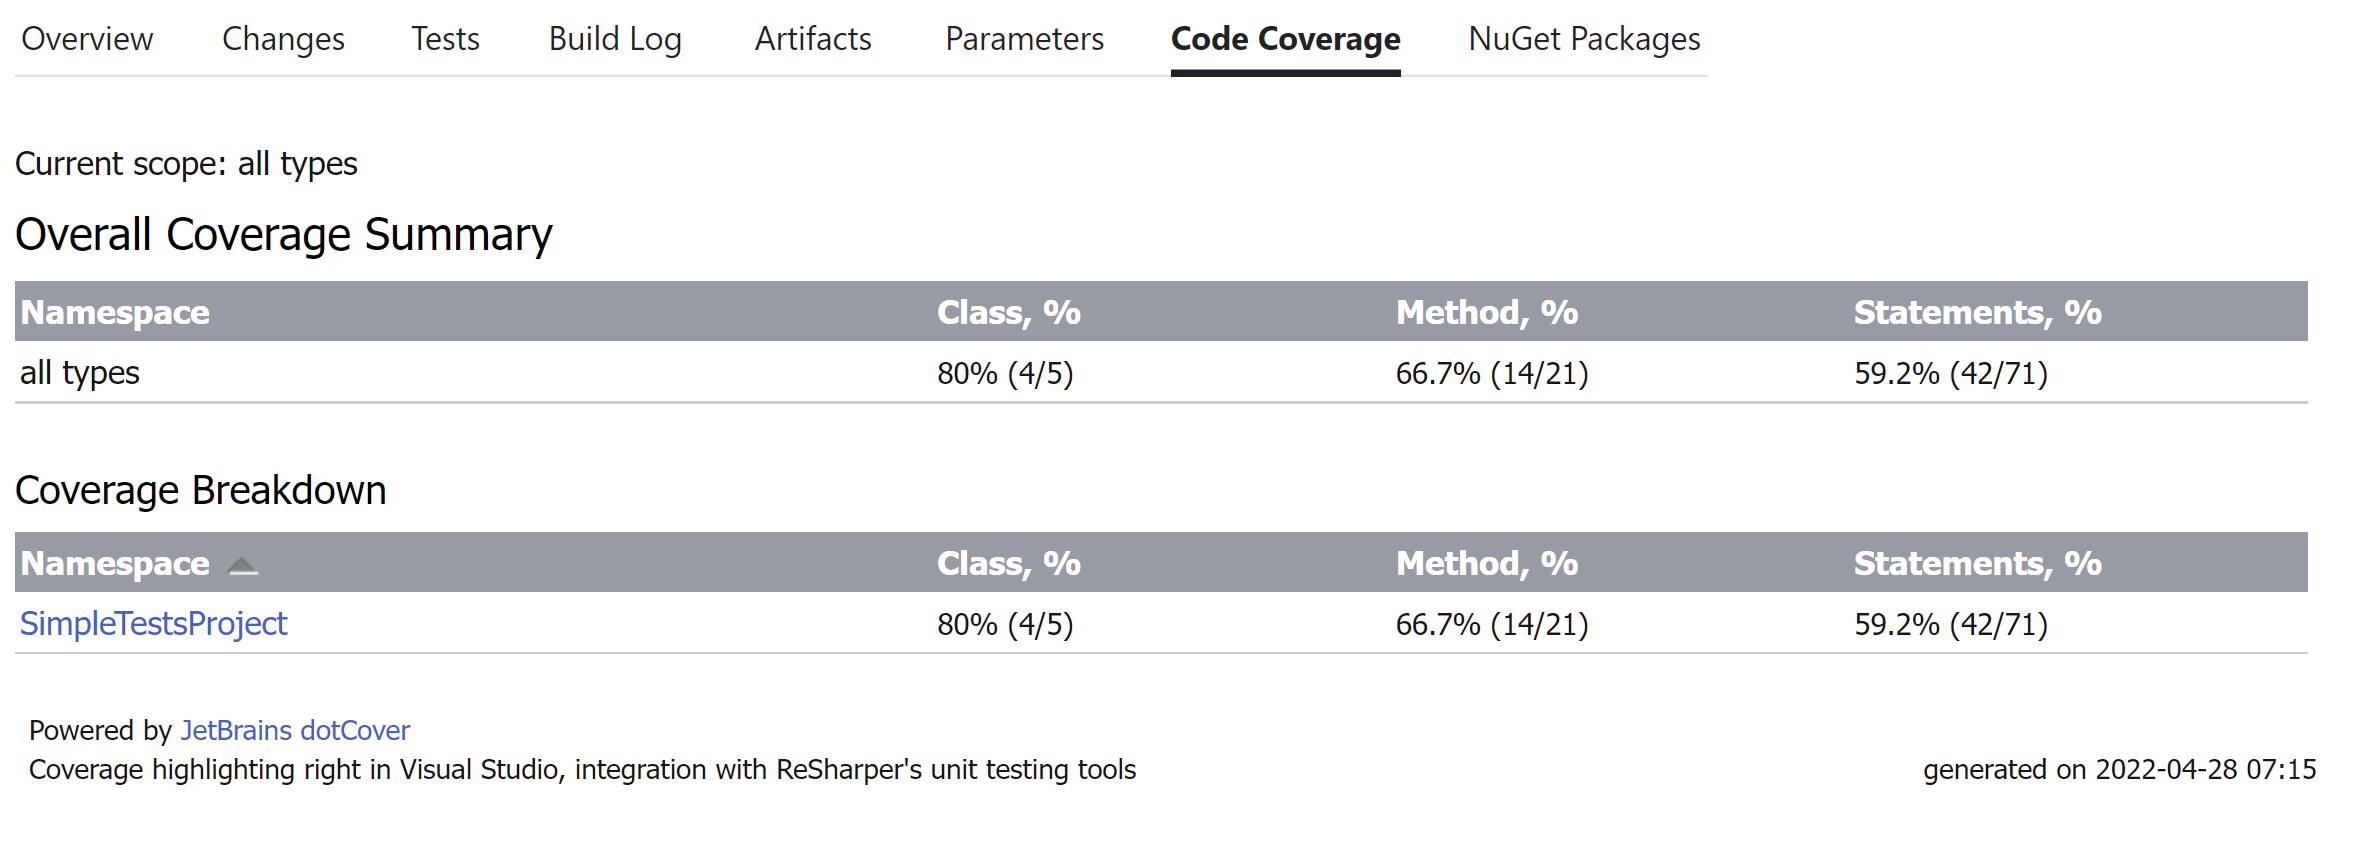
To see the details, switch to the Code Coverage tab. Here you can view the detailed statistics on how much of class/methods do the tests cover.
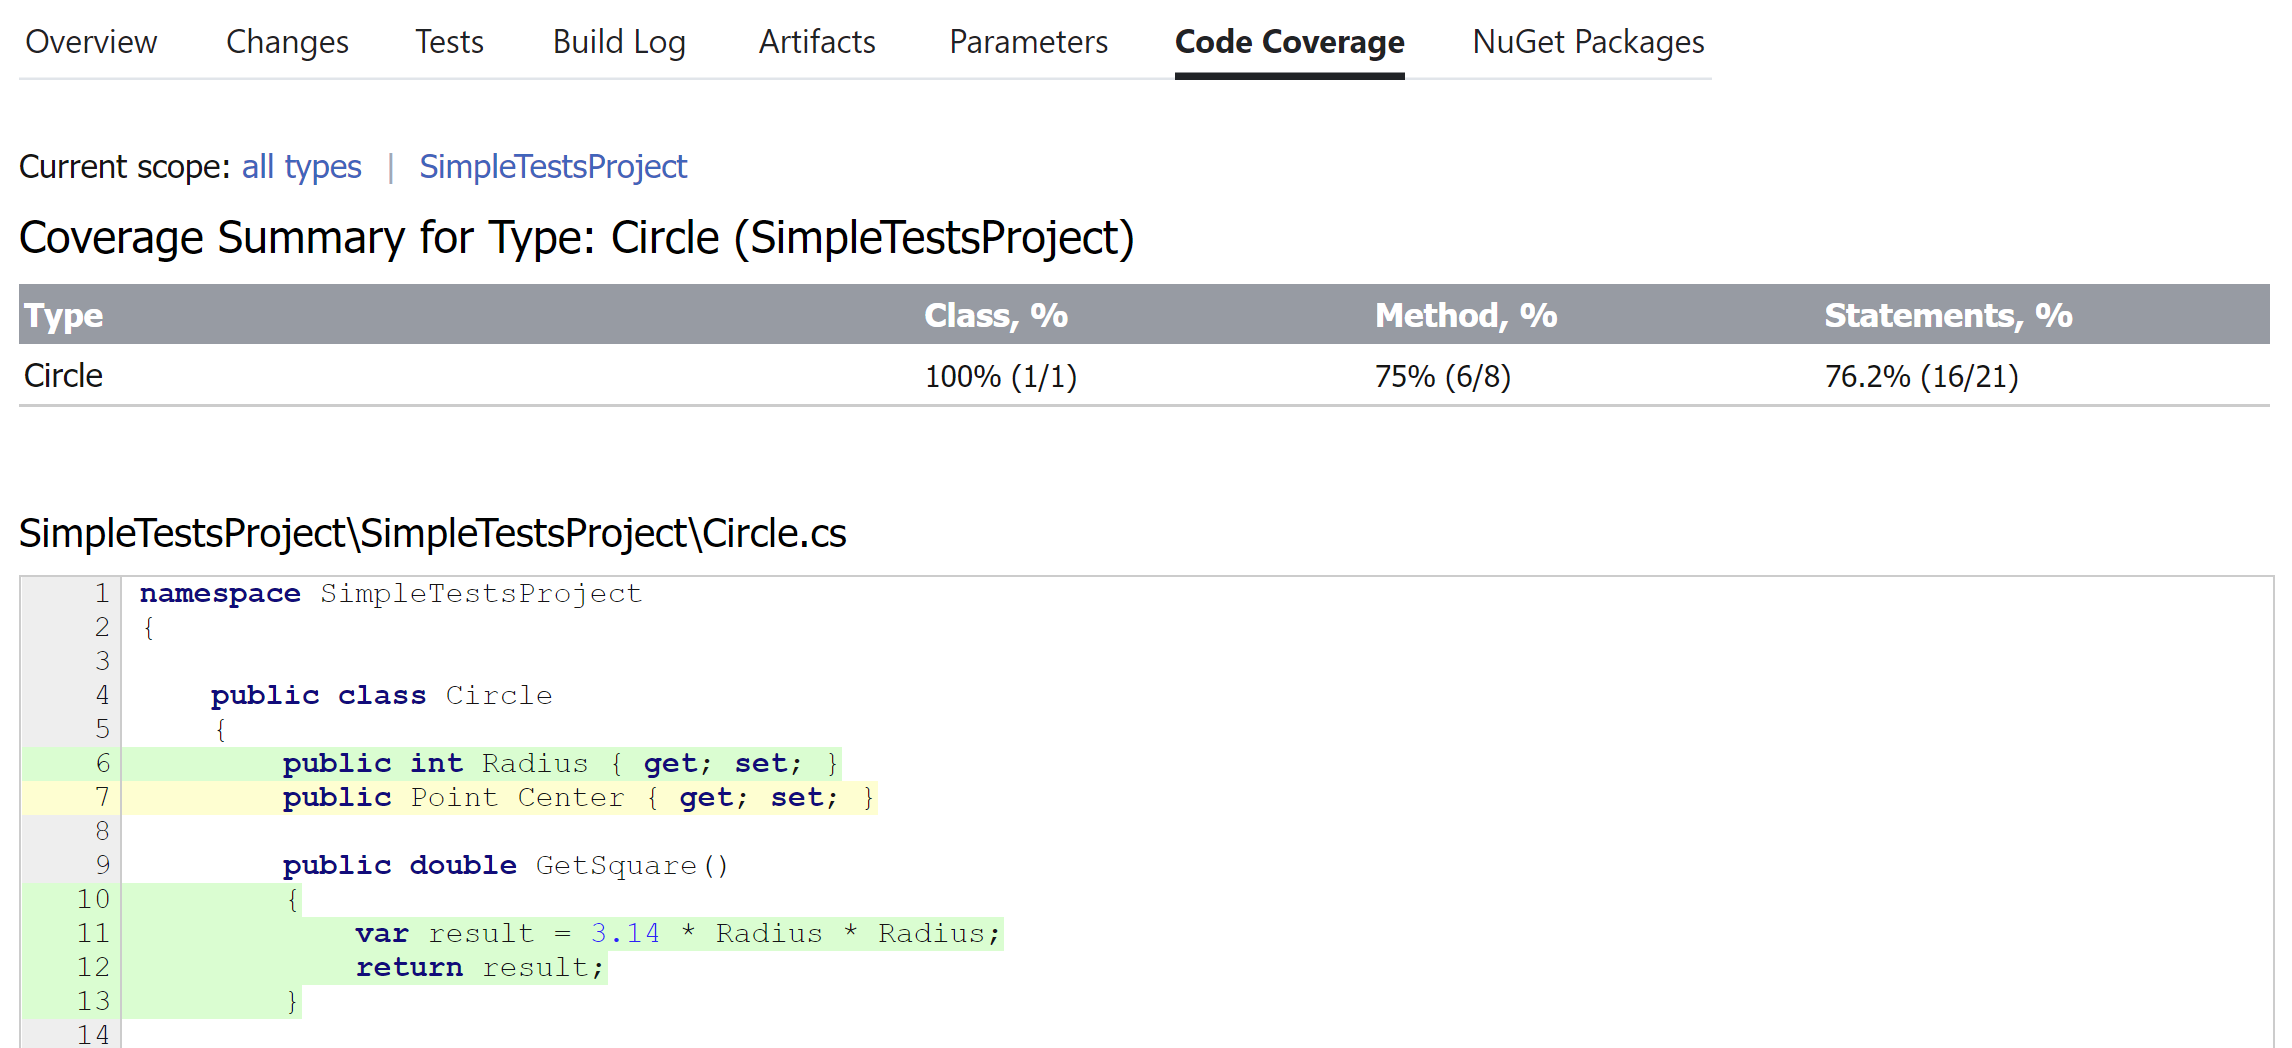
Or even drill down into individual classes and examine the code coverage.
Build artifacts now contain coverage files zipped up.

Note that in a real-life environment, you may have two different build configurations: one that builds binaries and the other one that collects code coverage. In that case, you should use snapshot dependency in order the second build configuration could find source files. Otherwise, you will see the
Source code is not availablemessage when trying to view source code.
To solve the issue, follow the instructions from the TeamCity documentation.
xUnit
The main problem with running and getting coverage of xUnit tests is that xUnit is not supported by TeamCity out of the box. This creates two issues that must be solved:
xUnit packages must be provided to build a solution.
Committing binary libraries to VCS is not a good practice, so, restoring the packages must be a separate build step before the compilation stage.
xUnit test runner must be provided and run manually.
The good news:
The runner is distributed as a NuGet package, so, it can be referenced right in your solution and then restored during a build (see a).
There are no additional actions required to get tests results as the runner provides the results in the format of TeamCity service messages.
Set up coverage analysis of xUnit tests in TeamCity
In Visual Studio, open your solution. In the tests project, add a reference to the
xunit.runner.consoleNuGet package.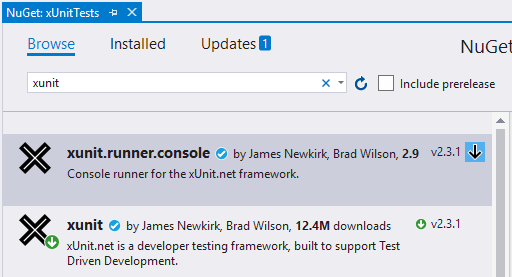
In TeamCity, create a new build project and setup the VCS root. Then add a new Build Step: Create a new project and a new build configuration inside the project.
Make sure that TeamCity is configured as a NuGet server: in find the NuGet.exe table and check whether it contains the required NuGet version. If there is no such a table, add the NuGet to TeamCity by clicking the Install Tool... button and following the required steps.
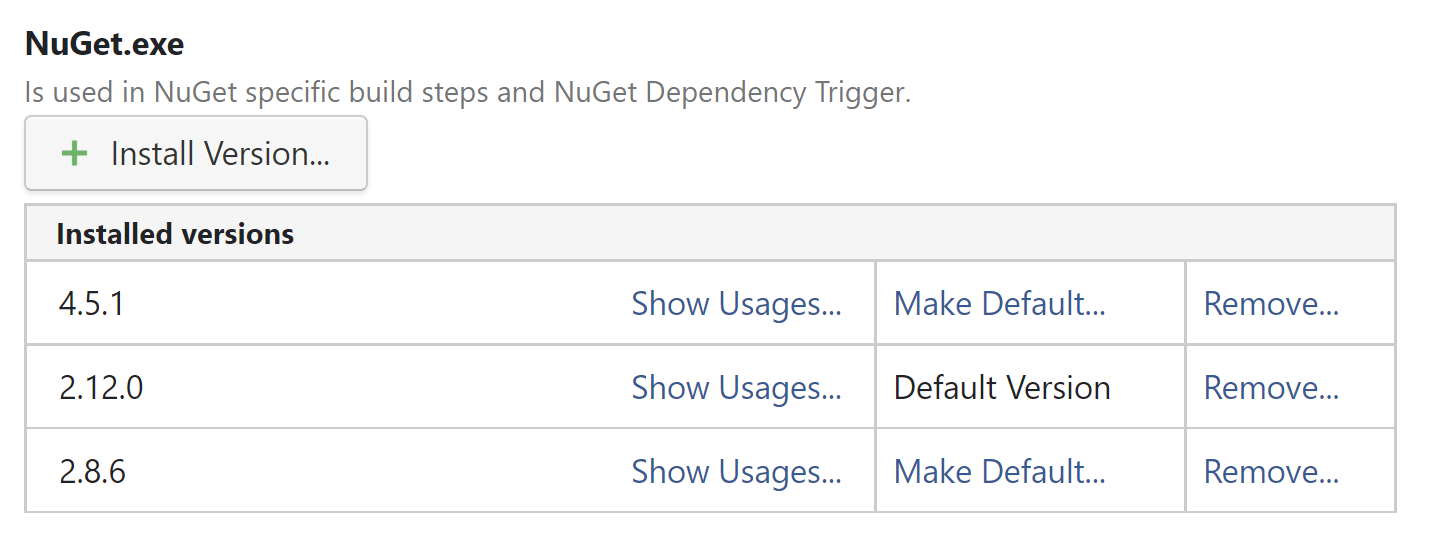
Add a build step, that restores NuGet packages referenced by the solution. Use NuGet Installer as the Runner type.

Add a first build step, that will build the solution and tests. In our particular example, we use the .NET runner (requires the following software to be installed on a build agent), but you have a number of other options on how to build: directly run MSBuild, run batch file, and so on.
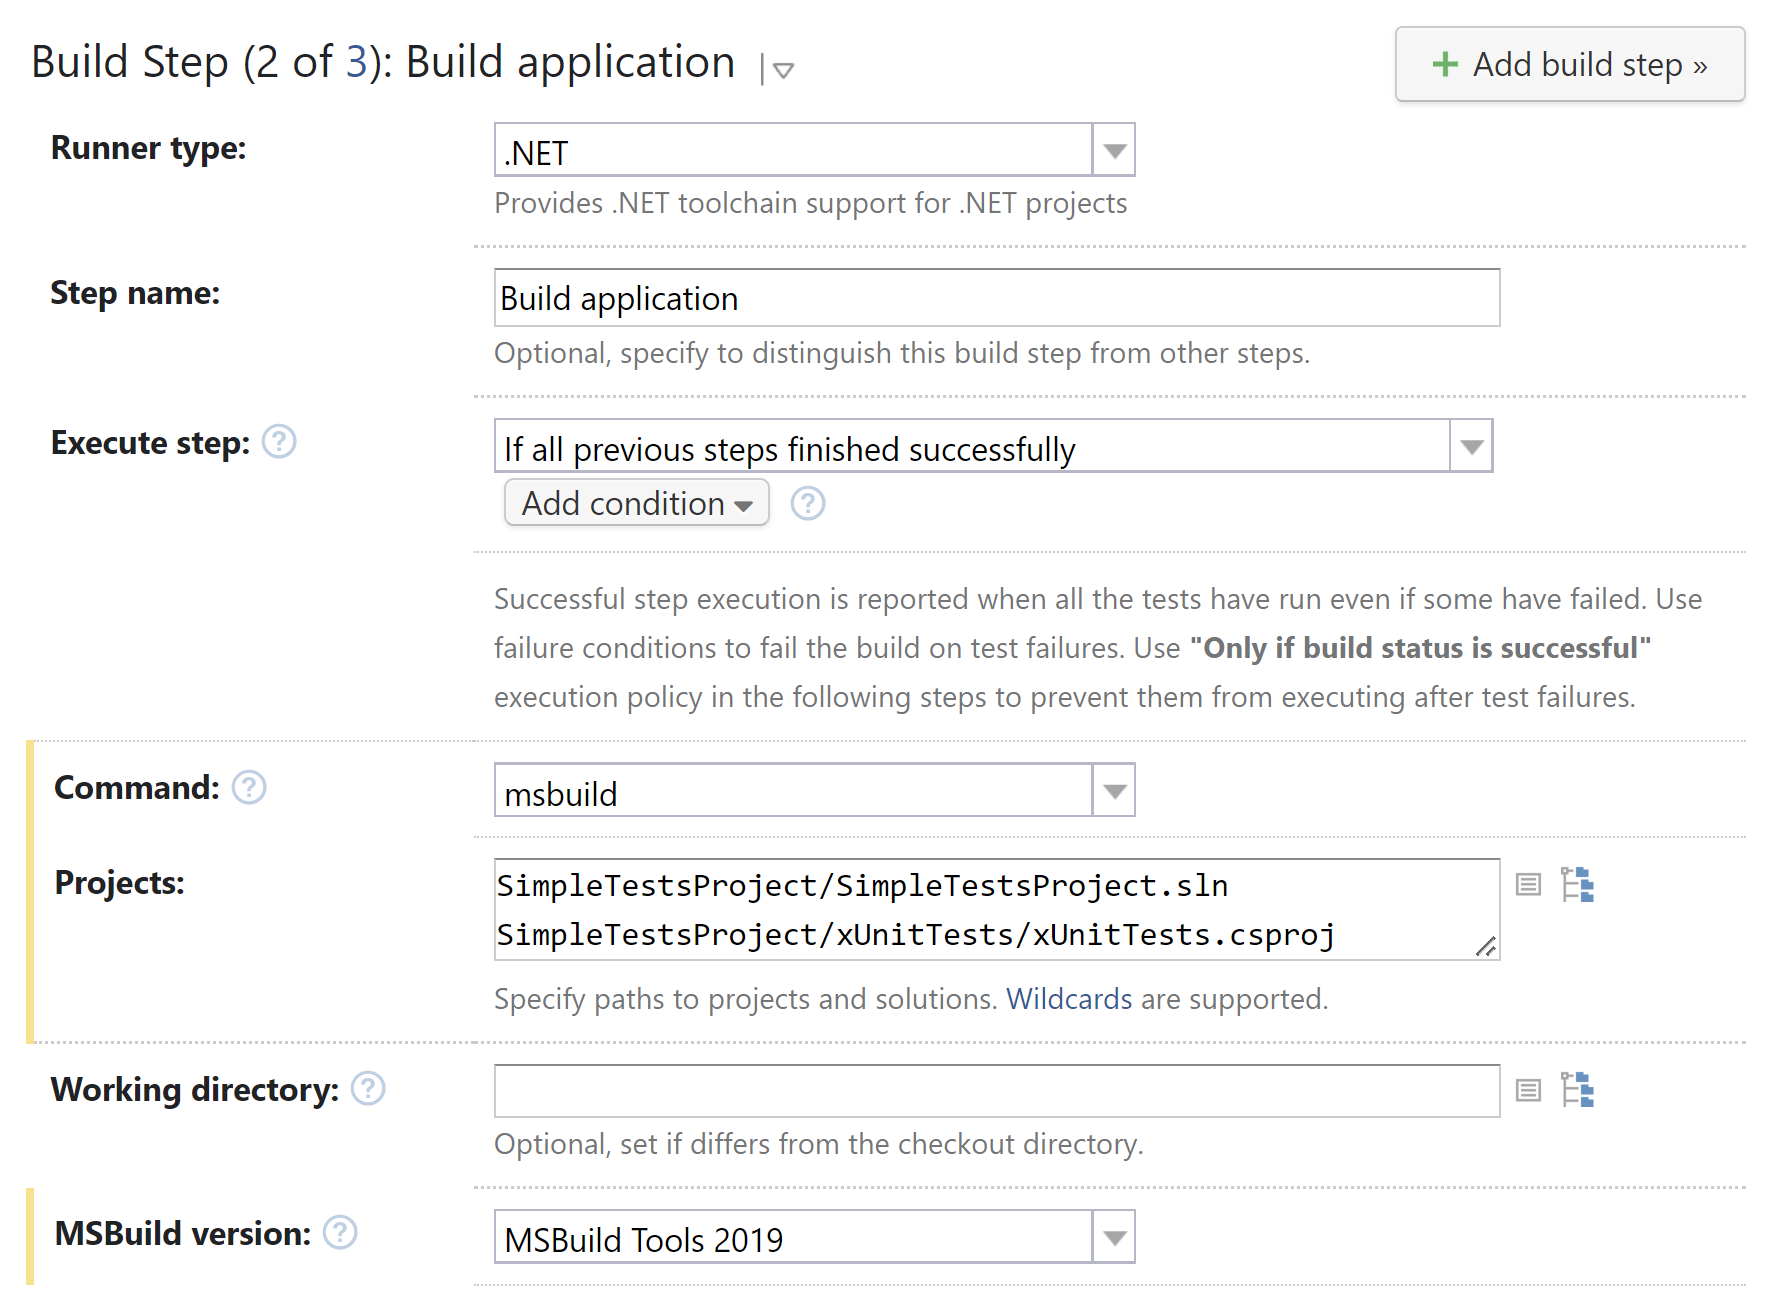
Notice that all we are doing here is building the solution. No coverage settings yet.
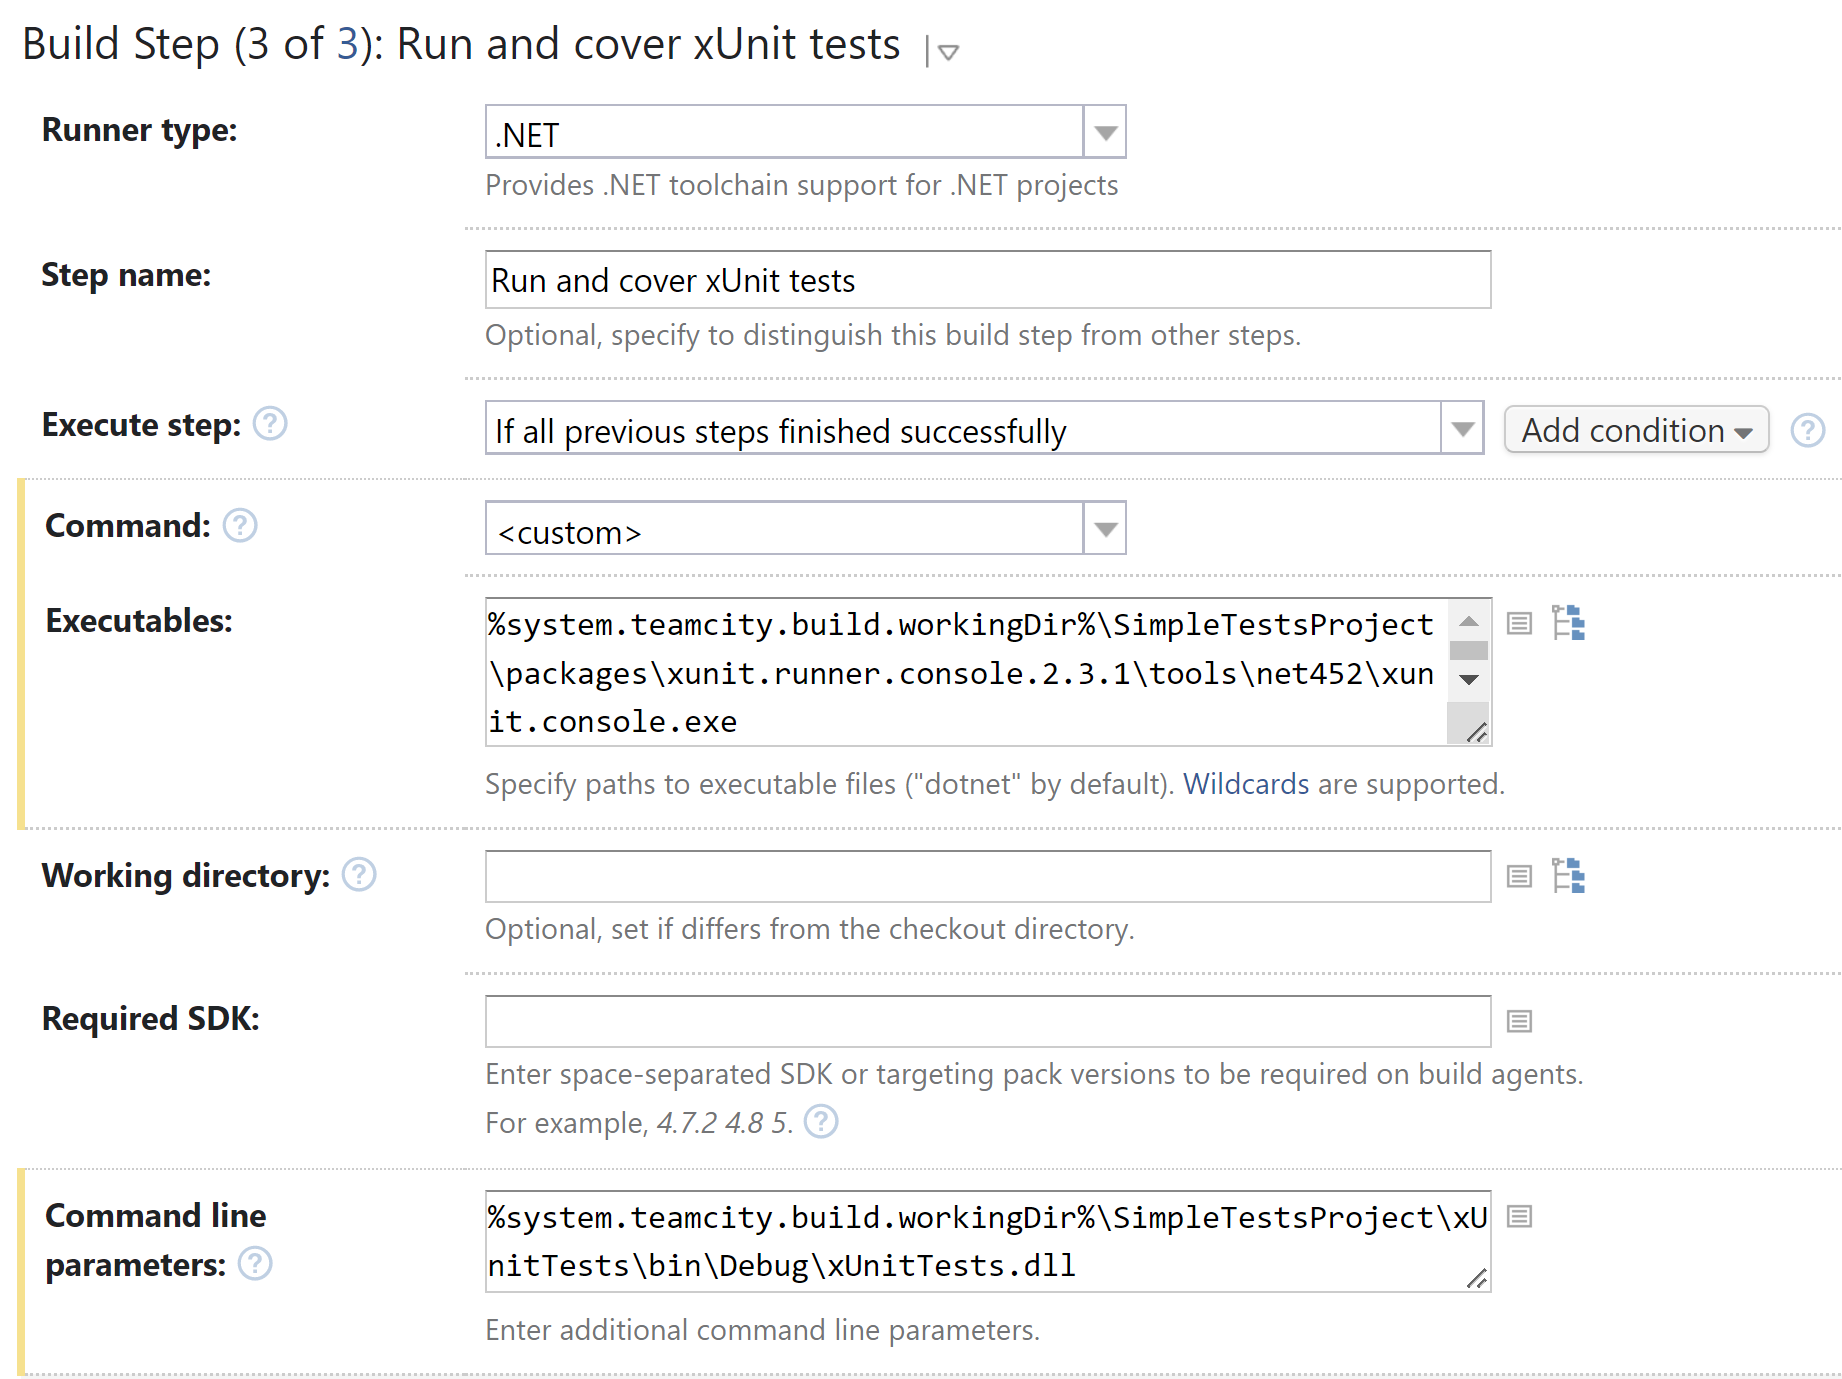
Add a build step that runs the tests:
As the xUnit runner will be executed as a simple .exe file, select the .NET runner.
In the Command, select <custom>.
As the runner is provided as a package inside the solution, you can specify its path relatively to the solution working directory, for example:
%system.teamcity.build.workingDir%\SimpleTestsProject\packages\xunit.runner.console.2.3.1\tools\net452\xunit.console.exeThe Command line parameters field must contain the path to the compiled test assembly.
Now, it's time to set up coverage. In the .NET coverage tool, choose JetBrains dotCover.
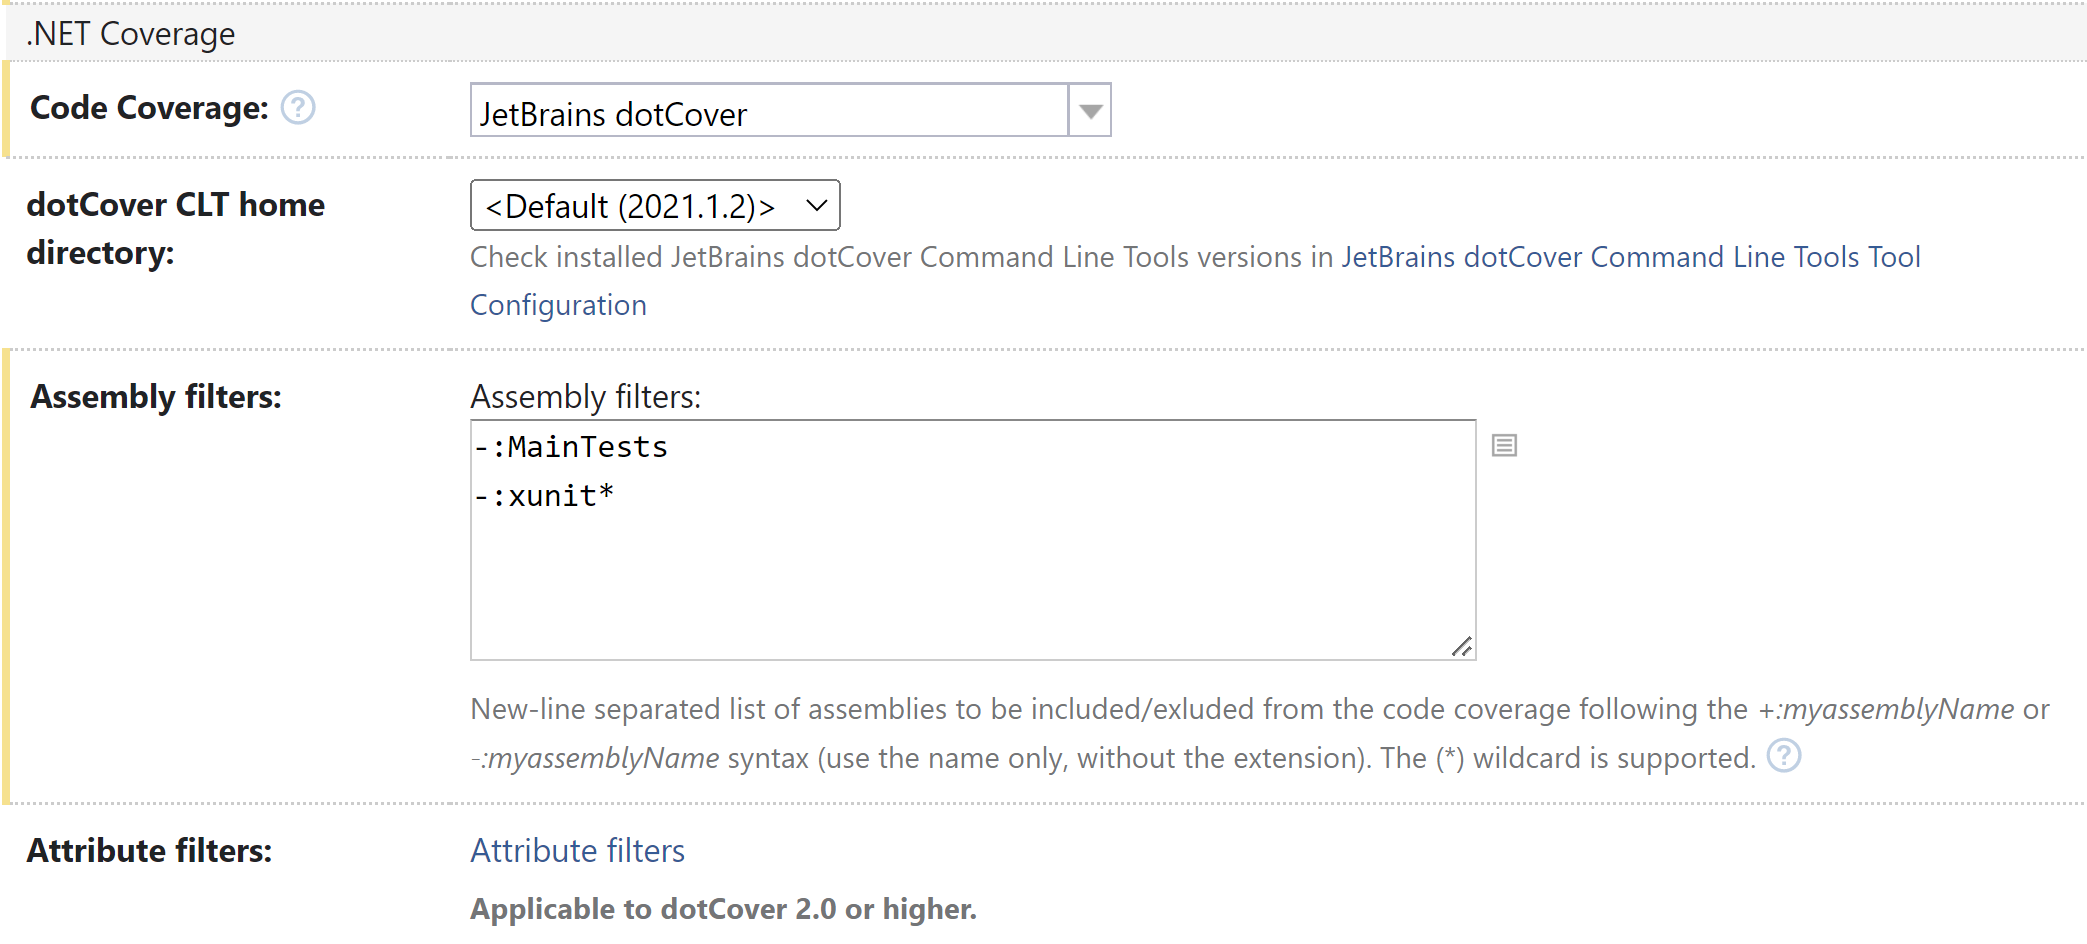
In Assembly Filters, add the assemblies you want coverage for (just the name of the assembly) prefixing them with
+:and filter out those you do not want coverage for with–:. In our example, we exclude theMainTestsassembly that contains running tests and everything related to xUnit assemblies.Save the configuration and run it to see how it works.
Once the build is finished, the Overview tab will contain a short report on test results and code coverage.
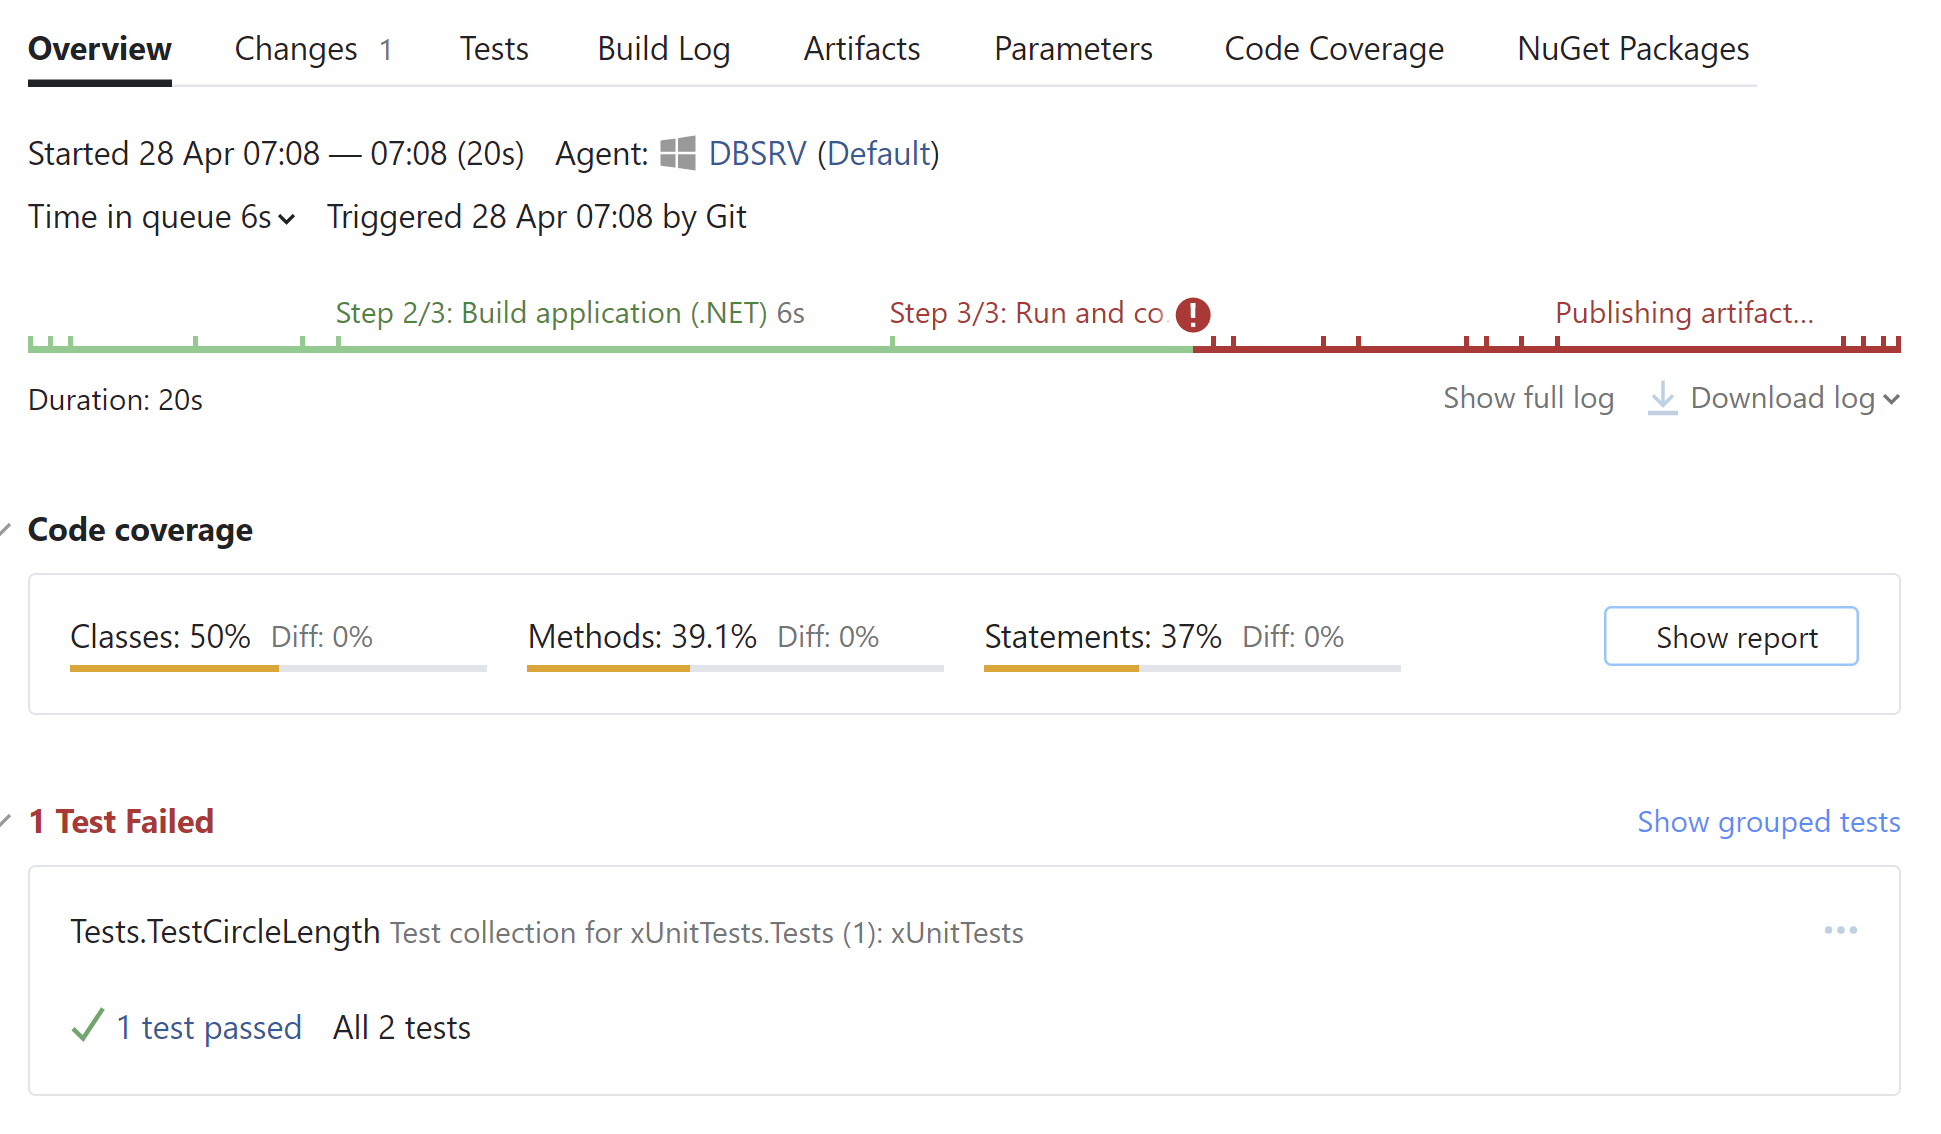
To see the details, switch to the Code Coverage tab. Here you can view the detailed statistics on how much of class/methods do the tests cover.
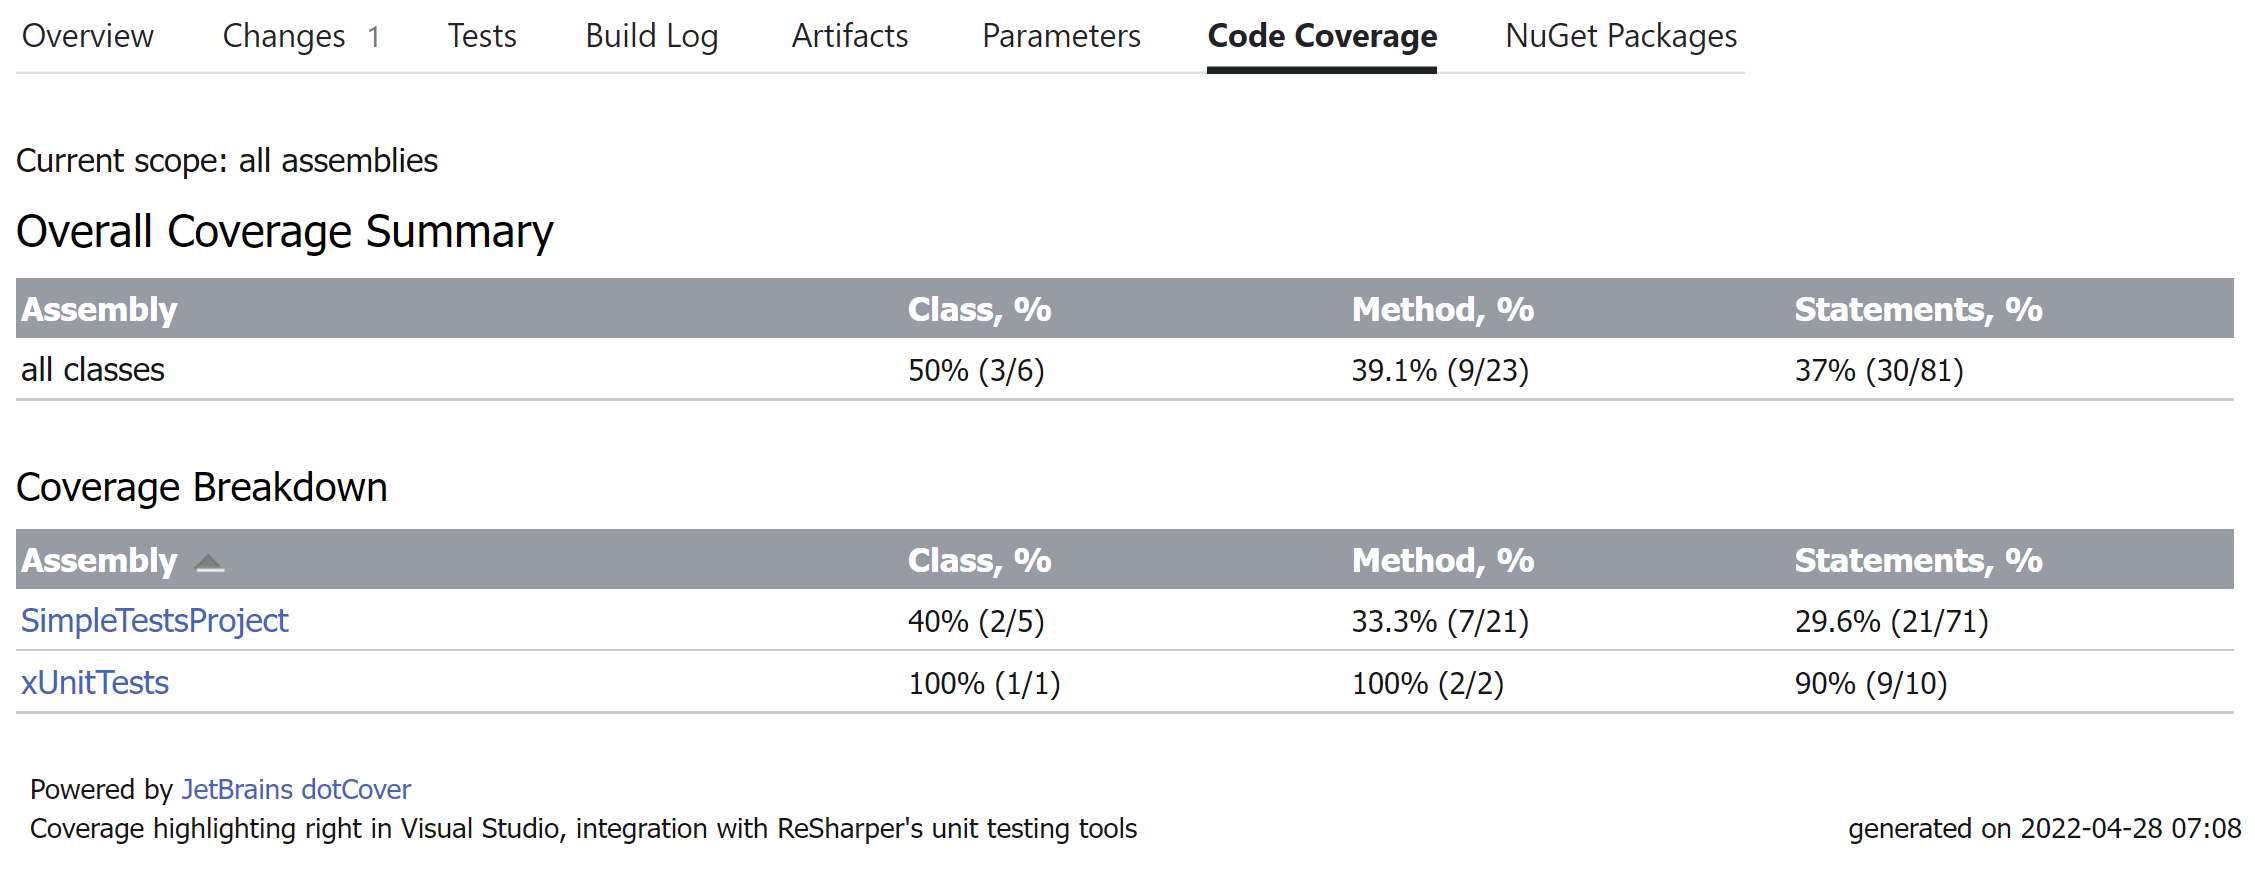
Or even drill down into individual classes and examine the code coverage.

Build artifacts now contain coverage files zipped up.
MSpec
MSpec is partly supported by TeamCity out of the box: it has a corresponding build step runner, but MSpec test runner is not in the bundle and must be installed to TeamCity agents manually. Fortunately, the runner is distributed as a NuGet package, so, it can be referenced right in your solution and then restored during a build.
Set up coverage analysis of MSpec tests in TeamCity
In Visual Studio, open your solution. In the test project, add a reference to the
Machine.Specifications.Runner.ConsoleNuGet package.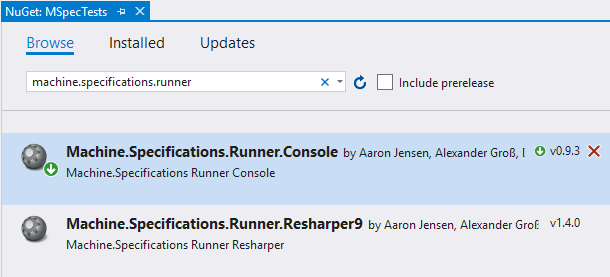
In TeamCity, create a new build project and setup the VCS root. Then add a new Build Step: Create a new project and a new build configuration inside the project.
Make sure that TeamCity is configured as a NuGet server: in find the NuGet.exe table and check whether it contains the required NuGet version. If there is no such a table, add the NuGet to TeamCity by clicking the Install Tool... button and following the required steps.

Add a build step, that restores NuGet packages referenced by the solution. Use NuGet Installer as the Runner type.

Add a first build step, that will build the solution and tests. In our particular example, we use the .NET runner (requires the following software to be installed on a build agent), but you have a number of other options on how to build: directly run MSBuild, run batch file, and so on.

Notice that all we are doing here is building the solution. No coverage settings yet.
Add a build step that runs the tests:
Select MSpec in the Runner type.
As the runner is provided as a package inside the solution, you can specify its path relatively to the solution working directory, for example:
%system.teamcity.build.workingDir%\SimpleTestsProject\packages\Machine.Specifications.Runner.Console.0.9.3\tools\mspec-clr4.exeMake sure you use the runner version that corresponds the project's targeted .NET Framework version.
In Run tests from, specify the path to the compiled test assembly.
If needed, specify what specifications must be included/excluded in Include specifications and Exclude specifications.

Now, it's time to set up coverage. In the .NET coverage tool, choose JetBrains dotCover.
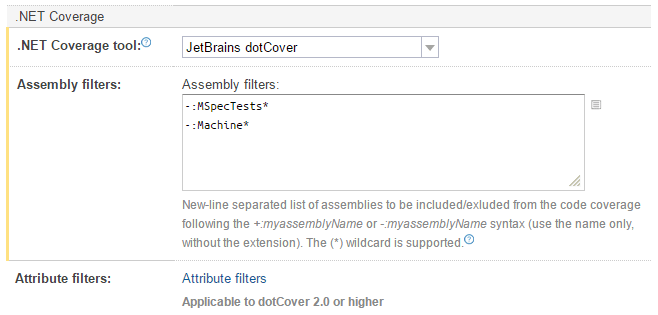
In Assembly Filters, add the assemblies you want coverage for (just the name of the assembly) prefixing them with
+:and filter out those you do not want coverage for with–:. In our example, we exclude theMSpecTestsassembly that contains running tests and everything related to MSpec assemblies.Save the configuration and run it to see how it works.
Once the build is finished, the Overview tab will contain a short report on test results and code coverage.
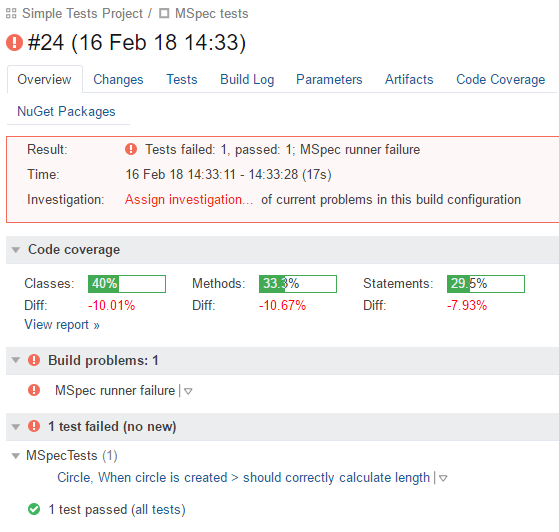
To see the details, switch to the Code Coverage tab. Here you can view the detailed statistics on how much of class/methods were covered by tests.
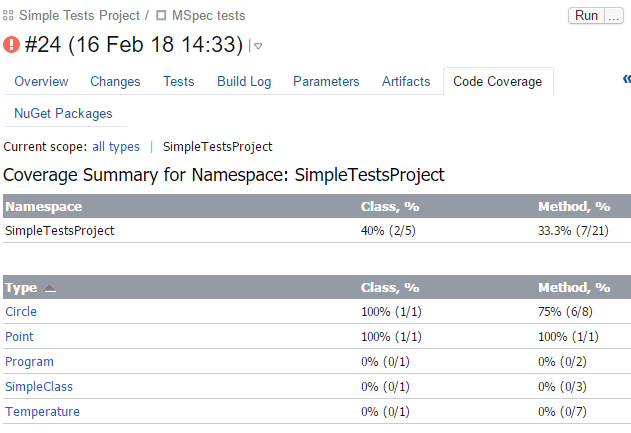
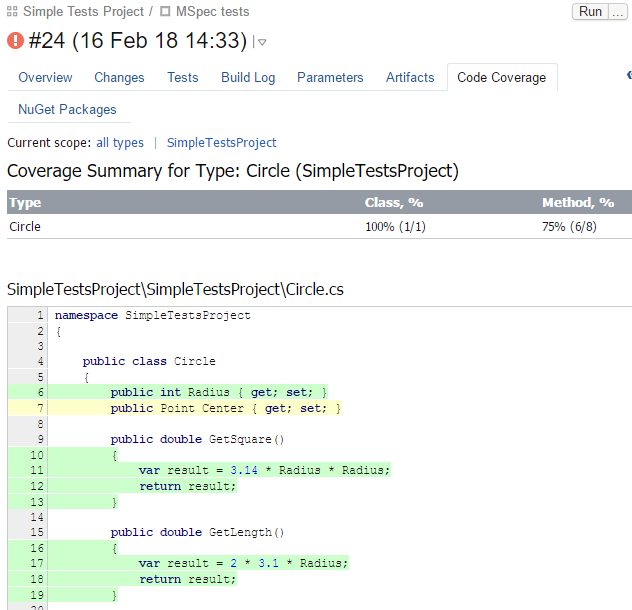
Or even drill down into individual classes and examine the code coverage.
Build artifacts now contain coverage files zipped up.