Control Profiling Session
After you run the profiling session, dotMemory will open the new Analysis tab and launch the profiled application.

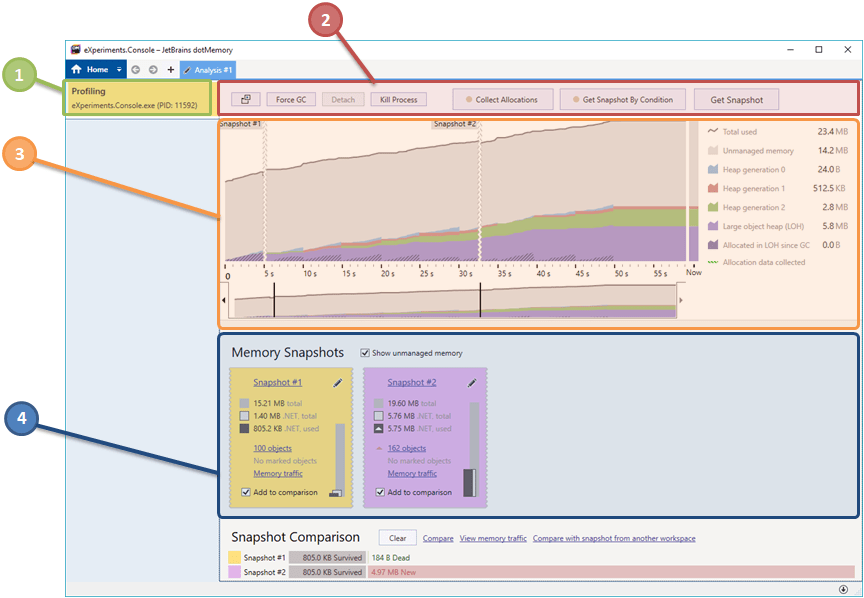
To control the profiling process, use the following buttons on the top of the page ![]() :
:
| Force GC | Forces full garbage collection in the application. |
| Kill Process | Kills the currently selected process of the application.
|
| Kill All Processes | Kills all processes of the application. The list of processes and the Kill All Processes button are shown only in case you profile the app running multiple processes. |
| Detach | Detaches the profiler from the application but keeps the application running. The Detach operation is available only in case you attach the profiler to an already running app. |
| Collect Allocations | Enables and disables collecting memory allocation data. Use this option to reduce the profiler overhead and collect allocation data only when it is needed (for example, only when working with app functionality you want to profile). Note that memory traffic data will be incomplete in case you turn off collecting allocations at least once during the profiling. Learn more in Analyze Memory Traffic. |
| Get Snapshot by Condition | Opens the Get Snapshot by Condition window. Using this window, you can configure dotMemory to automatically get snapshots when a particular condition takes place. Learn more in Getting snapshots by condition. |
| Get Snapshot | Gets a memory snapshot for the process selected in the list of processes Getting a snapshot does not interrupt the profiling process, allowing you to get another snapshot (which, for example, can be compared with the first one later). After you finish capturing snapshots, you can proceed to analyzing profiling results. |
Profiling multi-process applications
If your standalone or .NET Core application runs more than one process, you can take a memory snapshot of a particular process.
To get a snapshot of a particular process
Start profiling with a process filter that allows profiling of the entire process tree, for example, you can select the predefined Entire process tree filter.
After the profiling session starts, select the desired process from the list
 .
.Click Get Snapshot.
Viewing real-time profiling data
The timeline graph ![]() shows how your app consumes memory in real time. The timeline consists of a number of charts showing:
shows how your app consumes memory in real time. The timeline consists of a number of charts showing:
Unmanaged memory: an instant size of unmanaged memory. To add this chart, select the Show unmanaged memory checkbox in
 .
.Heap generation 0, 1, 2, Large Object Heap (LOH): instant sizes of Gen0, Gen1, Gen2 heaps and Large Object Heap.
Allocated in LOH since GC: an instant size of objects that have been allocated to Large Object Heap since the last Garbage Collection (after each GC, the chart restarts from zero). Use this chart to understand when LOH allocations happen (on application startup, during some work, and so on) and how intense they are (for example, the app can have some significant LOH memory traffic that doesn't change the LOH size).
Showing profiling controls in a separate window
You can detach the profiling controls to a separate Profiling Controller window by clicking the ![]() button in
button in ![]() . The controller window is always shown on top of other windows, which is especially helpful on desktops with only one monitor.
. The controller window is always shown on top of other windows, which is especially helpful on desktops with only one monitor.
Getting snapshots by condition
Sometimes you may be interested in taking snapshots only when a certain condition takes place. The most popular case is taking a snapshot when the memory consumption of your application is dramatically increased. As doing this manually (using the Get Snapshot button) is quite tricky, dotMemory allows you to automate this process. All you need is to set a particular condition and snapshots will be collected automatically after the condition takes place. Currently, the following conditions are supported:
Memory consumption increase in MB.
Memory consumption increase in %.
Period of time in minutes (periodical taking of snapshots).
For a more thorough control over snapshot taking conditions (for example, taking a snapshot at a specific execution point of your program), use the dotMemory API.
note
* Total memory (includes unmanaged memory even if the Show unmanaged memory checkbox is cleared).
To enable collecting snapshots by condition
After the profiling session is started, click the Get Snapshot by Condition button in profiling controls.
Select desired conditions in the Automatically get a snapshot section and specify particular values for them:
if memory consumption increases by [X] MB- automatically get a snapshot when memory consumption* exceeds the baseline by X MB. The first baseline is a memory consumption on the moment when you click the Start button in the Get Snapshot by Condition window. After the condition takes place, dotMemory gets a snapshot and the memory consumption in that moment becomes a new baseline.
if memory consumption increases by [X] %- automatically get a snapshot when memory consumption exceeds the baseline by X percent. The first baseline is a memory consumption on the moment when you click the Start button in the Get Snapshot by Condition window. After the condition takes place, dotMemory gets a snapshot and the memory consumption in that moment becomes a new baseline.
if memory consumption exceeds [X] MB- automatically get a snapshot when total memory consumption (absolute value) exceeds X MB.
every [X] minutes- automatically get a snapshot every X minutes.
Select the Limit the max number of snapshots to [X] checkbox if you want dotMemory to take no more than X snapshots. This option can be useful if you are limited on the disk space.
Click Start.
To disable collecting snapshots by condition
Click the Get Snapshot by Condition button in profiling controls.
Click Stop.