Reporting performance issues
Ensure that the Performance Testing plugin is installed and enabled
To figure out what is causing a performance issue, you have to collect and submit certain troubleshooting materials to the JetBrains support team. The type of the troubleshooting material depends on the issue that you experience.
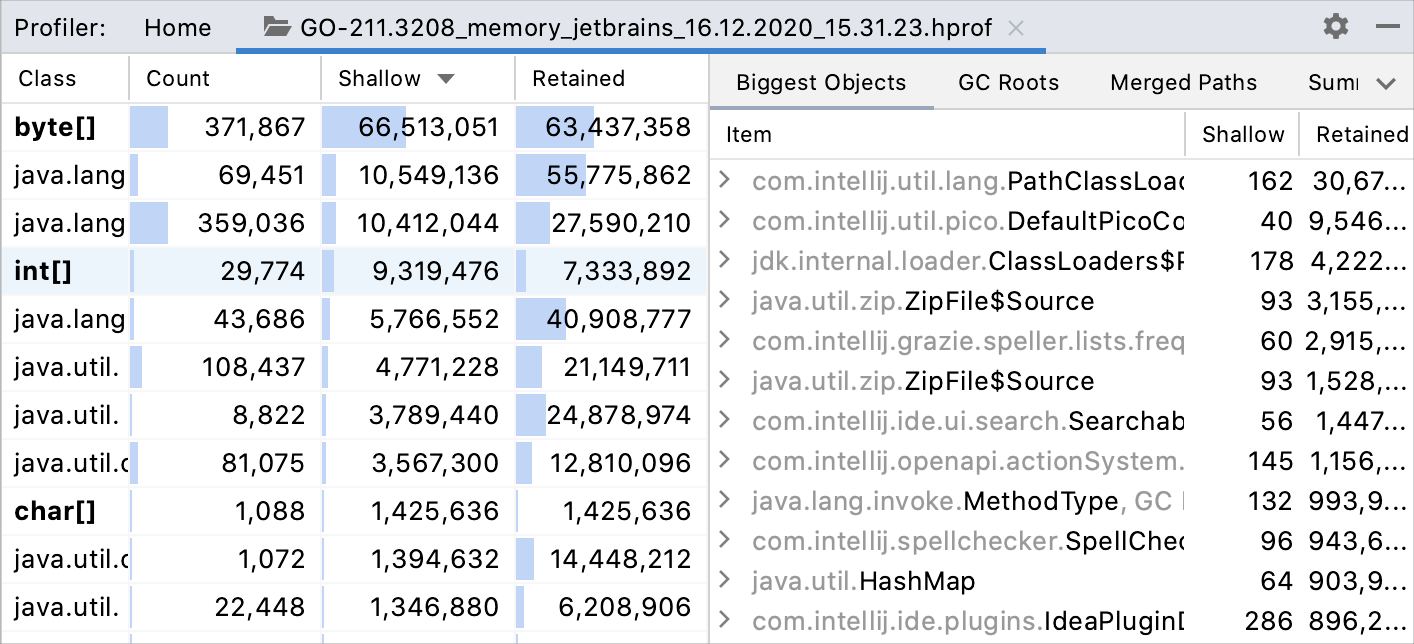
You can review the information that is included in the generated HPROF and SNAPSHOT files by using any Java profiler (for example, YourKit). To review HPROF files, you can also use the profiler of Intellij IDEA Ultimate (Run | Open Profiler Snapshot | Open) .
The following situations might take place:
The IDE does not respond: the application hangs and does not respond to any action for a long time.
High CPU usage: the application is working but your performance monitoring utility shows that the application CPU usage is high.
High memory consumption or a memory leak: the application is working, but your performance monitoring utility shows that the application memory consumption is high.
Slow indexing: the indexing process became slower or cannot be finished.
Slow startup: the startup process takes a lot of time.
Slow or incorrect introspection: a retrieval of database objects is
The IDE does not respond
When GoLand does not respond, consider creating a thread dump file. A dump file must be created at the moment when the IDE does not respond and include the thread stack. Recording several thread dumps with 1-2 seconds interval might be very useful for the problem analysis.
After you have created a dump thread file, archive it, and upload it to share with the JetBrains support team. Read upload instructions in the Upload snapshots section.
You can create thread dumps by using the following options:
Using jstack
The jstack command-line utility prints Java stack traces of Java threads. The utility is provided with the JDK installation and can be found in the JAVA_HOME\bin directory.
Ensure that the utility has the same JDK version as GoLand. For example, the 64-bit JDK distribution of the utility will not work for the IDE that runs under the 32-bit JDK distribution. To check the JDK version, press Ctrl+Shift+A, type About, and press Enter.

Create thread dumps by using jstack
Open the command prompt.
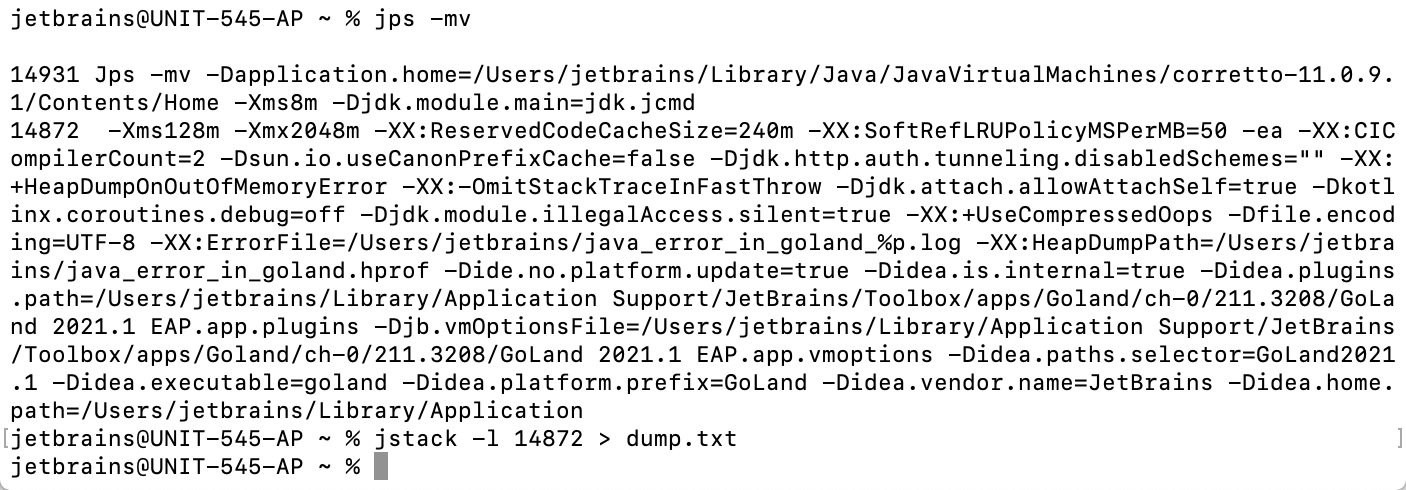
List Java processes that run on your system with their command-line options. Type the following command and press Enter.
jps -mvRun jstack with the IDE process identifier (PID). Type the following command and press Enter.
jstack -l <PID> > dump.txtThis command prints the thread dump into a file.
Automatic thread dumps
GoLand runs a thread that detects when UI does not respond for a certain time and writes automatic thread dumps into the log directory. To find the log directory, click Help | Show Log in <file_browser>. You will find several folders with the name like threadDumps-freeze-20201215-083644-GO-211.3076. Zip these folders and attach them to your ticket.
Thread dump from the console
Depending on your operating system, you can create a thread dump without the jstack utility.
macOS
Navigate to the goland file in IDE_HOME
/GoLand.app ./Contents /MacOS/ Depending on how you installed your IDE, IDE_HOME might be
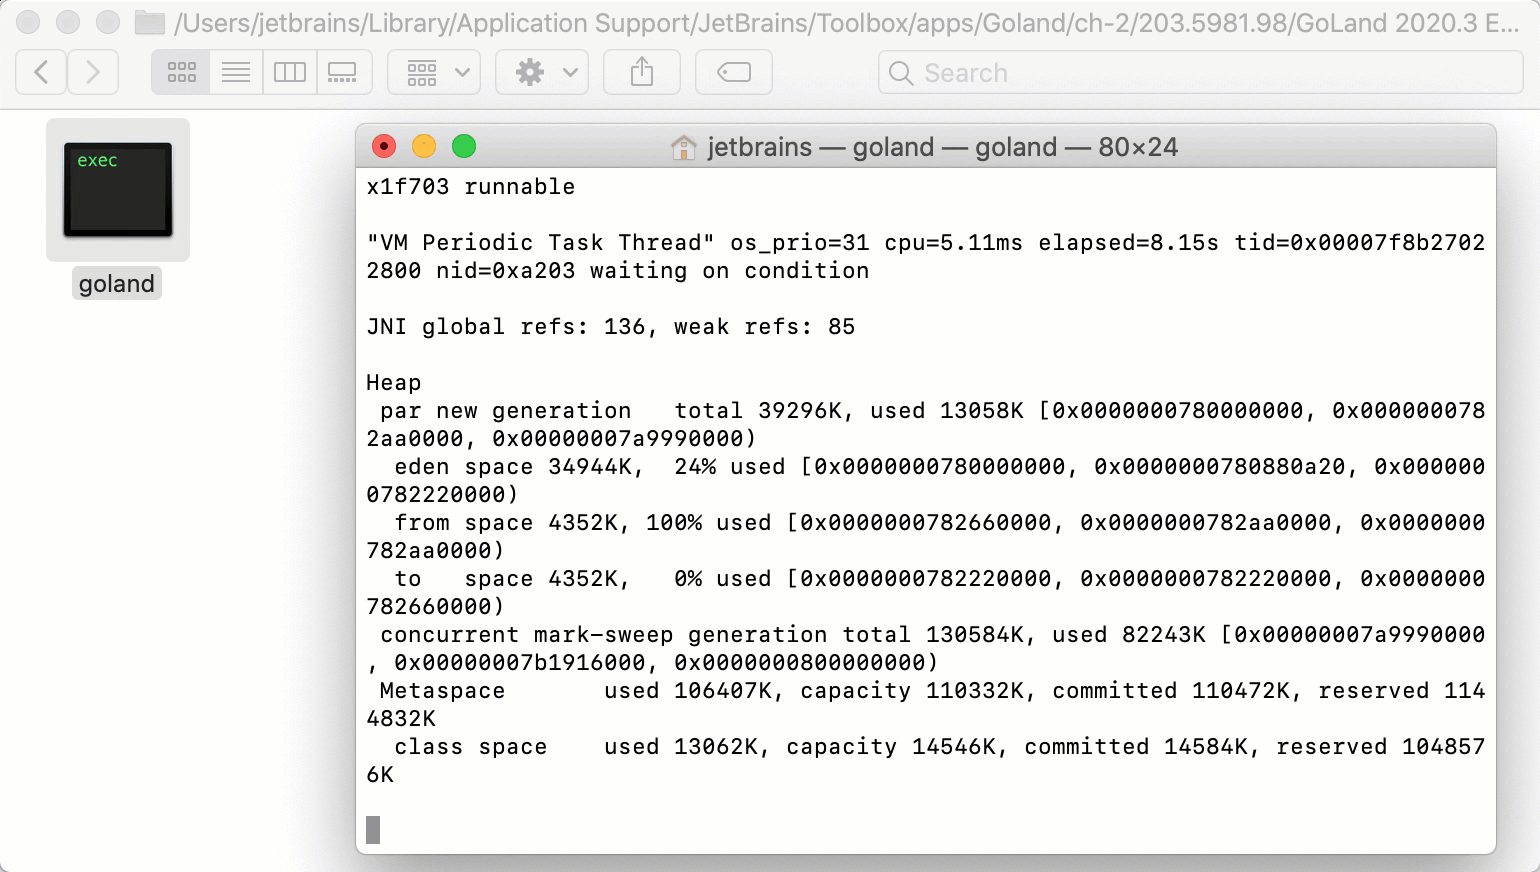
/Applications/ (standalone installation) or ~/Library (Toolbox installation)./Application Support /JetBrains /Toolbox /apps /goland /ch-2 /203.5981.102/ Right-click the goland file and select Open with | Terminal.
Press ^\. The terminal will print a thread dump. To complete the process, press ^C.
 Gif
Gif
Microsoft Windows
Open the command prompt.
By using the
cdcommand, navigate to the goland.bat file in the bin directory inside your IDE installation directory.Depending on how you installed your IDE, the installation directory might be C:
\Program Files (standalone installation) or C:\JetBrains \GoLand 2020.3\ \Users (Toolbox installation).\User \AppData \Local \JetBrains \Toolbox \apps \goland \ch-1 \211.3208\ Run the goland.bat file.
goland.bat > output.txtPress Ctrl+Break. The terminal will print a thread dump. To complete the process, press Ctrl+C.
Unix
Run the goland.sh file in the bin directory inside your IDE installation directory.
Depending on how you installed your IDE, the installation directory might be any directory that you have chosen (standalone installation) or ~
/.local (Toolbox installation)./share /JetBrains /Toolbox /apps /GoLand /ch-0 /211.3208 By using a process manager (for example,
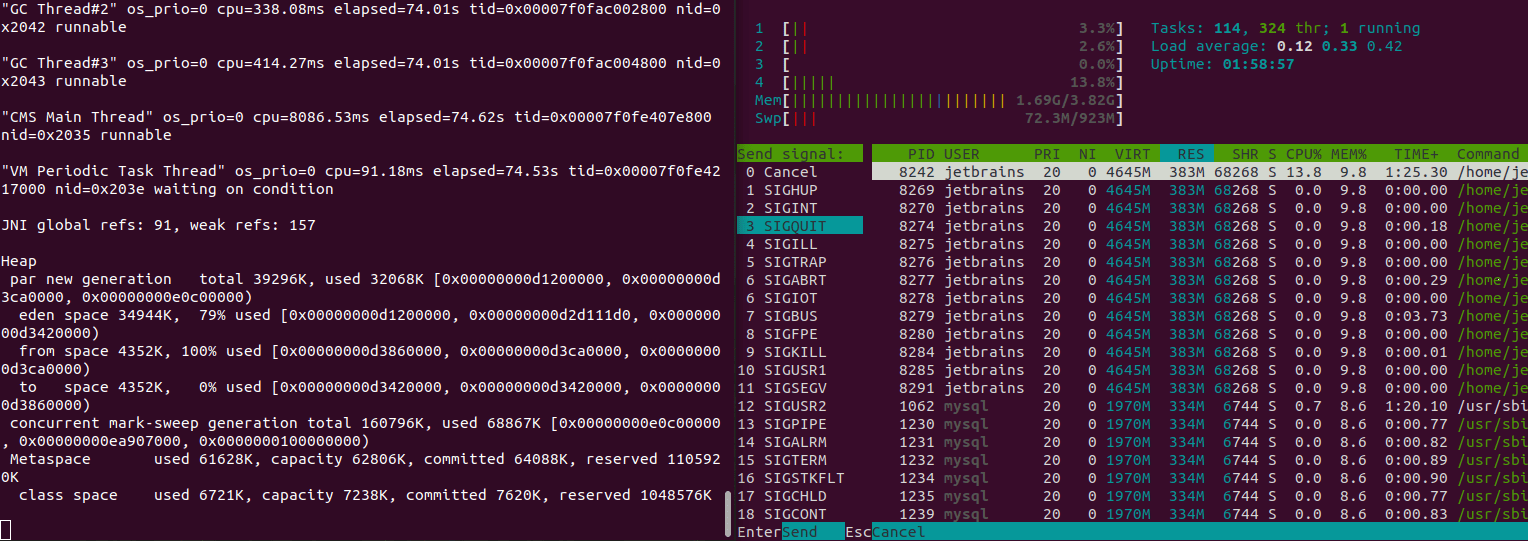
ps,htop,jps), get the process ID (PID).Run the following command or send the SIGQUIT signal to the process. A thread dump will be printed in the terminal window.
High CPU usage
If you can continue working with the IDE, but the IDE hangs, repeatedly stops responding, displays you warnings about memory consumption, try to close large files (for example, SQL files with thousands of rows), and restart the IDE.
Otherwise, capture the CPU snapshot and IDE logs and send them to the JetBrains support team.
Start CPU usage profiling
Click Help | Diagnostic Tools | Start CPU Usage Profiling.
GoLand might ask you to restart IDE to add necessary VM options. If you see this notification, restart the IDE and start the CPU usage profiling again.
Perform the actions that cause performance issues. Try to reproduce the performance problem several times while the snapshot is being recorded.
Click Help | Diagnostic Tools | Stop CPU Usage Profiling.
GoLand saves the snapshot file in the user home directory. If you do not see the notification, enable balloon notifications for Profiling in settings. Open settings by pressing Ctrl+Alt+S and navigate to Appearance & Behavior | Notifications. In the list of components, find Profiling and ensure that the Popup type is Balloon.
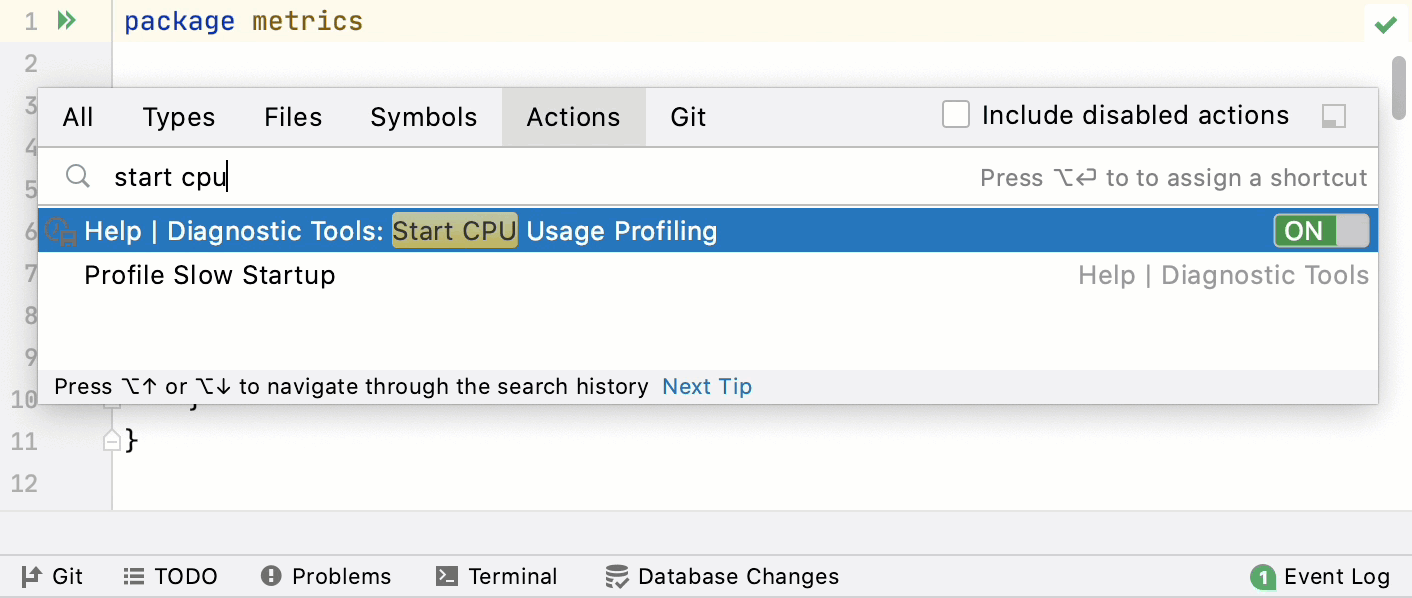 Gif
Gif
High memory consumption or a memory leak
The Java Virtual Machine (JVM) running GoLand allocates some predefined amount of memory. The default value depends on the platform. If you are experiencing slowdowns, you may want to increase the memory heap.
From the main menu, select Help | Change Memory Settings.
Set the necessary amount of memory that you want to allocate and click Save and Restart.
This action changes the value of the -Xmx option used by the JVM and restarts GoLand with the new setting.
note
The Change Memory Settings action is available starting from GoLand version 2019.2. For previous versions or if the IDE crashes, you can change the value of the
-Xmxoption manually as described in JVM options.
GoLand also warns you if the amount of free heap memory after a garbage collection is less than 5% of the maximum heap size:

Click Configure to increase the amount of memory allocated by the JVM. If you are not sure what would be a good value, use the one suggested by GoLand.
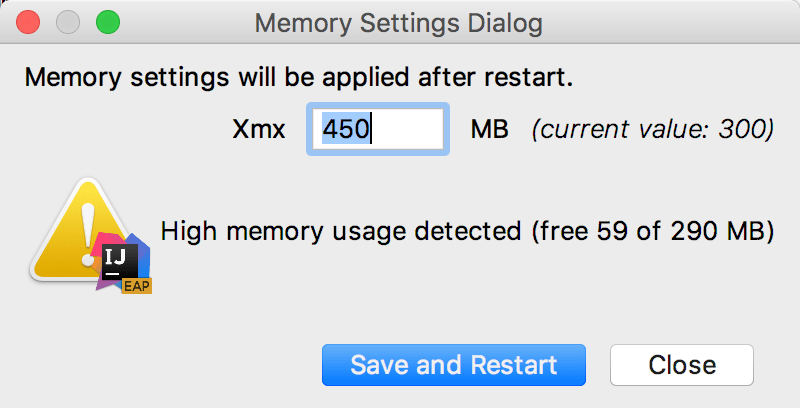
Click Save and Restart and wait for GoLand to restart with the new memory heap setting.
If these settings do not fix the problem, capture a memory snapshot, and send it to the JetBrains support team.
Capture a memory snapshot
Click Help | Diagnostic Tools | Capture Memory Snapshot.
Alternatively, press Ctrl+Shift+A, type
capture memory, and select Capture Memory Snapshot.Wait until the HPROF snapshot is built. You can navigate to it from the notification balloon.
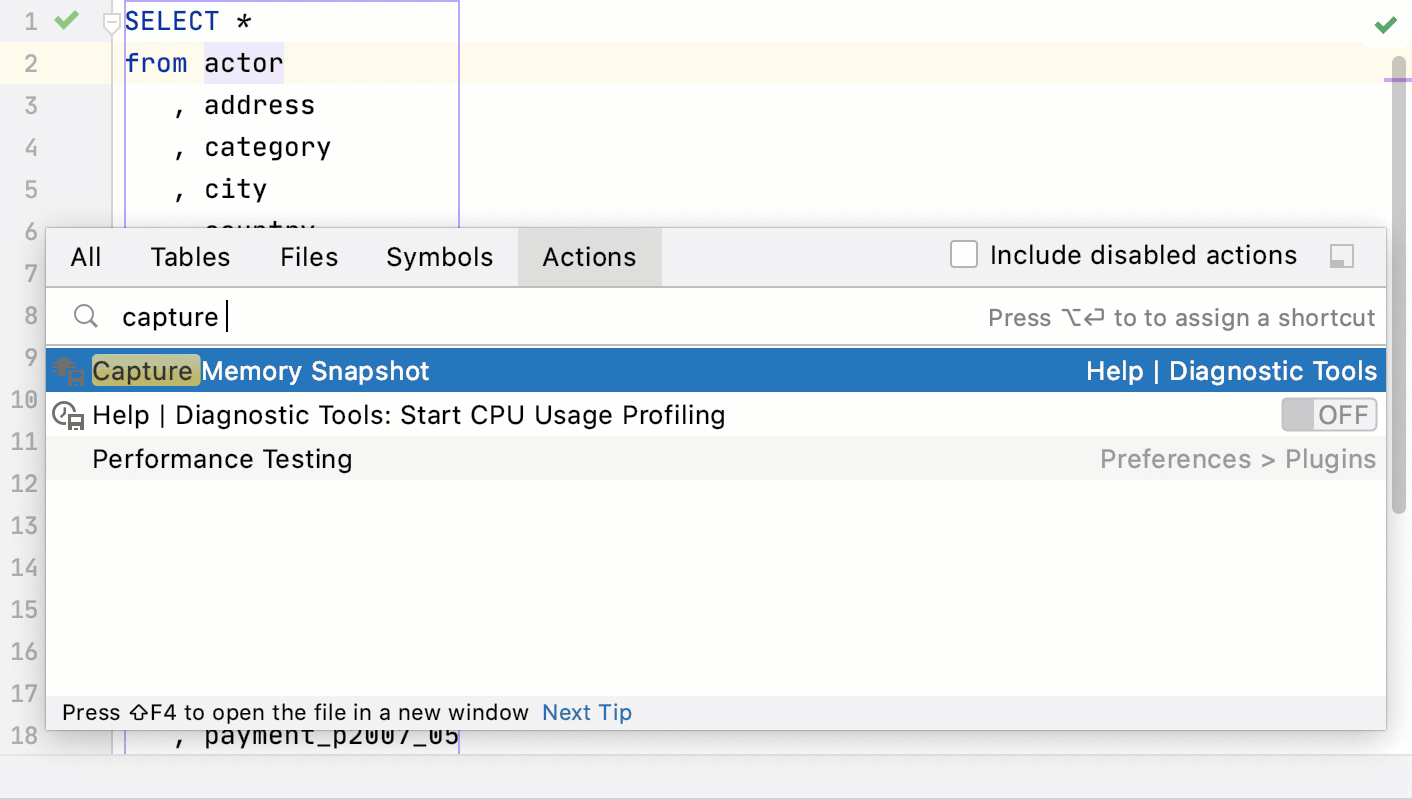 Gif
Gif
You can capture memory snapshots automatically when the IDE runs out of memory.
Capture memory snapshots automatically
Click Help | Edit Custom VM Options.
In the VMOPTIONS file, add the following lines:
-XX:+HeapDumpOnOutOfMemoryError
-XX:HeapDumpPath=$USER_HOME/java_error_in_goland.hprof
According to the
HeapDumpPathparameter, the HPROF file will be created in the user directory. Alternatively, specify any other directory that has read-write access.
Slow indexing
note
This action is available in GoLand 2019.2 and later.
If the indexing process does not stop, run the CPU usage profiling.
Profile the indexing process
Click Help | Diagnostic Tools | Profile Indexing.
Click Invalidate and Restart.
Wait until GoLand loads and indexes project files.
Click the Open Snapshot In link to locate the snapshot.
Slow startup
Create a snapshot and share it with the JetBrains support team.
Click Help | Diagnostic Tools | Profile Slow Startup.
In the The Next Startup Will Be Profiled window, click Restart.
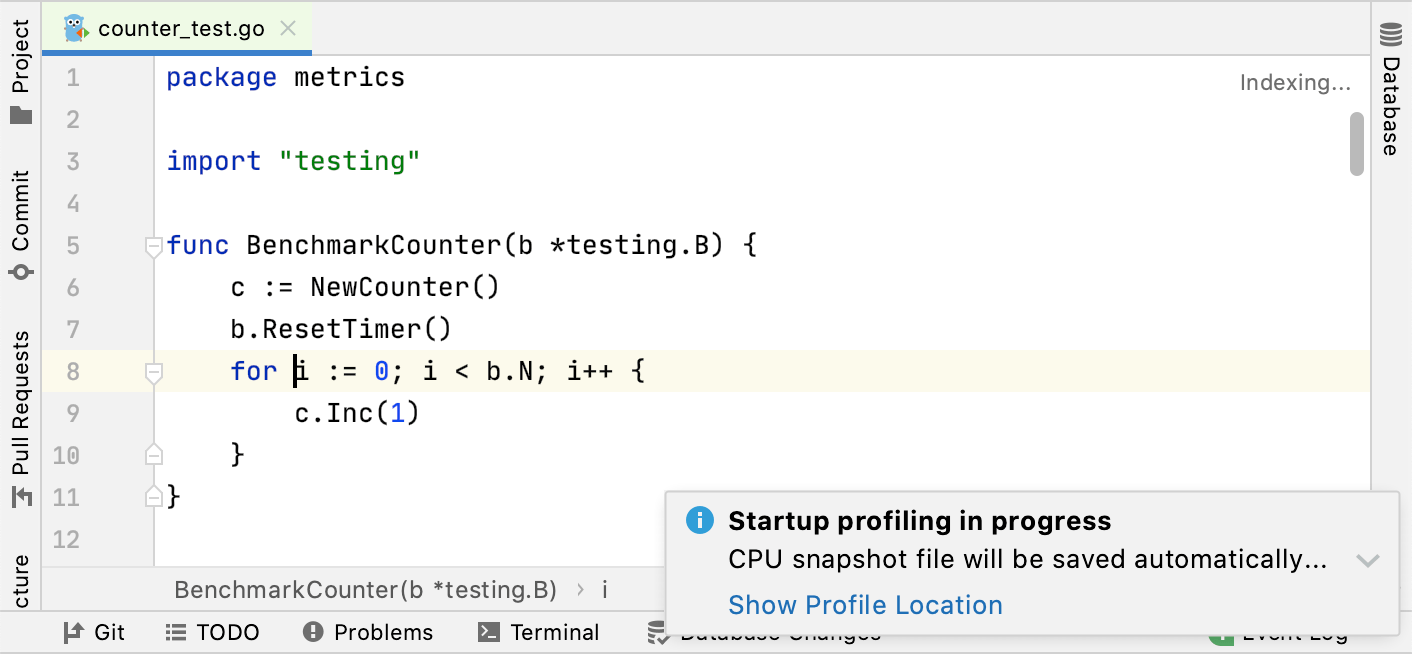
In the Startup profiling in progress window, click Show Profile Location.
When you close the IDE, the SNAPSHOT file will appear in the Snapshots directory.
Slow or incorrect introspection
Introspection is the process during which the IDE retrieves information about a database. This information is used to show the objects in the database explorer, display their DDL, suggest them during completion, and in other features for code assistance.
Sometimes introspection runs into problems. For example, it might take much longer time to introspect a database, or some objects that exist in the database do not show up in the Database tool window. In these cases, try to use the following menu items to collect troubleshooting data and pass it on to our support team.
As you collected all the needed troubleshooting materials, consider passing them on to our support team.
Collect information by using Diagnostic tools
Right-click a data source and navigate to Diagnostics. Select between the following options:
Dump Model: generates a GoLand-specific representation of the database structure (a database model). You can include automatically generated content by clicking the Include auto-generated content icon.
Diagnostic Refresh: reloads the metadata from the database and generates a LOG file. This information might be helpful for the support team when you think that your introspection is slow.

Prepare Introspector Diagnostics: generates three files that include information about the data source (dataSource.txt), a module that was used to load the metadata from the database (introspector.txt), and a part of the database model (model.xml).
This information might be helpful when introspection works incorrectly. For example, when you see something outdated or do not see new objects.
The following screenshot shows the example output of these three files.
Upload snapshots
If your snapshot is smaller than 10 MB, you can attach it directly to support tickets or YouTrack issues.
For files larger than 10 MB, use the JetBrains Uploads Service. After the upload is successful, share the Upload ID in the related support case or the Youtrack issue. For more information about getting help, see Getting help.
Consider archiving large or multiple files before uploading. If your upload speed is slow, split large archives into smaller parts.
Reporting your problem
To report an issue, you can use any option that is described in the Where to report an issue section. But we recommend using the JetBrains Support Center.
Submit a request in the JetBrains Support Center
Click Help | Contact Support.
Fill in the Submit a request form.
If it is possible, attach some troubleshooting materials.
Click Submit.