Read the profiling report
Navigate the report
Flame Graph

When you read the flame graph, focus on the widest blocks. These blocks are the methods that are presented in the profile most. You can start from the bottom and move up, following the code flow from parent to child methods, or use the opposite direction to explore the top blocks that show the functions running directly on the CPU. In this case, you can use the ![]() option change the graph view.
option change the graph view.
Zoom the graph
Use the
 and
and  options to zoom the graph.
To focus on a specific method, double-click the corresponding block on the graph.
To restore the original size of the graph, click 1:1.
Search the graph
If you want to locate a specific method on the graph, start typing its name or click
 and type the name in the search bar.
The graph highlights all blocks with method names matching your search request.
Use
 and
and  for fast navigation between search results. You can also search either in the whole graph or just in a specific subtree.

Capture the graph
Click
 and select Copy to Clipboard or click Save to export the graph as an image in the .png format.
tip
For more information about flame graphs, see Flame Graphs.
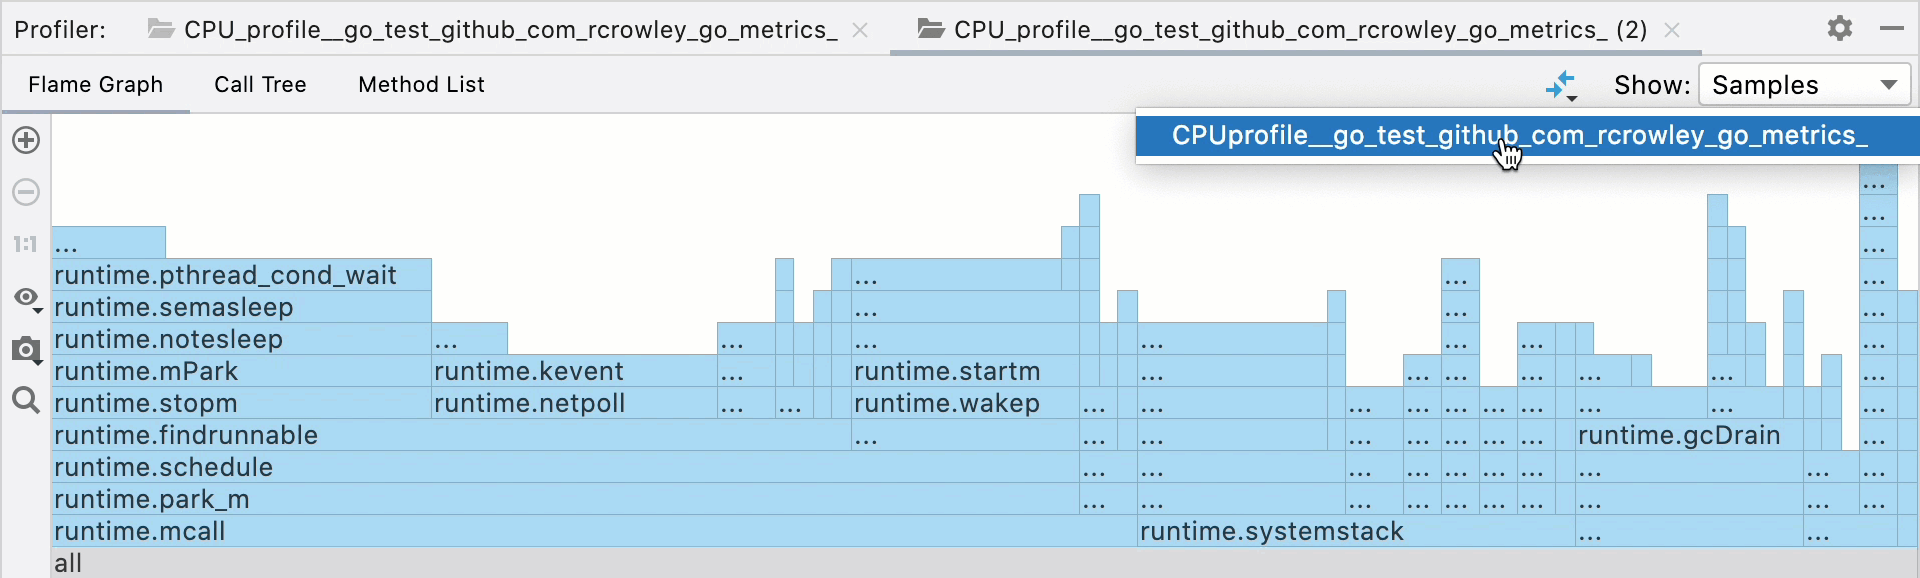
Compare with a baseline
Open two snapshots. To open snapshots, you can run the profiler twice or go to and select snapshots here.
Click the Compare With Baseline button and select the snapshot that you want to compare against.
A separate diff tab will open with the results of the comparison, combining two flame graphs and showing the differences as red and green.
If you see that some part of the frame is green, it means that the corresponding method became faster during this profiler run. The red color means that the corresponding method became slower.
 Gif
Gif
Call Tree

tip
To toggle the percentage to the parent's call view, click
and select Show Percent of Parent.
Collapse recursive calls

Folded recursive calls are marked with the ![]() icon on the Call Tree tab. Click it to open the recursive call tree in a separate tab. You can preview the number of merged stacks in a tooltip.
icon on the Call Tree tab. Click it to open the recursive call tree in a separate tab. You can preview the number of merged stacks in a tooltip.

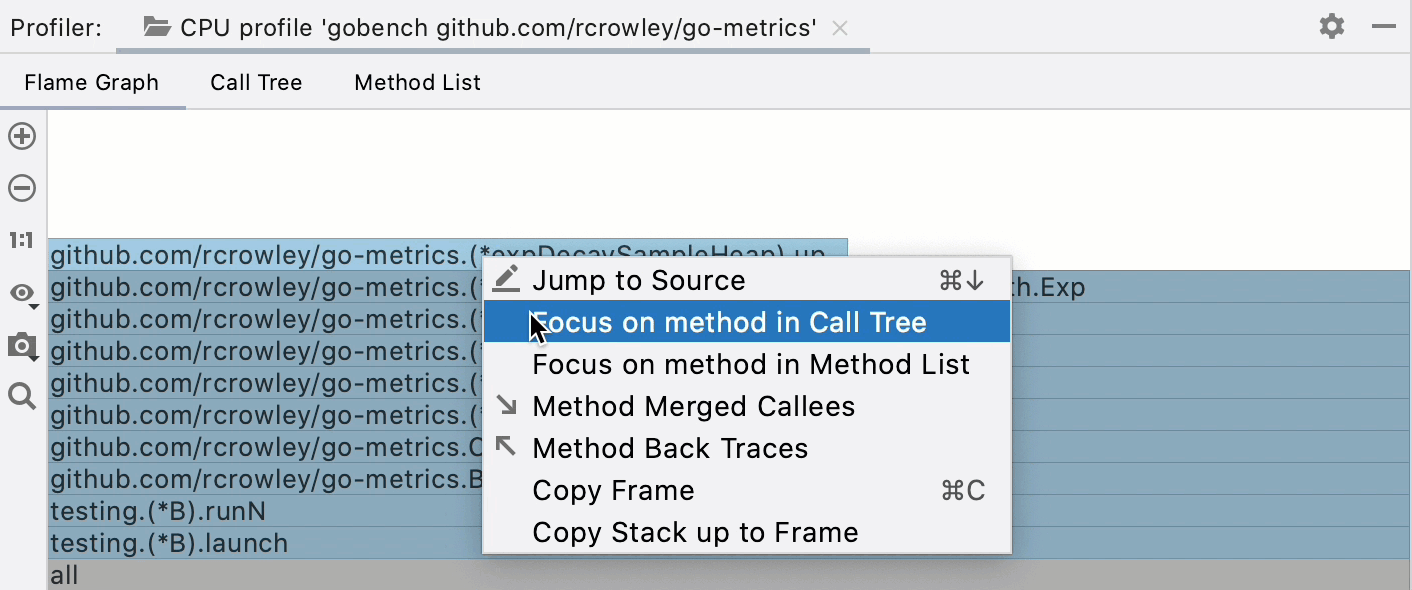
What-if: focus on specific methods

Method List
