Debugging with Mozilla rr
Mozilla rr and its features are available only on Linux machines.
Ensure that your CPU is compatible with Mozilla rr. See the list of limitations at the official Mozilla rr site in the Limitations section.
Mozilla rr is a tool that you can use to record, replay, and debug applications. The main idea of Mozilla rr is to help you catch non-trivial bugs.
Mozilla rr records the whole program execution. It means that you can debug the recorded trace only when the program ends its execution. For servers and other long-running applications, you must terminate the running application (for example, by sending the SIGTERM signal from the console). After the recording, you can replay the execution in the debugger as many times as you need. Read more about Mozilla rr on the official Mozilla rr site.
Install Mozilla rr. For installation instructions, see the Building And Installing.
In GoLand, set a breakpoint. To set a breakpoint, click the gutter near the code line where you want the debugger to stop code execution. For more information about breakpoints, see Debugging and Breakpoints.
Click the Run icon (
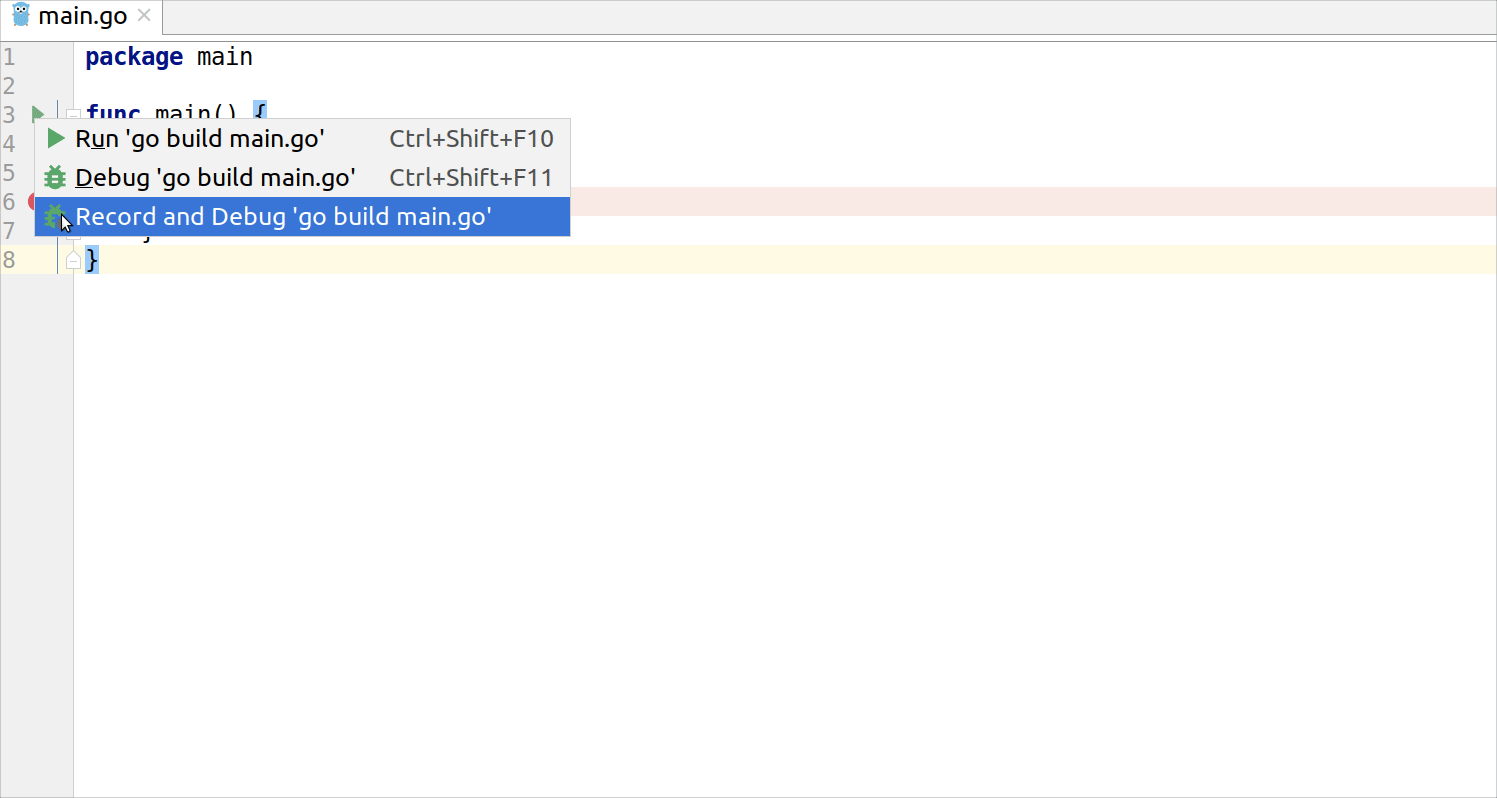
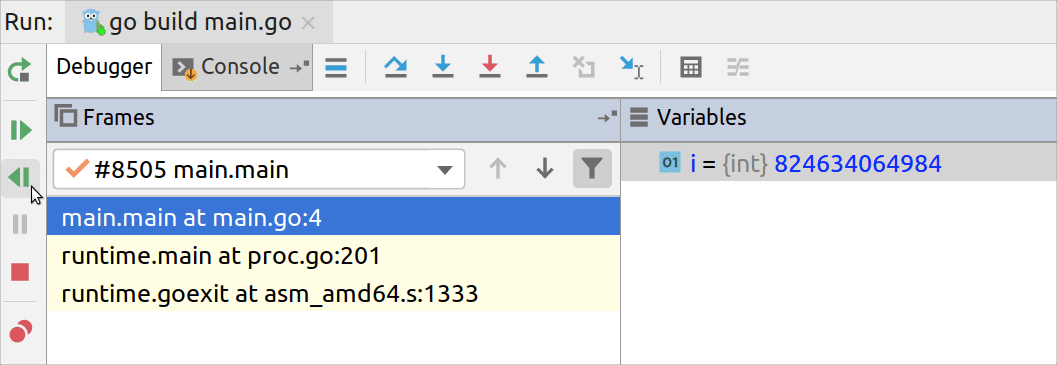
) in the gutter and select Record and Debug <configuration_name>. In the Debugger tool window, you can see a status of variables, processes, and threads on different stages of code execution.

Navigate to Run | Debug Saved Trace.
In the Trace directory field, specify a path to the trace directory.
Click OK.
In the Debugger tool window, click the Resume Program icon
to continue program execution, or click the Rewind icon below to run the debug session backwards until the previous breakpoint.

Build an executable by using the Go build run/debug configuration. To easily find the executable, specify the current project directory in the Output directory field of the Go build configuration. For more information about creating run/debug configurations, see Create a run/debug configuration.
Open the terminal and run the following Mozilla rr command:
rr record <path_to_the_application_executable>As a result, the Mozilla rr trace files appear in the following folder: ~
/.local /share /rr /<executable_name>  Gif
Gif
On the remote machine, collect the Mozilla rr trace.
On the remote machine, start the debugger by opening the terminal and running the following command:
dlv --headless --api-version=2 -l localhost:2345 replay /path/to/trace/dir /path/to/binaryOn the local machine, create the Go Remote run/debug configuration. In the Go Remote configuration, specify the remote machine IP address and port. For more information about creating run/debug configurations, see Create a run/debug configuration.
On the local machine, ensure that the Go Remote run/debug configuration is selected in the configurations list.
On the local machine, click Run | Debug <remote_configuration_name>. Alternatively, press ShiftF9.
 Gif
Gif
Thanks for your feedback!