Quick start guide
This quick start guide will introduce you to the key concepts and help you with your first steps in GoLand.
Step 1. Open or create a Go project in GoLand
After you have installed GoLand and launched it for the first time, you need to create a project. Everything you do in GoLand is done within the context of a project. It serves as a basis for coding assistance, bulk refactoring, coding style consistency, and other features.
You have three options to start working on a project inside the IDE:
Open an existing project
In the Welcome to GoLand dialog, click Open.
Alternatively, click .
In the file browser, navigate to a folder with project files and click Open.
Click OK.
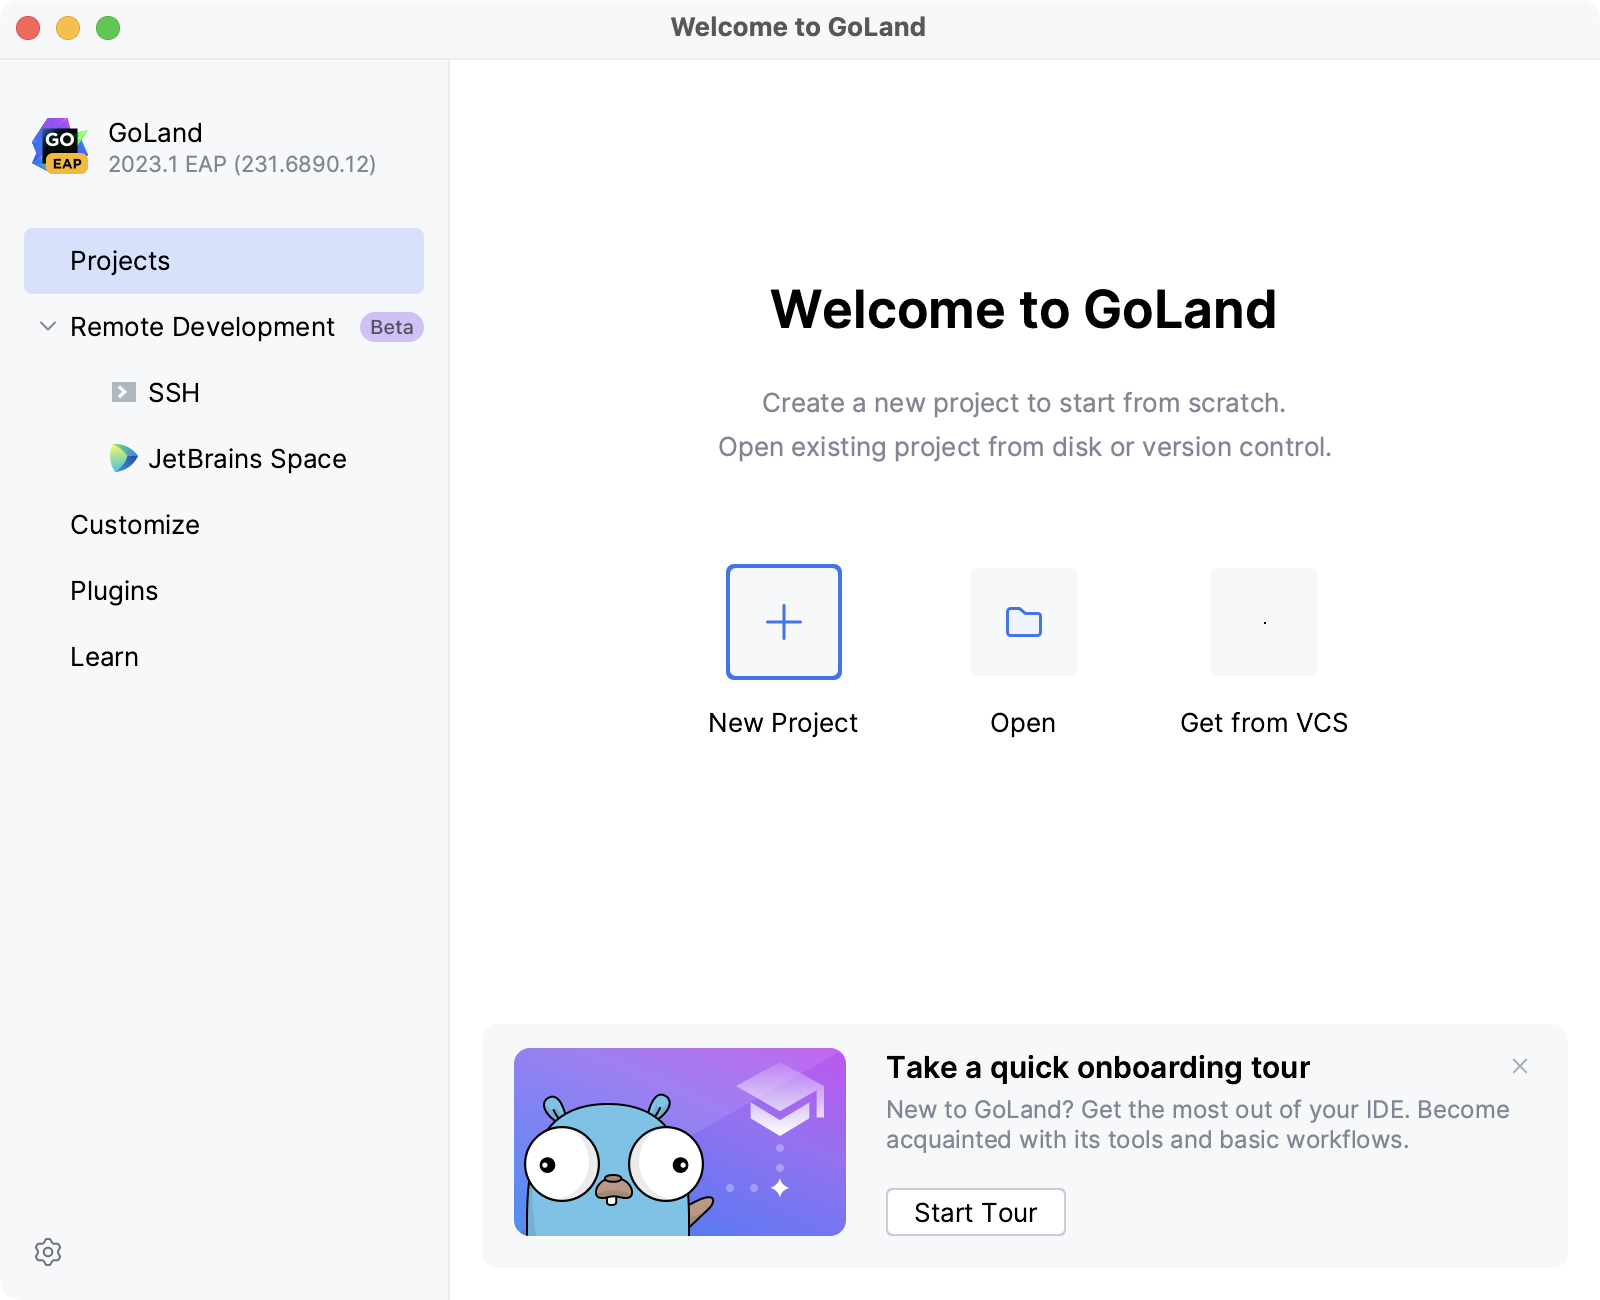
After you have opened your project, you need to specify the location of the Go SDK. You can specify a local path to the SDK or download it. To set the Go SDK, open settings Ctrl+Alt+S and navigate to . Click the Add SDK button and select between two options:
Add SDK: use a local SDK copy. In the file browser, navigate to the SDK version that is on your hard drive.
Download: download the SDK. In the Location field, specify the path for the SDK. To use a file browser, click the Browse icon
. Click OK.
Clone an existing project from a Version Control System
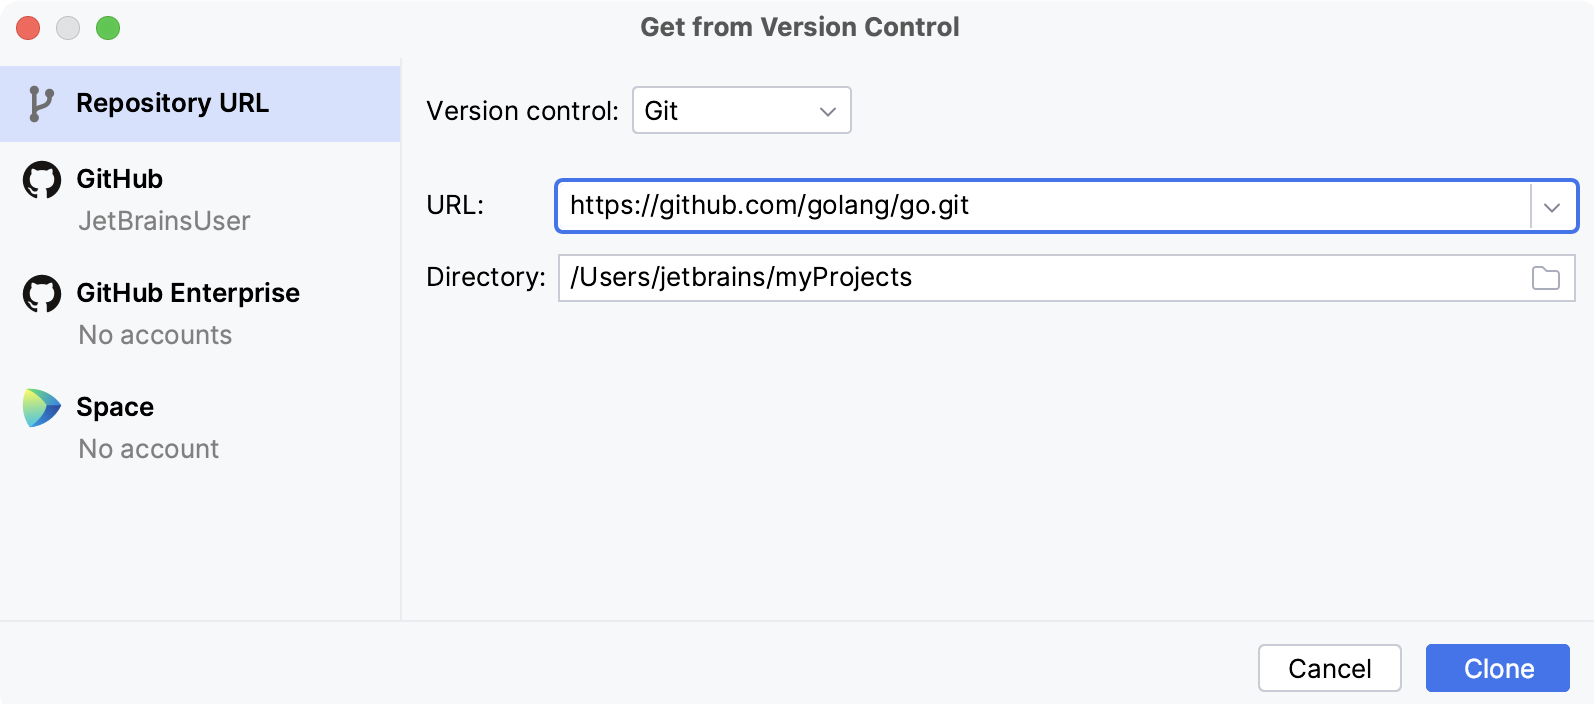
In the Welcome to GoLand dialog, click Get from Version Control.
From the Version Control list, select Git or Mercurial:
To check out files from GitHub, select GitHub and click Log In via GitHub. You will be redirected to account.jetbrains.com where you need to click Authorize in GitHub. Enter your GitHub credentials and grant access to your GitHub account.
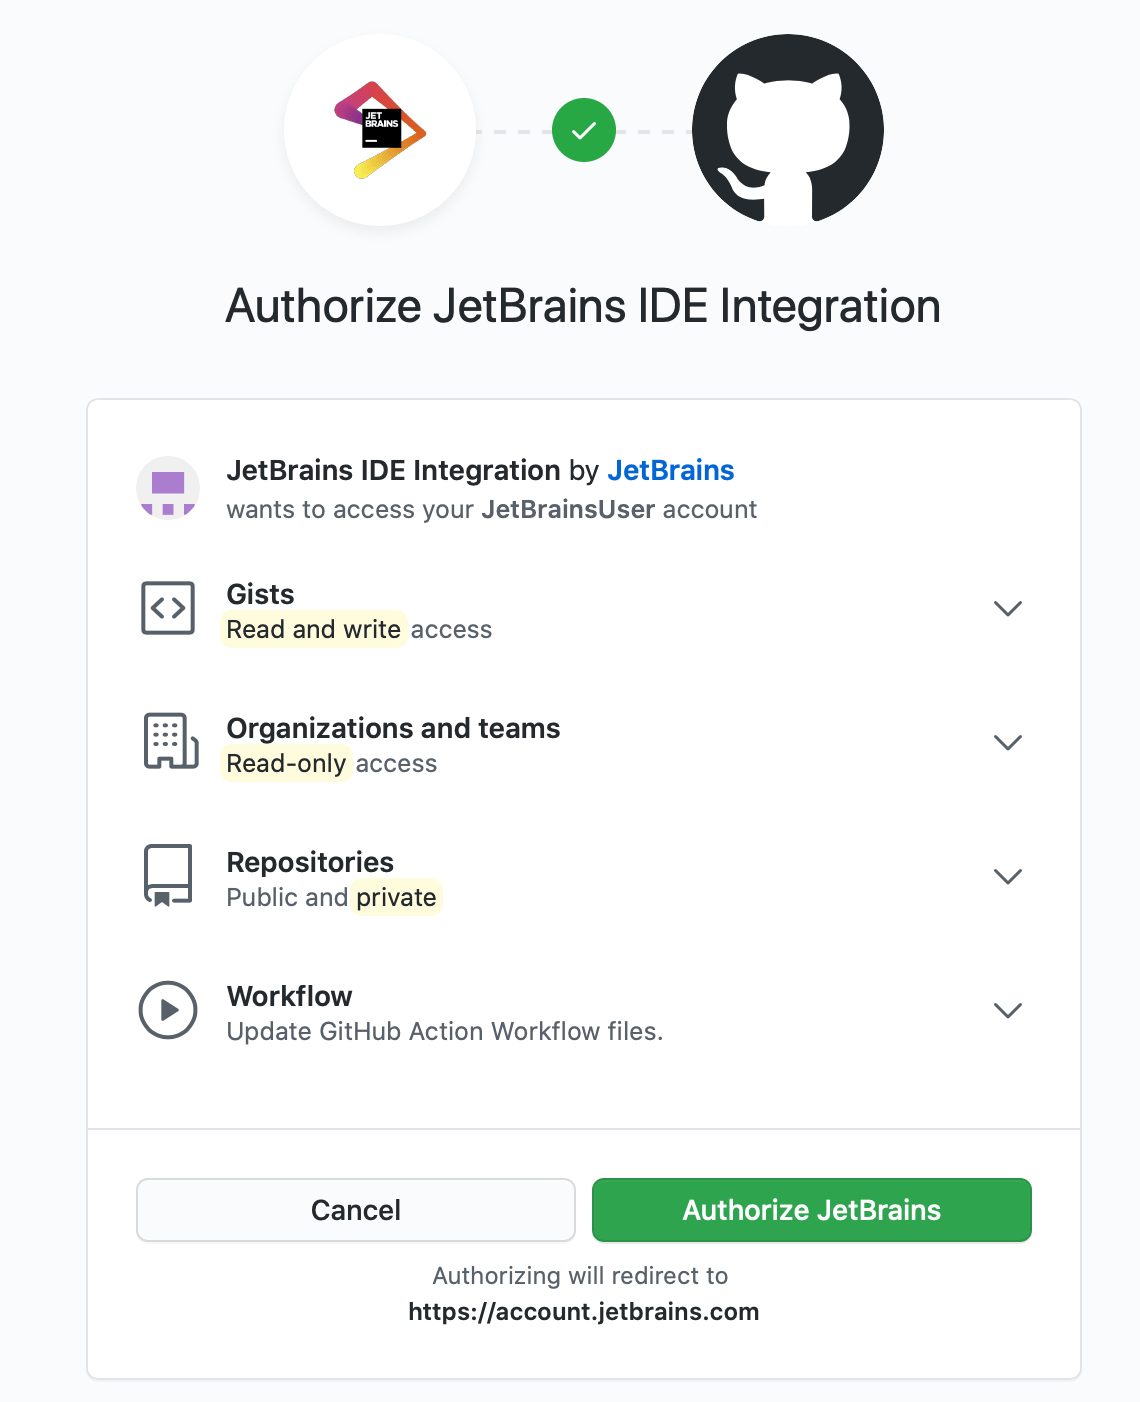
To check out files from Mercurial, install and configure Mercurial and restart GoLand. Enter a path to the sources and clone the repository to your computer.
After you have opened your project, you need to specify the location of the Go SDK. You can specify a local path to the SDK or download it. To set the Go SDK, open settings Ctrl+Alt+S and navigate to . Click the Add SDK button and select between two options:
Add SDK: use a local SDK copy. In the file browser, navigate to the SDK version that is on your hard drive.
Download: download the SDK. In the Location field, specify the path for the SDK. To use a file browser, click the Browse icon
. Click OK.
For more information about version control systems, refer to Version control.
Create a Go project
Select .
Alternatively, click New Project in the Welcome to GoLand dialog.
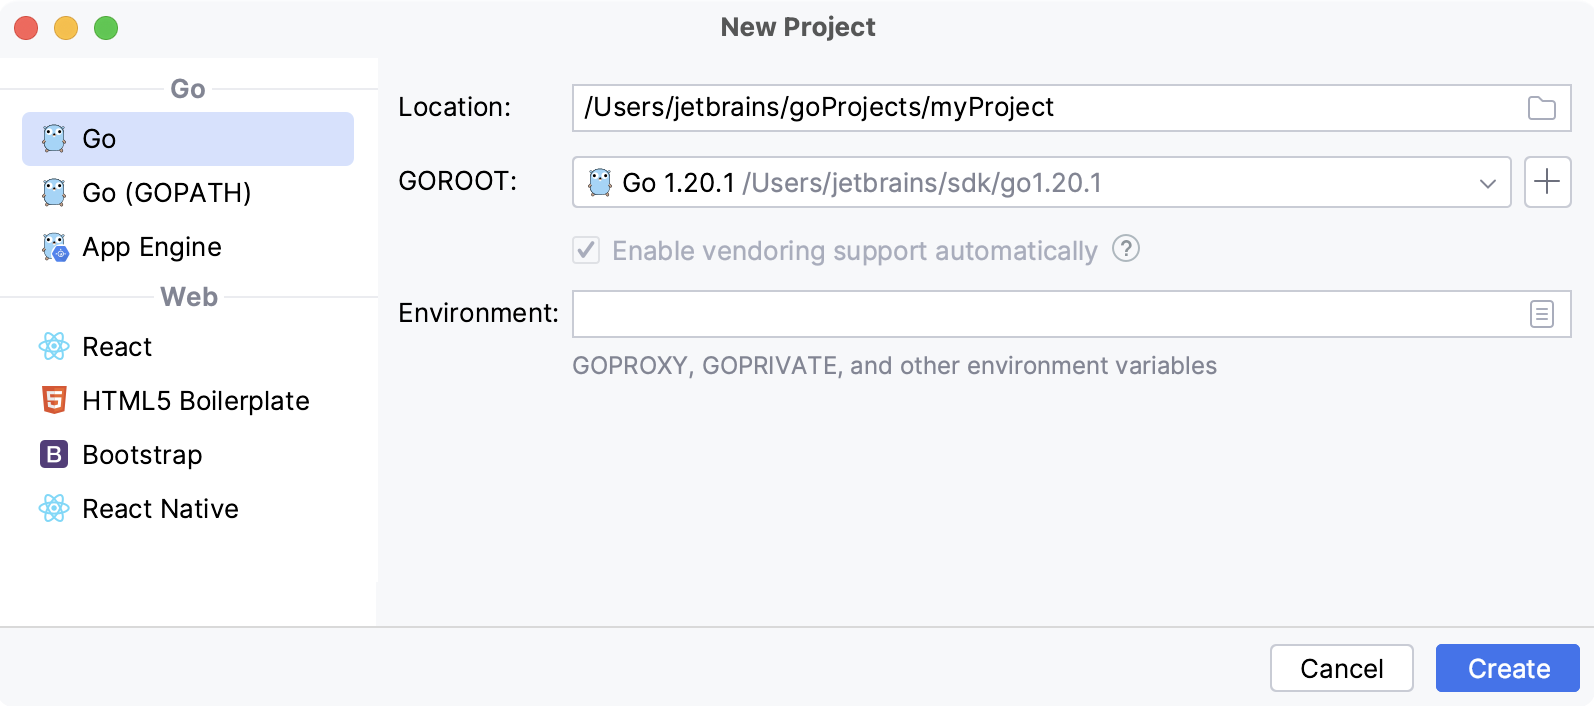
In the New Project dialog, select Go modules from the list of available projects.
In the GOROOT field, specify the location of your Go installation. GoLand typically detects this location automatically.
To change or install a new version of the Go SDK, click Add SDK (
) and select one of the following options:
Local: to select a Go SDK version on your local drive.
Download: to download the Go SDK from the official repository.
(Optional) Select or clear the Enable vendoring support automatically checkbox.
(Optional) In the Environment field, specify environment variables that you need for your project. For example, the
GOPROXYenvironment variable. Read more about environment variables in the Environment variables section.Click Create.
Create a Go file
A new project has no Go files. To create a Go file, perform one of the following actions:
In the Project tool window, right-click the parent folder of a project, and select .
Click the parent folder of a project, press Alt+Insert, and select Go File.
Click the parent folder of a project, navigate to .
In the New Go File dialog, type a name of the file and select whether you want to create an empty Go file (Empty file) or a Go file with the defined
mainfunction (Simple application).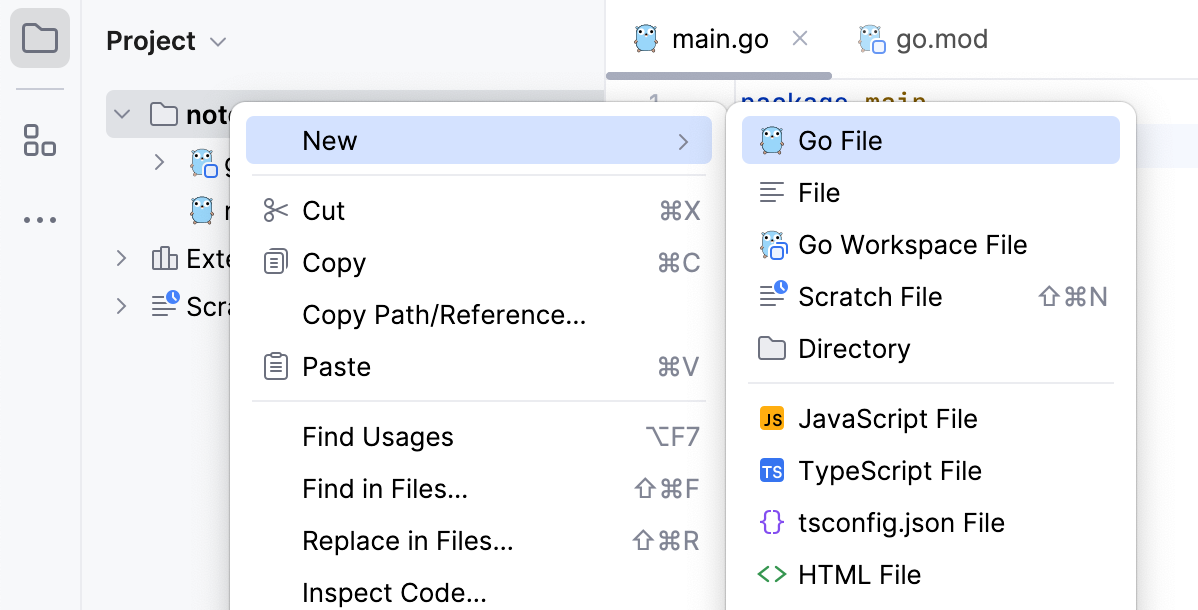
Step 2. Explore the user interface
When you launch GoLand for the very first time, you see the Welcome to GoLand dialog. From the Welcome to GoLand dialog, you can create and open projects, check out a project from a version control system, view documentation, and configure the IDE.
When a project is opened, you see the main window divided into several logical areas.
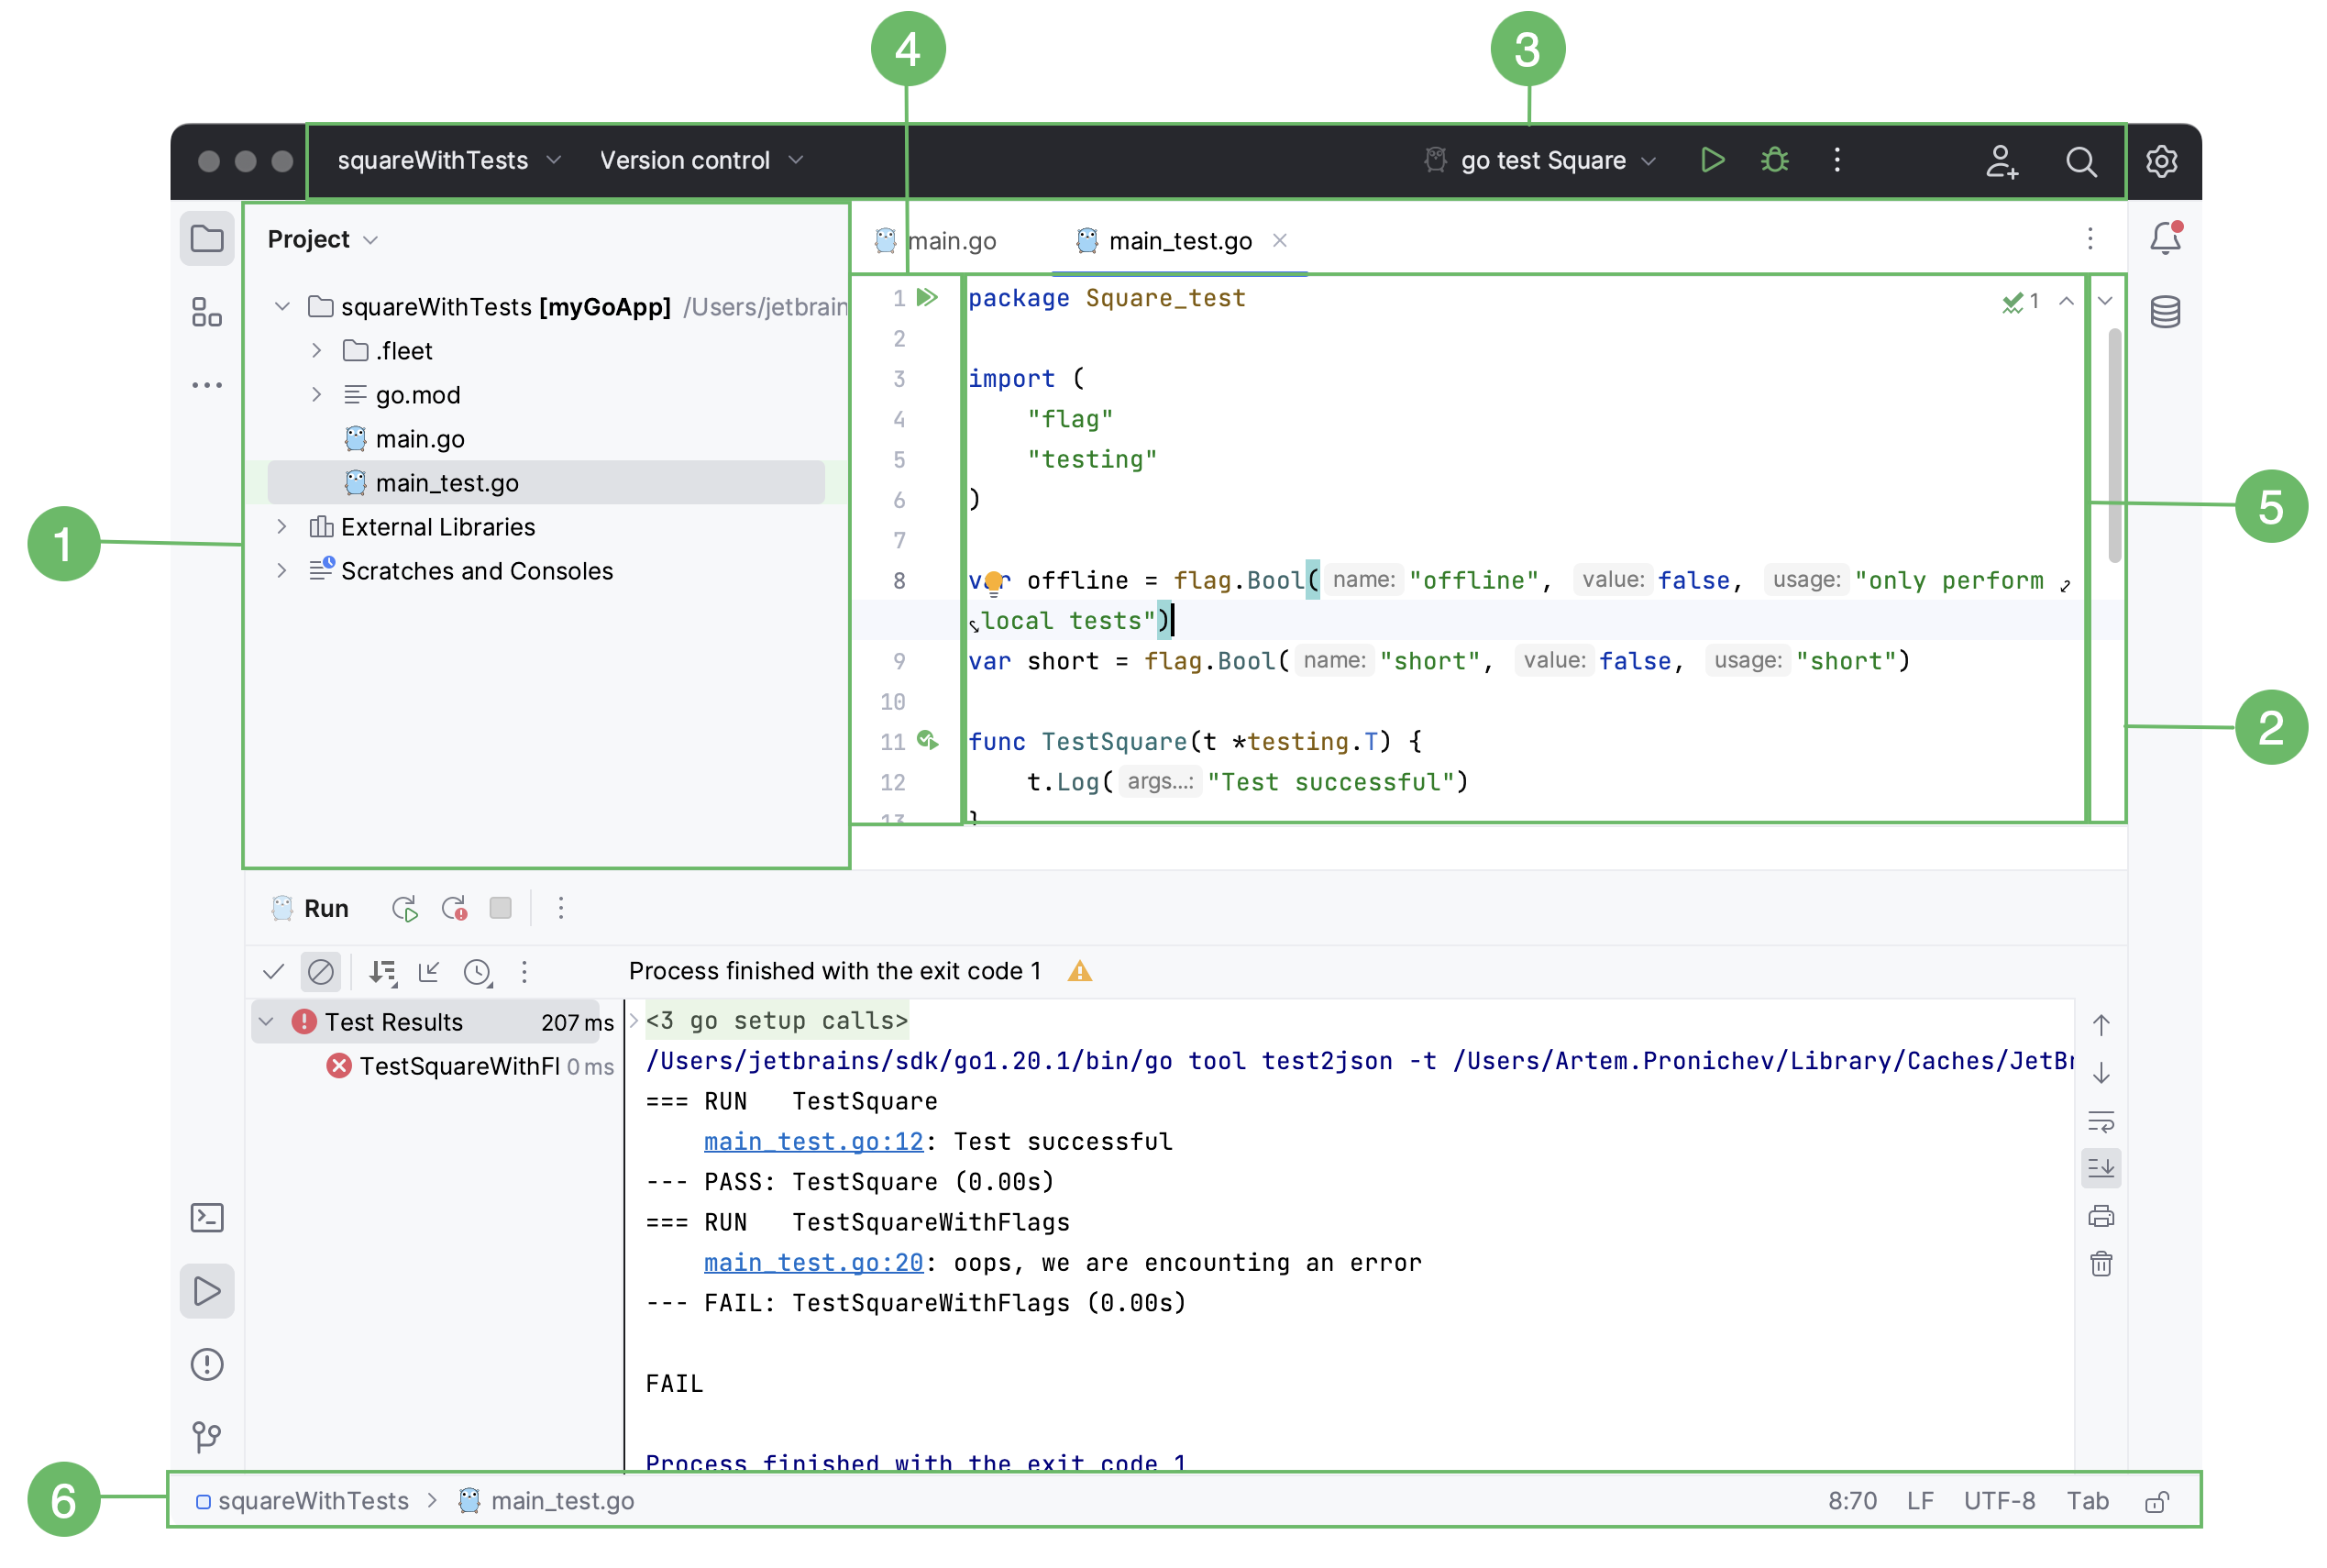
The Project tool window, which is on the left side, displays your project files. Tool windows are windows that provide access to project management, search, running and debugging, integration with version control systems, and other tasks. To see a list of all tool windows, navigate to .
The Editor pane is on the right side, where you write your code. It has tabs for easy navigation between open files.
The navigation bar is above the editor additionally allows you to quickly run and debug your application as well as do basic VCS actions.
The Gutter is the vertical stripe next to the editor. It shows you the breakpoints and provides a convenient way to navigate to a definition or a declaration. Also, you can use the Run Application icon (
) to run or to debug your application.
The Scrollbar, on the right side of the editor. GoLand monitors the quality of your code and shows the results of code inspections: errors, warnings, typos, and other issues. The indicator at the top of the gutter shows the overall status of code inspections for the entire file.
The status bar indicates the status of your project and the entire IDE and shows you information about a file encoding, line separators, inspection profiles, and other warnings and information messages.
In the lower left part of the IDE, in the Status bar, you can see or
buttons. These buttons toggle the display of the tool window popup. If you hover over this button, the list of the currently available tool windows shows up.
Step 3. Write your code
As you work in the editor, GoLand analyzes your code, searches for ways to optimize it, and detects potential and actual problems. The following list includes basic features and tools that might be useful for your code writing and increase your productivity:
Refactorings
Refactoring is a process of improving your source code without creating a new functionality. Refactoring helps you keep your code solid , dry, and easy to maintain.
GoLand suggests you the following refactoring options:
Change signature changes the method or function name; adds, removes, and reorders parameters; assigns default values to new non-variadic parameters.
Extract refactorings extracts code fragments that can be grouped. You can extract a constant, a variable, a method, and an interface.
Inline refactoring moves an extracted code fragment to the calling code. An opposite to the Extract refactoring.
Copy refactoring copies a file, a directory, or a package to a different directory or a package.
Move refactoring moves source code sections to another package or a file. For example, you can use the Move refactoring to move methods to another package.
Code completion
GoLand has two types of code completion:
Basic code completion Ctrl+Space helps you complete names of types, interfaces, methods, and keywords within the visibility scope. When you invoke code completion, GoLand analyzes the context and suggests the choices that are reachable from the current caret position. By default, GoLand displays the code completion popup automatically as you type.
Smart code completion Ctrl+Shift+Space filters the suggestion list and shows only the types applicable to the current context.
The following animation shows the difference between basic and smart type-matching completion. Notice the number of variants that are suggested for different completion types
Generating code
GoLand provides multiple ways to generate common code constructs and recurring elements, which helps you increase productivity. These can be either file templates used when creating a new file, custom or predefined live templates that are applied differently based on the context, various wrappers, or automatic pairing of characters.
You can generate getters, setters, constructors, missing methods, and test files. For more information about the Generate action, refer to Using the Generate action.
Live templates
Use live templates to insert common constructs into your code, such as loops, conditions, declarations, or print statements.
To expand a code snippet, type the corresponding template abbreviation and press Tab. Keep pressing Tab to jump from one variable in the template to the next one. Press Shift+Tab to move to the previous variable.
To see the list of live templates, open settings Ctrl+Alt+S and navigate to .
Consider the following example of the
Hello Worldprogram that is coded with Live Templates.
Inspections
In GoLand, there is a set of code inspections that detect and correct abnormal code in your project before you compile it. The IDE can find and highlight various problems, locate dead code, find probable bugs, spelling problems, and improve the overall code structure.
Inspections can scan your code in all project files or only in specific scopes (for example, only in production code or in modified files).
Every inspection has a severity level — the extent to which a problem can affect your code. Severities are highlighted differently in the editor so that you can quickly distinguish between critical problems and less important things. GoLand comes with a set of predefined severity levels and enables you to create your own.
To see the list of inspections, open settings Ctrl+Alt+S and navigate to . Disable some of them, or enable others, plus adjust the severity of each inspection. You decide whether it should be considered an error or just a warning.
For example, the Unreachable code inspection detects parts of code that cannot be executed.

Intention actions
As you work in the editor, GoLand analyzes your code, searches for ways to optimize it, and detects potential and actual problems. Intention actions cover a wide range of situations from errors and warnings to optimization suggestions.
In GoLand, you can use the following types of intention actions:
Intention actions
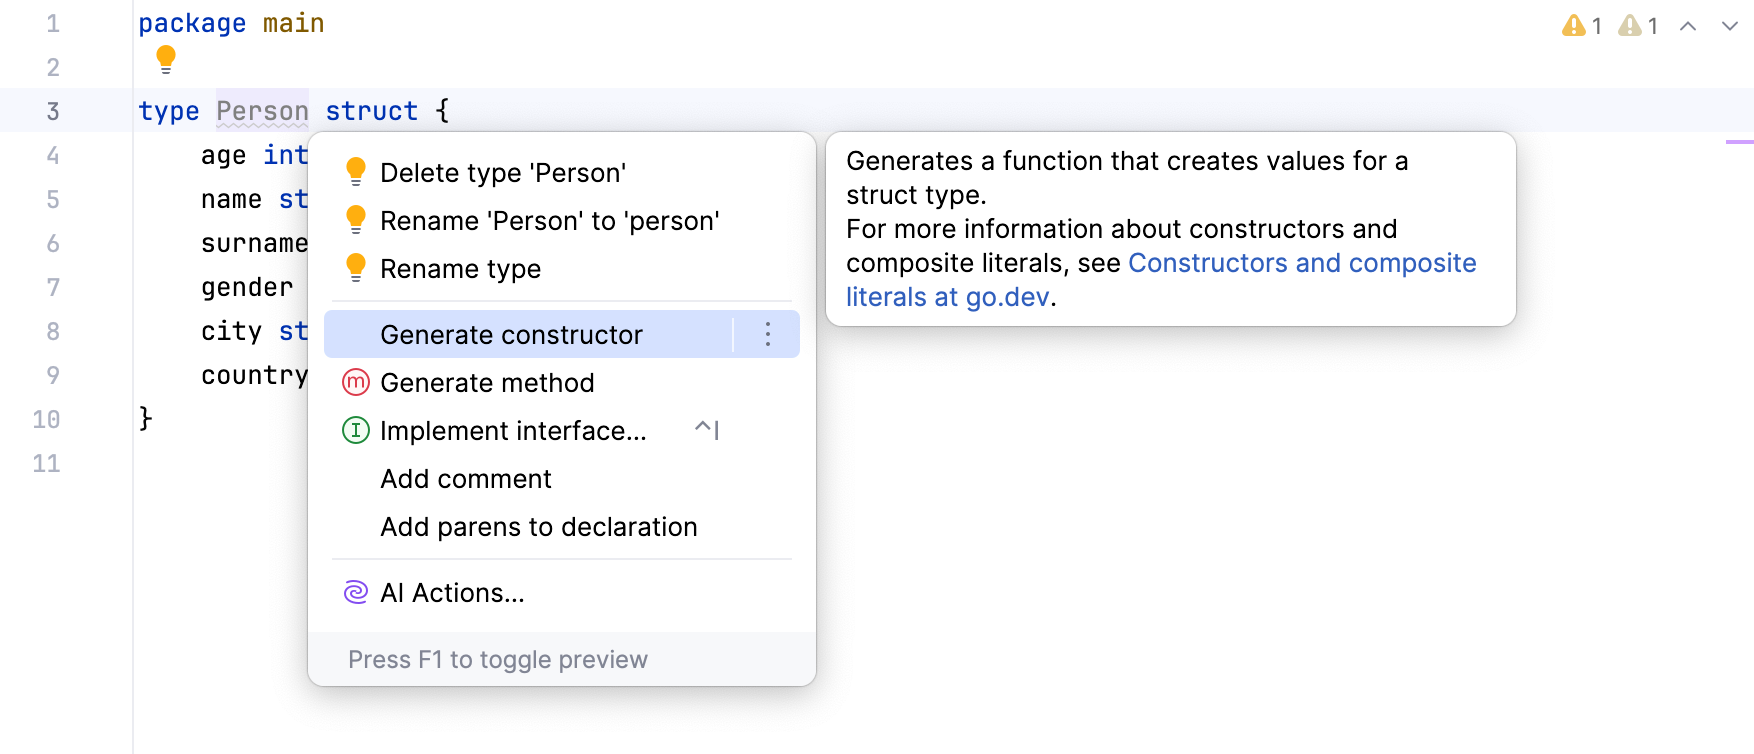
 : an action that generates a piece of code or suggests an alternative variant for your code. Usually, an intention action is applied to a valid piece of code. By clicking the yellow bulb icon, you can view intention actions available in the current context. For example, you can create a constructor that generates values of a struct type. Or, replace the if-else statement with the equivalent one but with a negated condition and swapped if-else branches.
Quick-fixes
 : an action that suggests a solution for a problem in your code. Usually, the intention action is applied to a code that has an error. For example, when you missed brackets at the end of the expression. Or, when you forgot to convert a value to a specific type.
To see the list of intention actions, open settings Ctrl+Alt+S and navigate to .
To apply an intention action, click the bulb icon (or press Alt+Enter) to open the list of suggestions.
Select an action from the list and press Enter.
For example, you can use an intention action to inject another language in your code:

Step 4. Run and debug your code
You can run and debug your code in GoLand from a keyboard, from the context menu, from the gutter menu, or by using the Run/Debug configuration.
Run your code
To run your application Shift+F10, click the Run Application icon
in the gutter and select Run <application_name>.

Debug your code
Debugging starts with placing breakpoints at which program execution will be suspended so that you can explore program data. Just click the line in the gutter where you want to place a breakpoint.
To debug your application Shift+F9, click the Run Application icon in the gutter
and select Debug <application_name>. Then go through the program execution step by step (see the available options in the menu or the Debug tool window).
For more information, refer to Debugging.
