Memory profiler
GoLand collects and visualizes CPU profiles, traces, and heap profiles. To collect all the necessary data, GoLand uses the pprof package. GoLand includes four profilers that you can run from the user interface: CPU, memory, blocking (contention), and mutex.
Profiling results help you locate performance issues, but code improvements must be implemented manually. For more information, see the Profiling at go.dev and the description of the pprof package at pkg.go.dev.
After the analysis is complete, the profiler visualizes the results in reports.
Before you start
Before running a profile, make sure that:
Go is installed, you can install, upgrade, or configure Go by using the GOROOT article. For more information, refer to GOROOT.
GoLand is installed on your machine.
The Go project you want to profile is open in the IDE.
All examples in this topic are available in a sample project on GitHub.
Memory profiling
The memory profiler measures how your program allocates and uses memory during execution. It helps you identify excessive allocations, memory leaks, and inefficient data structures.
Example program
The following program demonstrates inefficient memory usage. It creates a new slice on every iteration instead of reusing an existing buffer:
Run the program. While it completes quickly, it allocates a number of objects on the heap.
Create a test for profiling
To profile the memory usage, create a unit test that calls the InefficientAppend function:
Run memory profiling
Open the _test.go file.
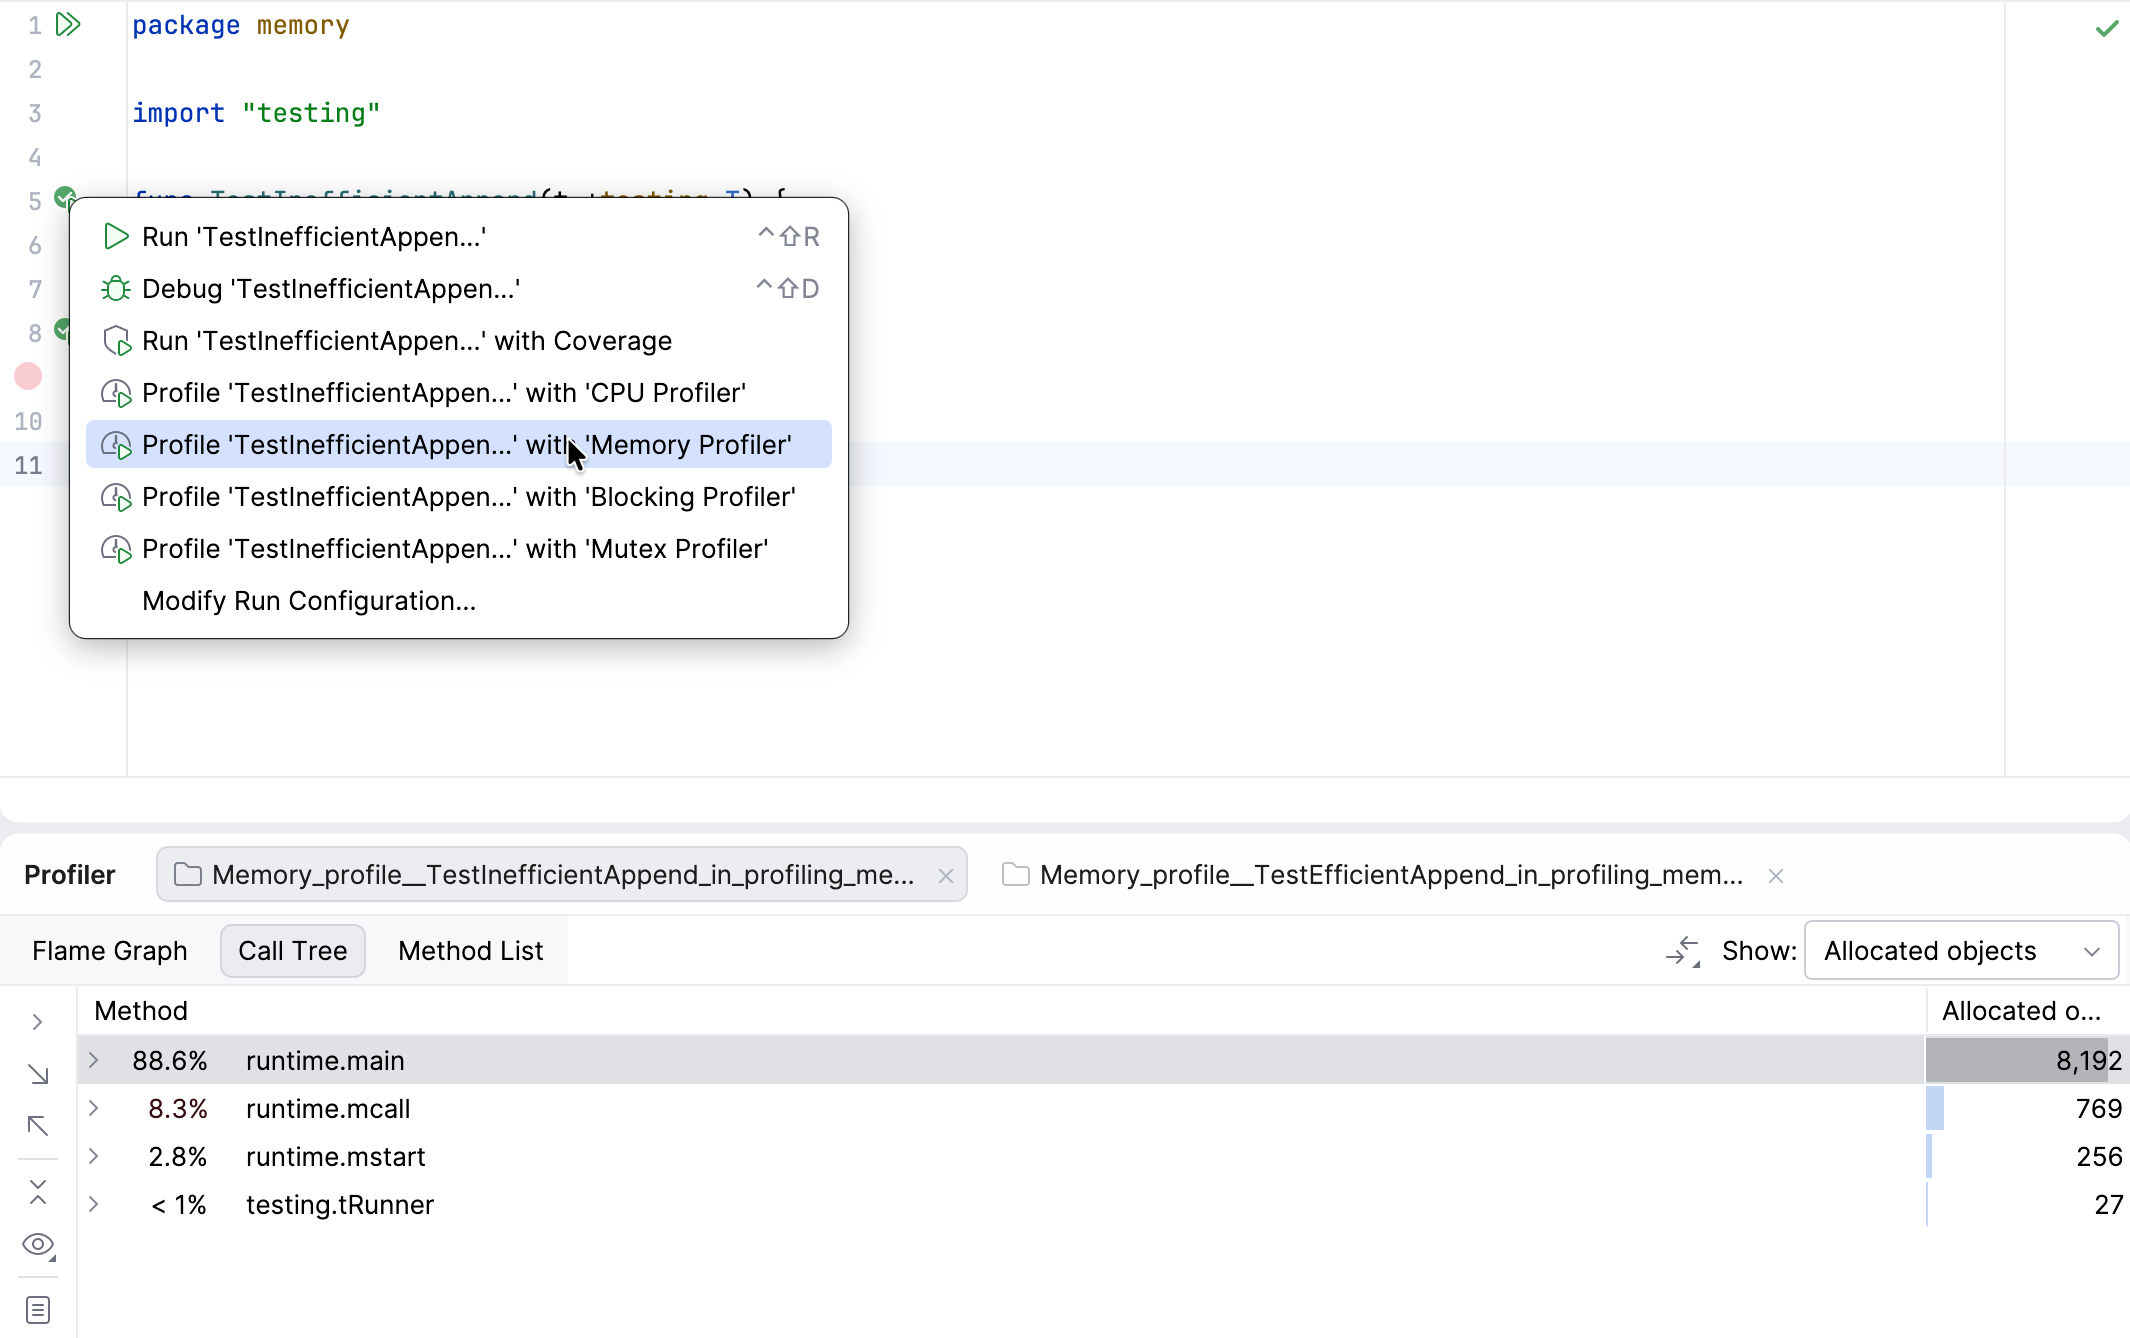
Click the Run icon in the gutter next to the test function.
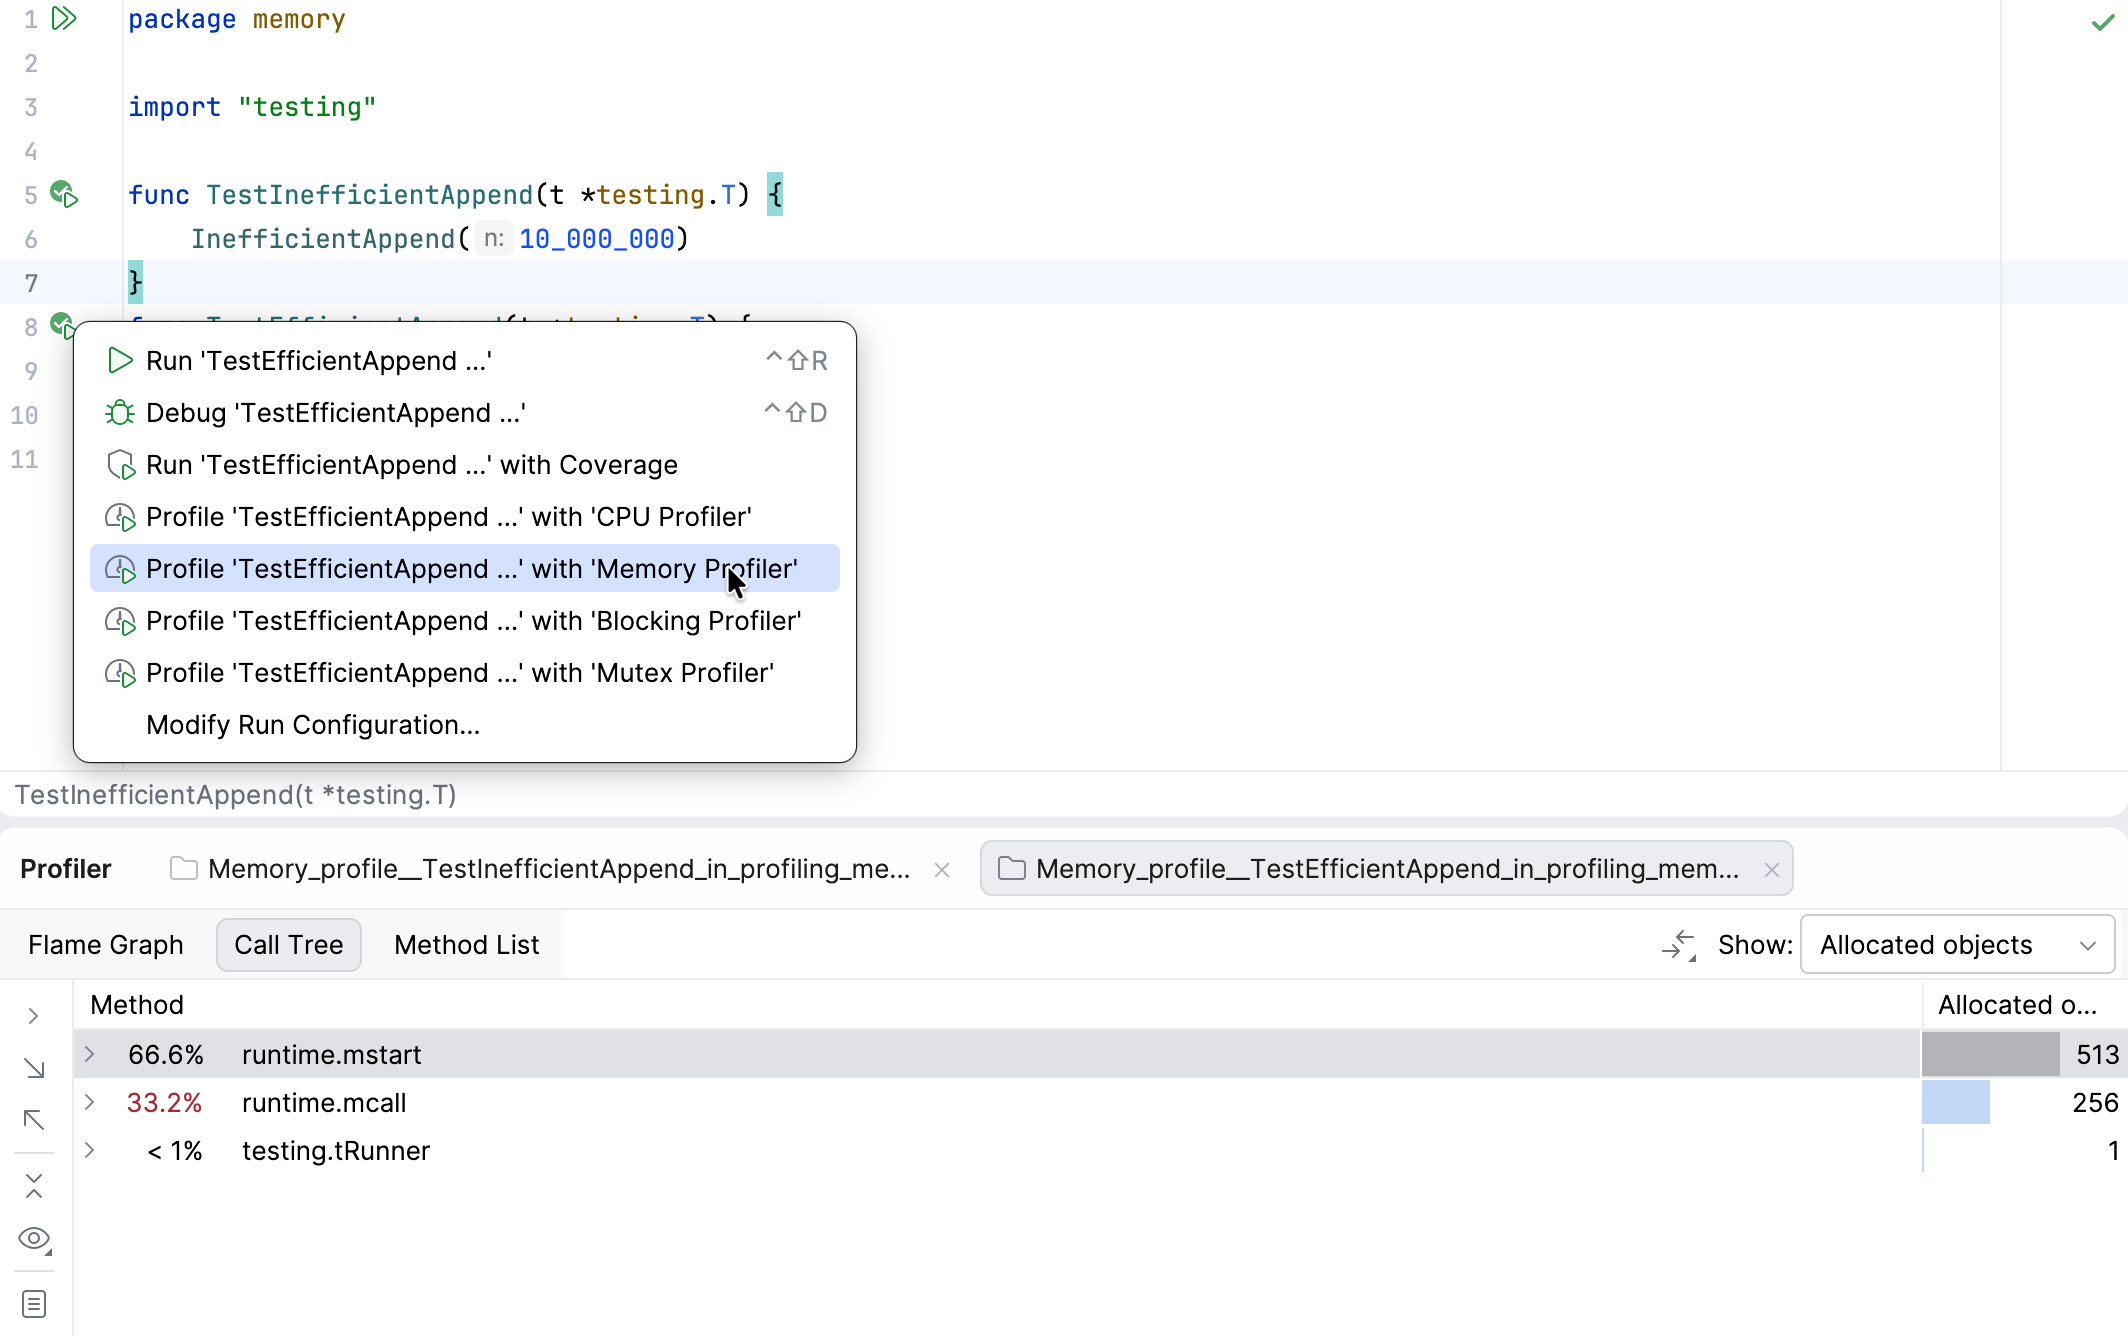
Select Profile with Memory Profiler.

Analyze memory profiling results
GoLand presents memory profiling data in three views:
Flame graph: displays function calls and the amount of memory allocated for each call. Each block represents a function in the stack. The Y-axis shows the stack depth (bottom-up), while the X-axis represents the stack profile, sorted from the most memory-consuming functions (by space and object count) to the least.
When analyzing the flame graph, keep in mind that large objects increase memory usage and garbage collection time, while many small allocations slow down execution. Both cases are worth investigating.
In the Flame Graph tab, hover over any block to view detailed information.
Call tree: visualizes how functions allocate memory and what percentage of total memory usage each procedure represents. This view helps identify parts of your application that use the most memory or allocate the most objects. To configure and filter the Call Tree view, click the Presentation Settings button
.
Method list: lists methods sorted by the number of allocated objects. The Back Traces tab shows where the selected method was called, while the Merged Callees tab shows all call traces originating from the selected method. Callee List is the method list summarizing the methods down the call hierarchy.
Optimize and compare results
To reduce heap pressure, reuse a single buffer or preallocate memory instead of creating new slices repeatedly. Here’s an optimized version of the same code:
When you rerun the memory profiler, the flame graph shows significantly fewer allocations and reduced total heap usage, confirming that preallocation minimizes memory overhead.
