CPU profiler
You can run the CPU profiler only for Go tests and benchmarks
CPU Profiler shows what functions consume what percent of CPU time This information can provide you a better understanding of how your application is executed, and how exactly resources are allocated.
Once the analysis is finished, the profiler visualizes the output data in the re.ports.
GoLand features two pre-defined Async Profiler configurations: the CPU profiler and the memory allocation profiler that you can find in Settings | Build, Execution, Deployment | Java Profiler.
These configurations are adjusted to provide the most accurate results, that is why they don't require any modifications. However, if you still need to change the settings, refer to Async Profiler on GitHub for more information.
In the Settings dialog (CtrlAlt0S) , select Build, Execution, Deployment | Go Profiler.
Select one of the pre-defined CPU or memory profiling configuration or create a new one by clicking
.
Apply the changes and close the dialog.
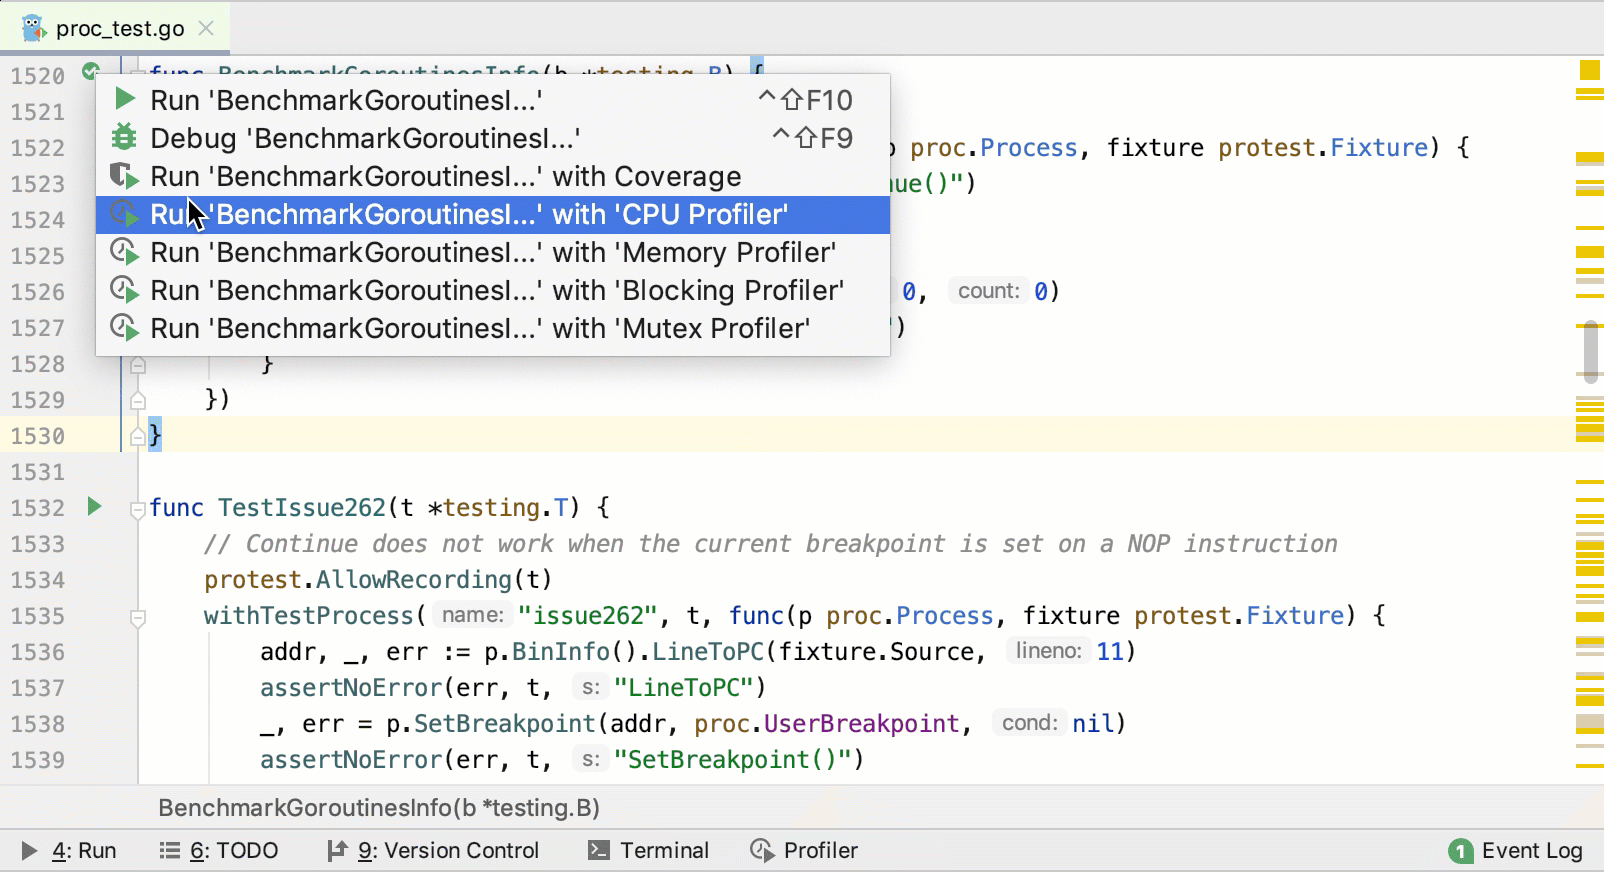
Open the _test.go file.
Near the function or method that you want to profile, click the Run Application icon
in the gutter area and select Run <configuration_name> with 'CPU Profiler'.
In the Profiler tool window, the collected data is presented on three tabs: Flame Graph, Call Tree, and Method List. The left-hand part lists application threads; by clicking on each thread you can go in more details.
The Flame Graph tab shows you function calls and the percentage of time for execution of each call. Each block represents a function in the stack (a stack frame). On the Y-axis, there is a stack depth going from bottom up. The X-axis shows the stack profile sorted from the most CPU-consuming functions to the least consuming ones.
When you read the flame graph, focus on the widest blocks. These blocks are the functions that are presented in the profile most.
Hover over any block to view the details:
tip
For more information about flame graphs, refer to Flame Graphs.
The Call Tree tab represents information about a program’s call stacks that were sampled during profiling:
The method name
Percentage of total sample time (can be toggled to the parent call view)
The total sample count
The number of filtered calls
The optional number right after the percentage presents a filtered sequence of calls. Click it to expand this sequence. The filtering rules can be configured in the settings.
To configure and filter the Call Tree view, use the Presentation Settings button ().
The Method List collects all methods in the profiled data and sorts them by cumulative sample time. Every item in this list has a Back Trace tree and a Merge Callees tree.
The Back Traces tab shows the hierarchy of callers. Use this view to trace which methods call the selected method. Merge Callees tries to summarize all methods that are called by the selected one.
Thanks for your feedback!