Running
You can run applications right from GoLand if you have an GOROOT set up for your project.
Quick way
Run from the editor
If you are not going to pass any parameters to your program, and your program does not require any specific actions to be performed before start, you can run it right from the editor.
Click
in the gutter near the
mainfunction and select Run.To run a script, open it in the editor or select it in the Project tool window, and then select Run <script file name> from the context menu.
Customizable way
Click
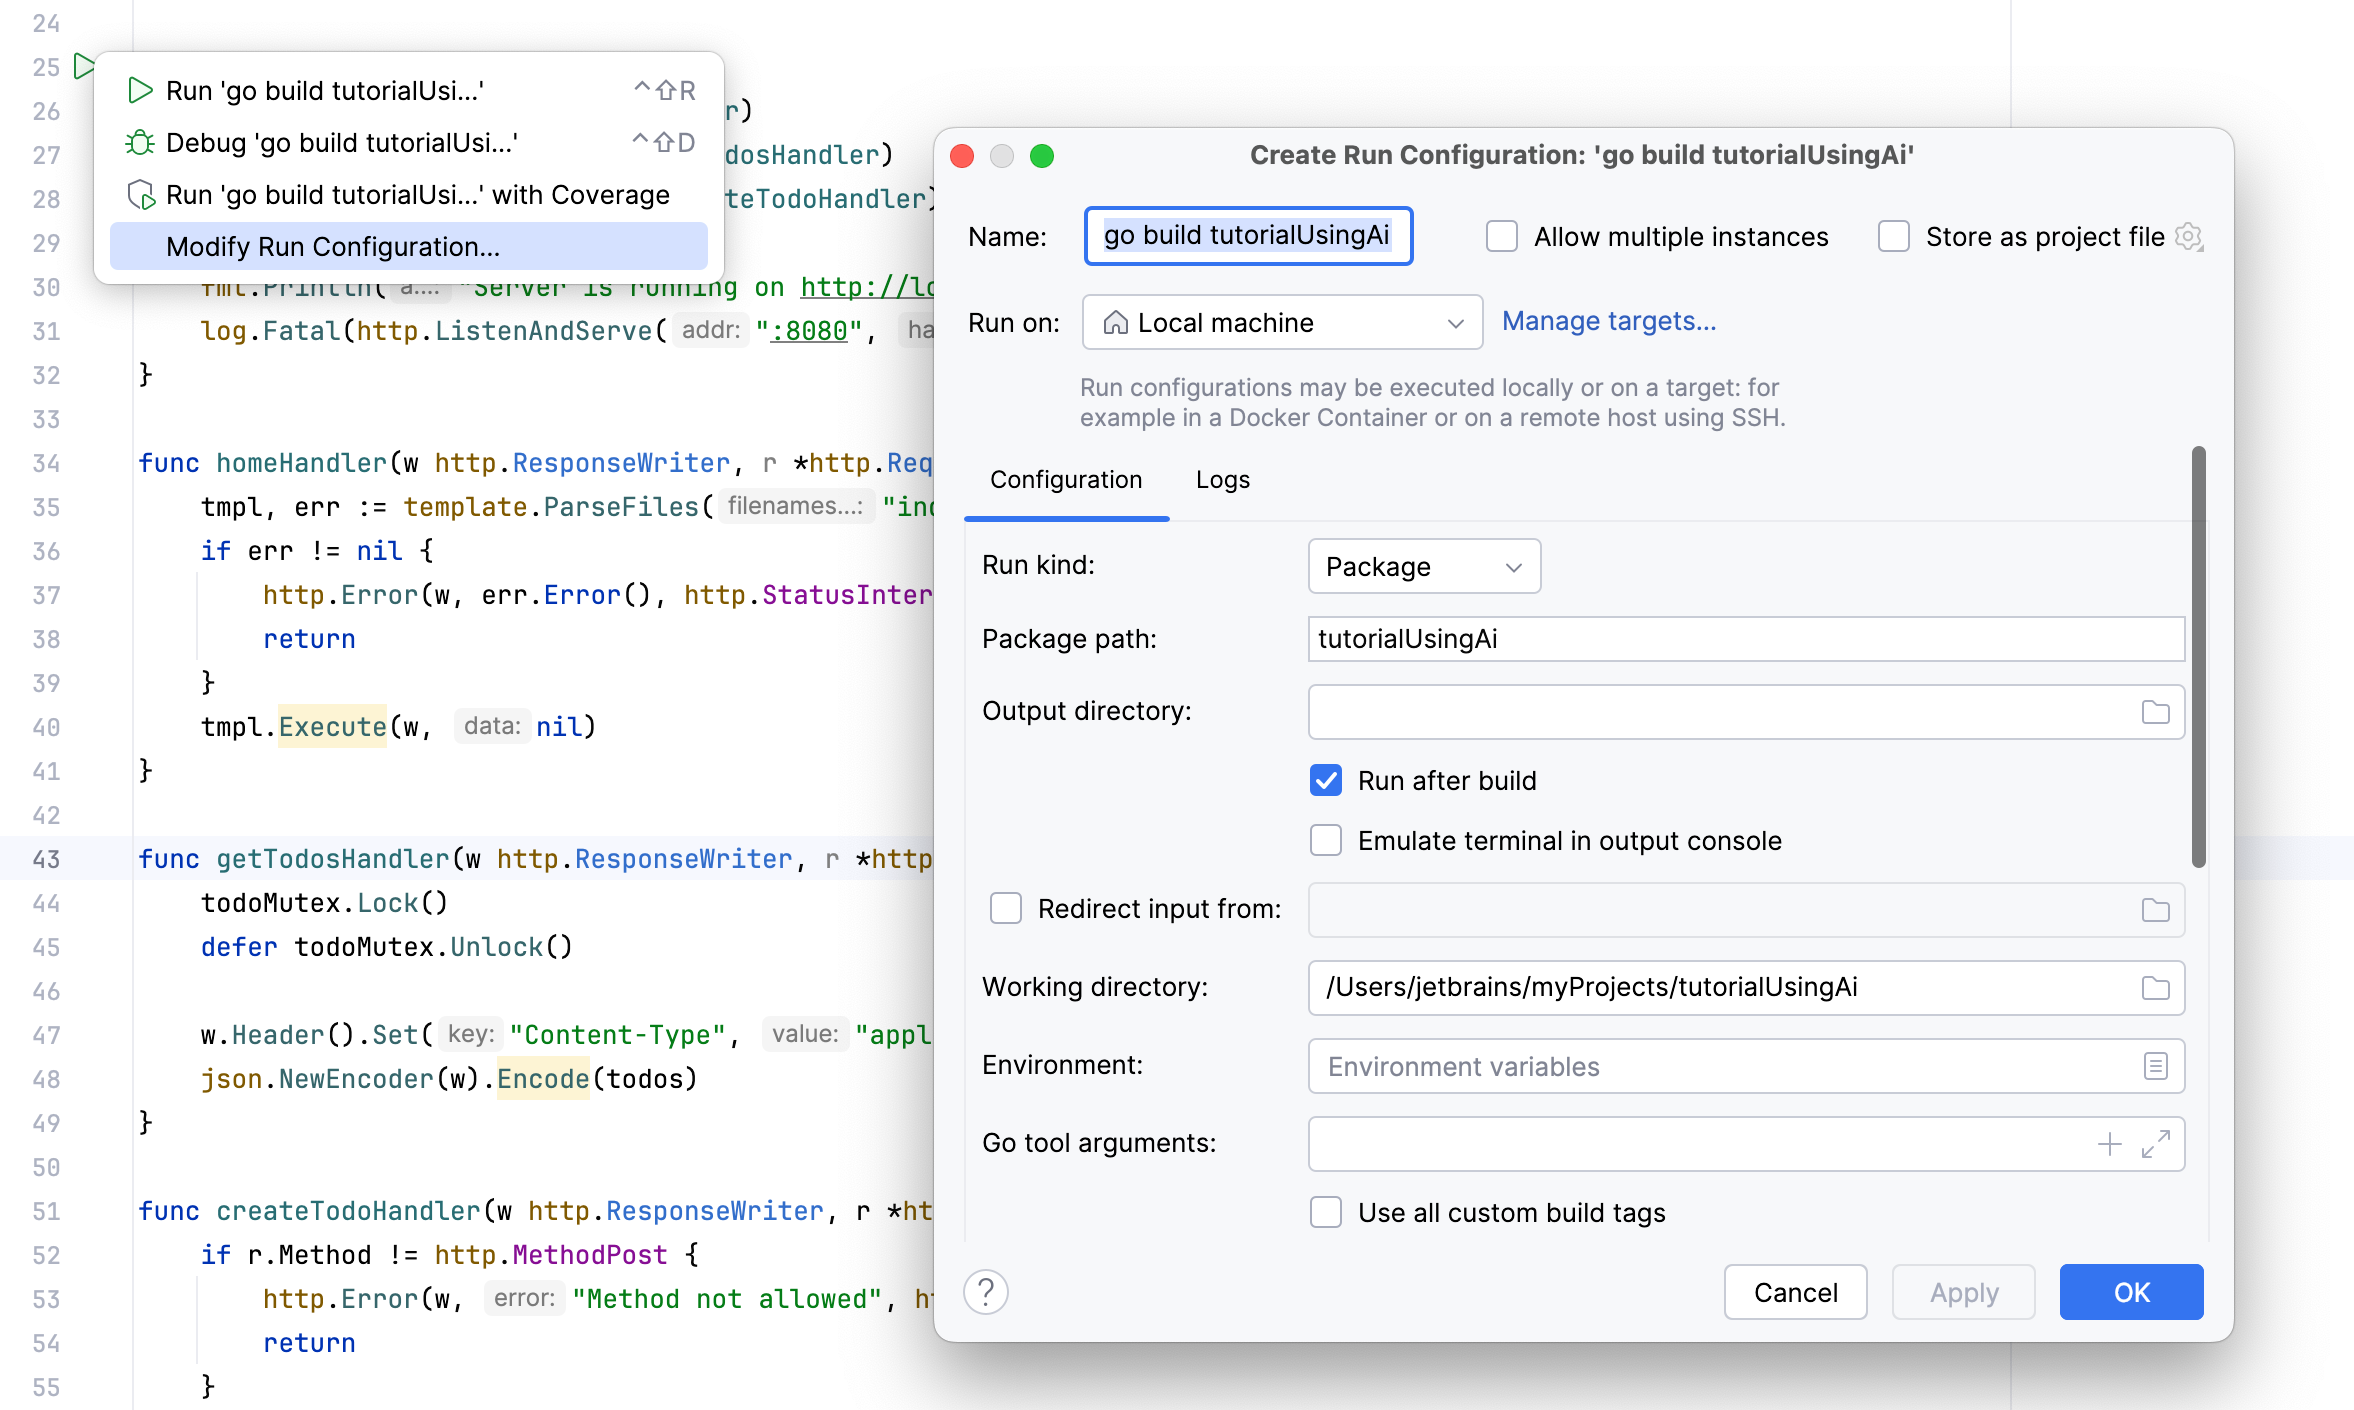
in the gutter near the class declaration and select Modify Run Configuration.

Modify the run/debug configuration as needed. For example, if you need to run your program with arguments, add the arguments to the Program arguments field.
Launch a run configuration
You can launch existing run configurations in one of the following ways:
If the run configuration is already selected in the Run widget, click
next to it or press Shift+F10.
If you want to select another run configuration, click the Run widget. In the menu that opens, click
next to the run configuration you want to launch.
Press Alt+Shift+F10. In the menu that opens, click the run configuration you want to launch.
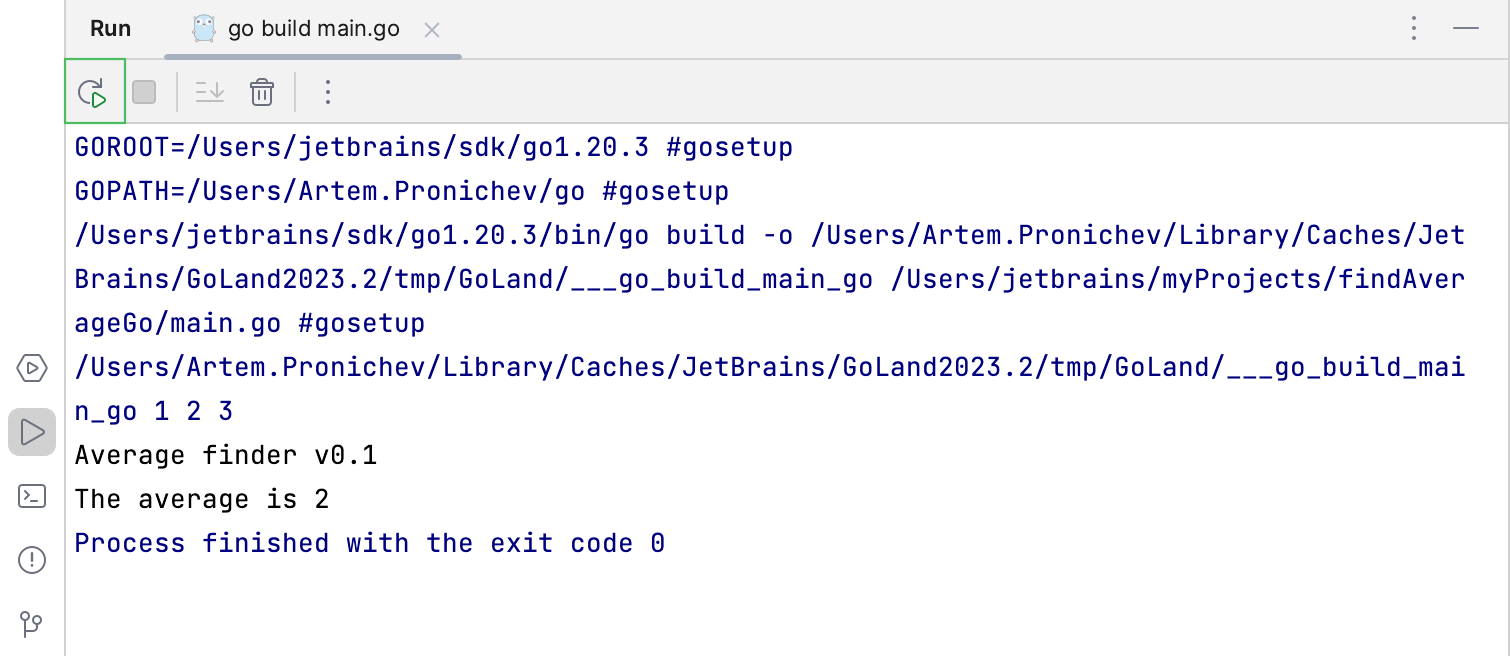
When the application starts, you can view its output and interact with it in the Run tool window. Every run/debug configuration creates a separate tab when you run it.
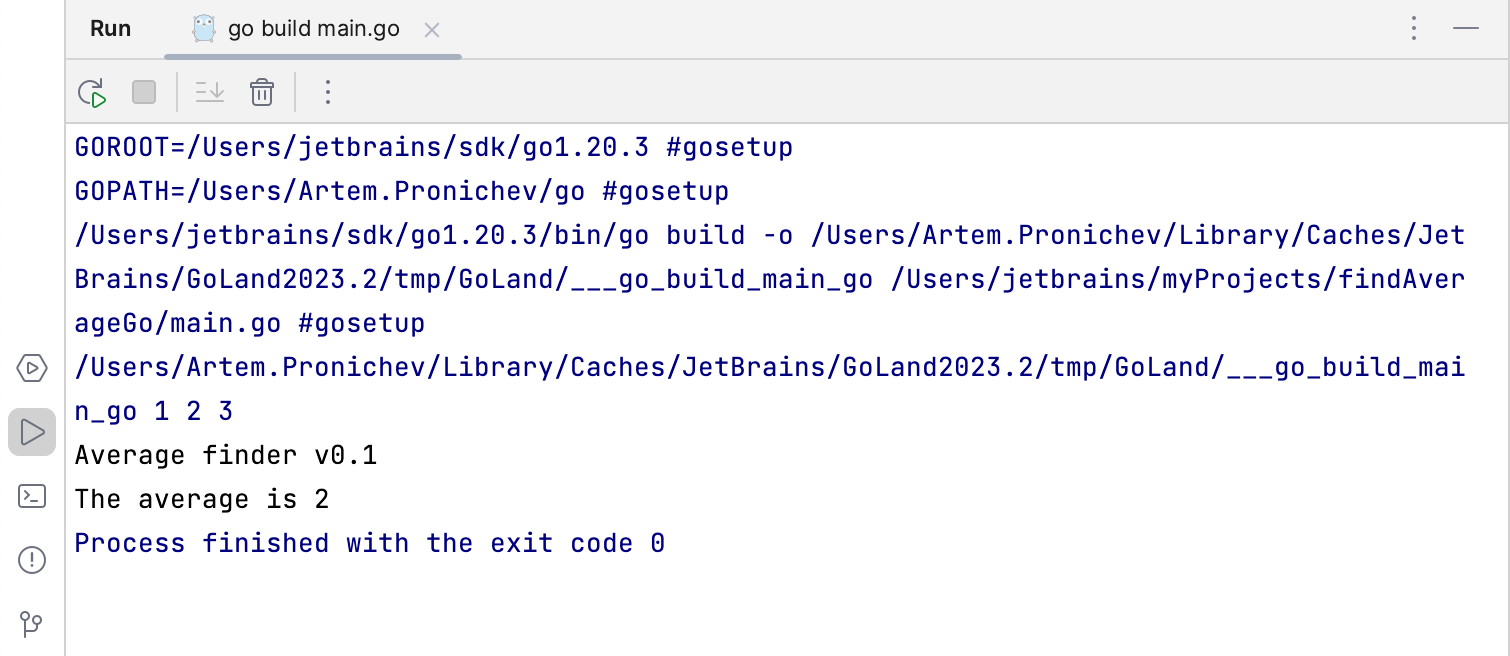
For more information about tool windows and how to manage them, see the Tool windows topic.
List of fields in run/debug configurations
The fields that appear in the right-hand pane display the default settings for the selected configuration type.
Name | Description |
|---|---|
Run kind | A building scope for your application. File and Package scopes work similarly in tests and compilation/running configurations (in terms of the scope they cover).
|
Package path | A full import path of the package that you want to compile (for example, You can press Ctrl+Space to see a list of available packages. 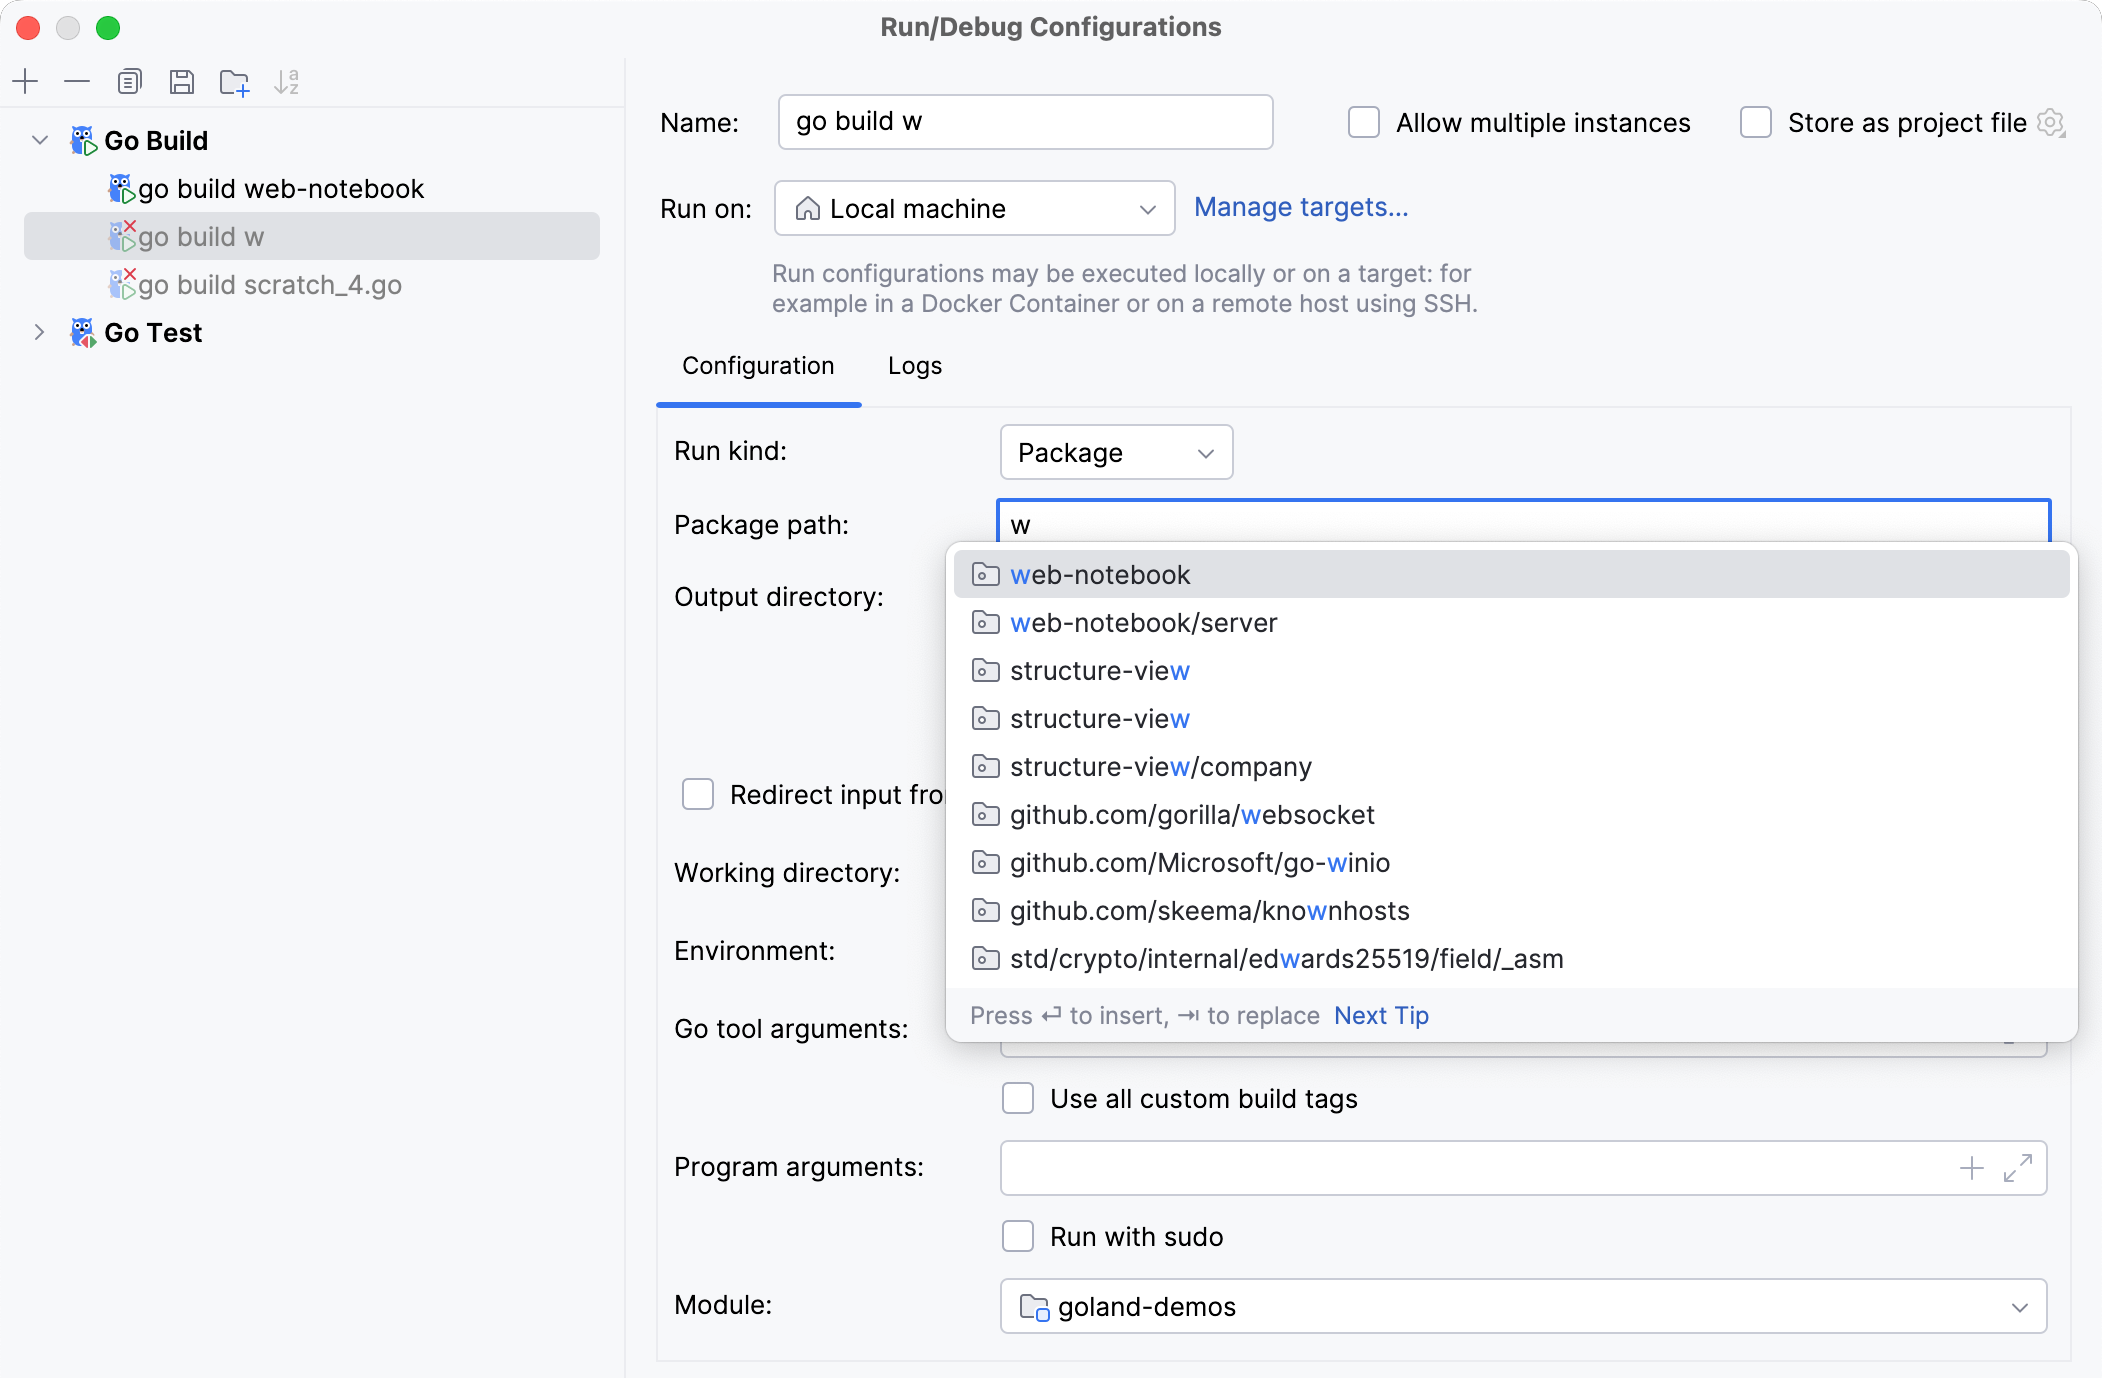 |
Output directory | A directory for the executable file. |
Run after build | Execute the application after the build. |
Emulate terminal in output console | Executes the application and displays the output in the Run tool window as it would appear in the terminal. 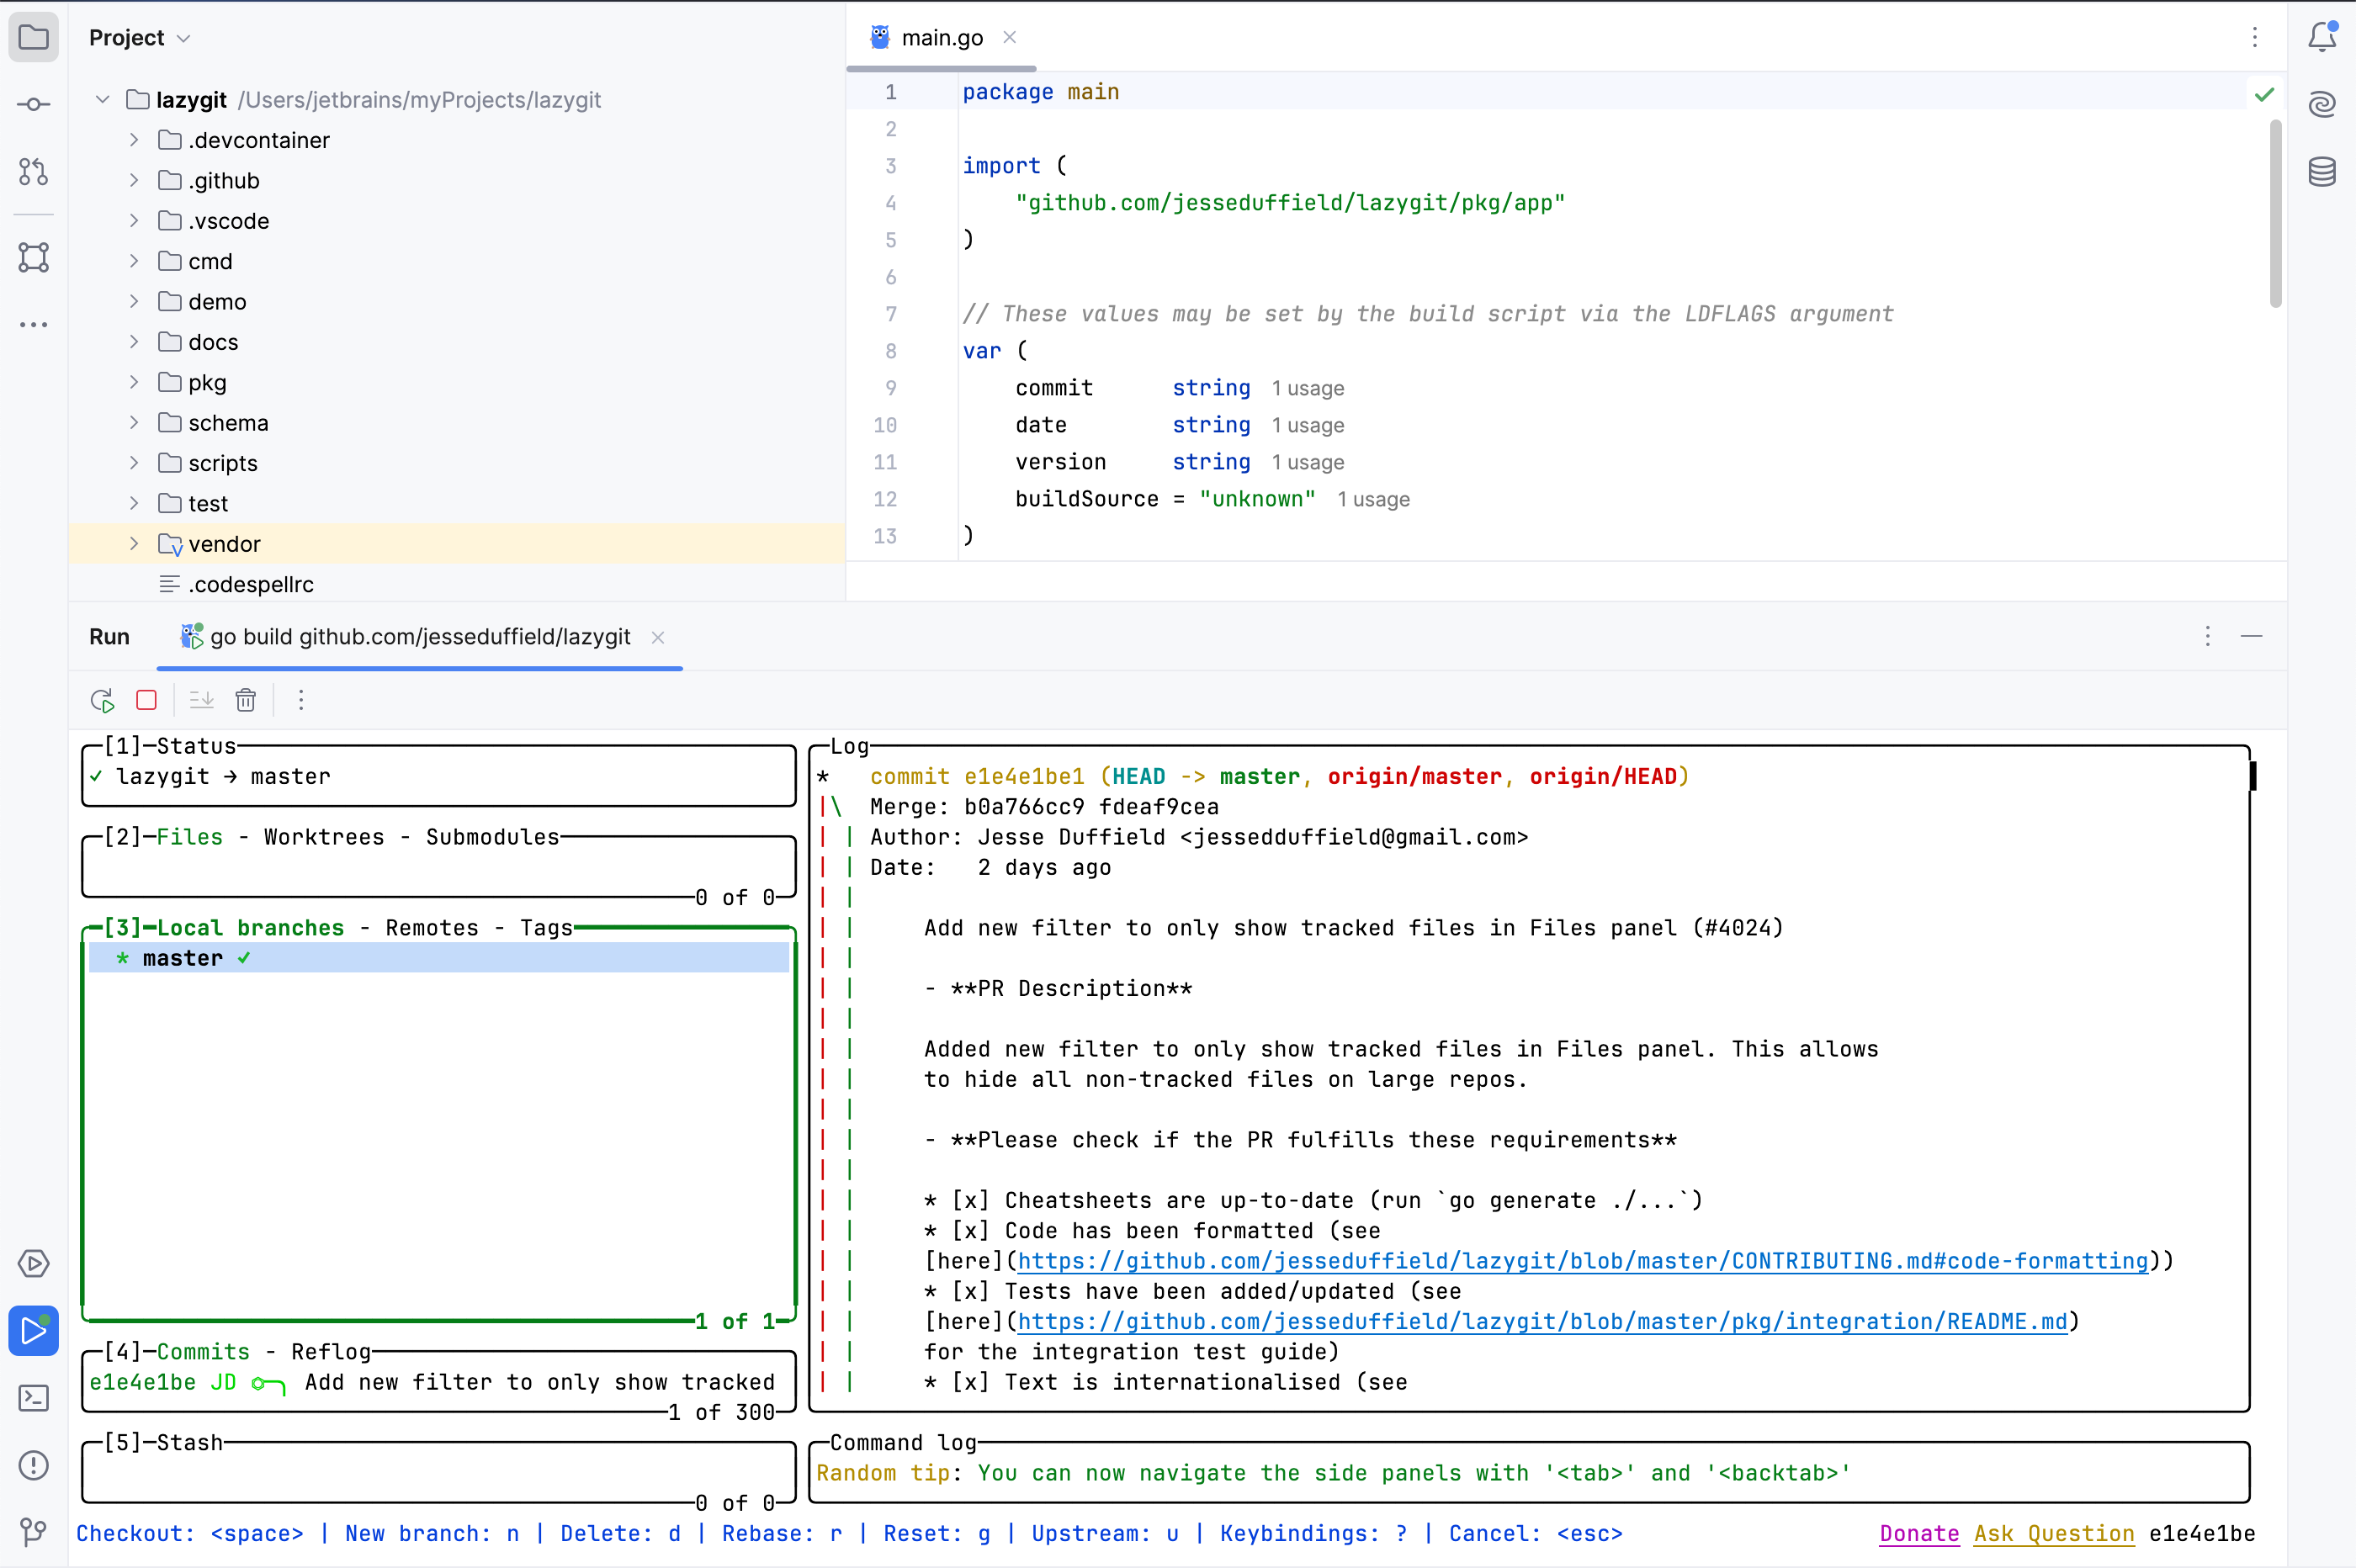 |
Working directory | Directory that is used for the built application. If you have any code that creates relative files or directories, they will be relative to this directory. |
Environment | Environment variables for your application. To edit environment variables, click the Browse button at the end of the field. In the Environment Variables dialog, click the Add button and add the environment variables that you need. 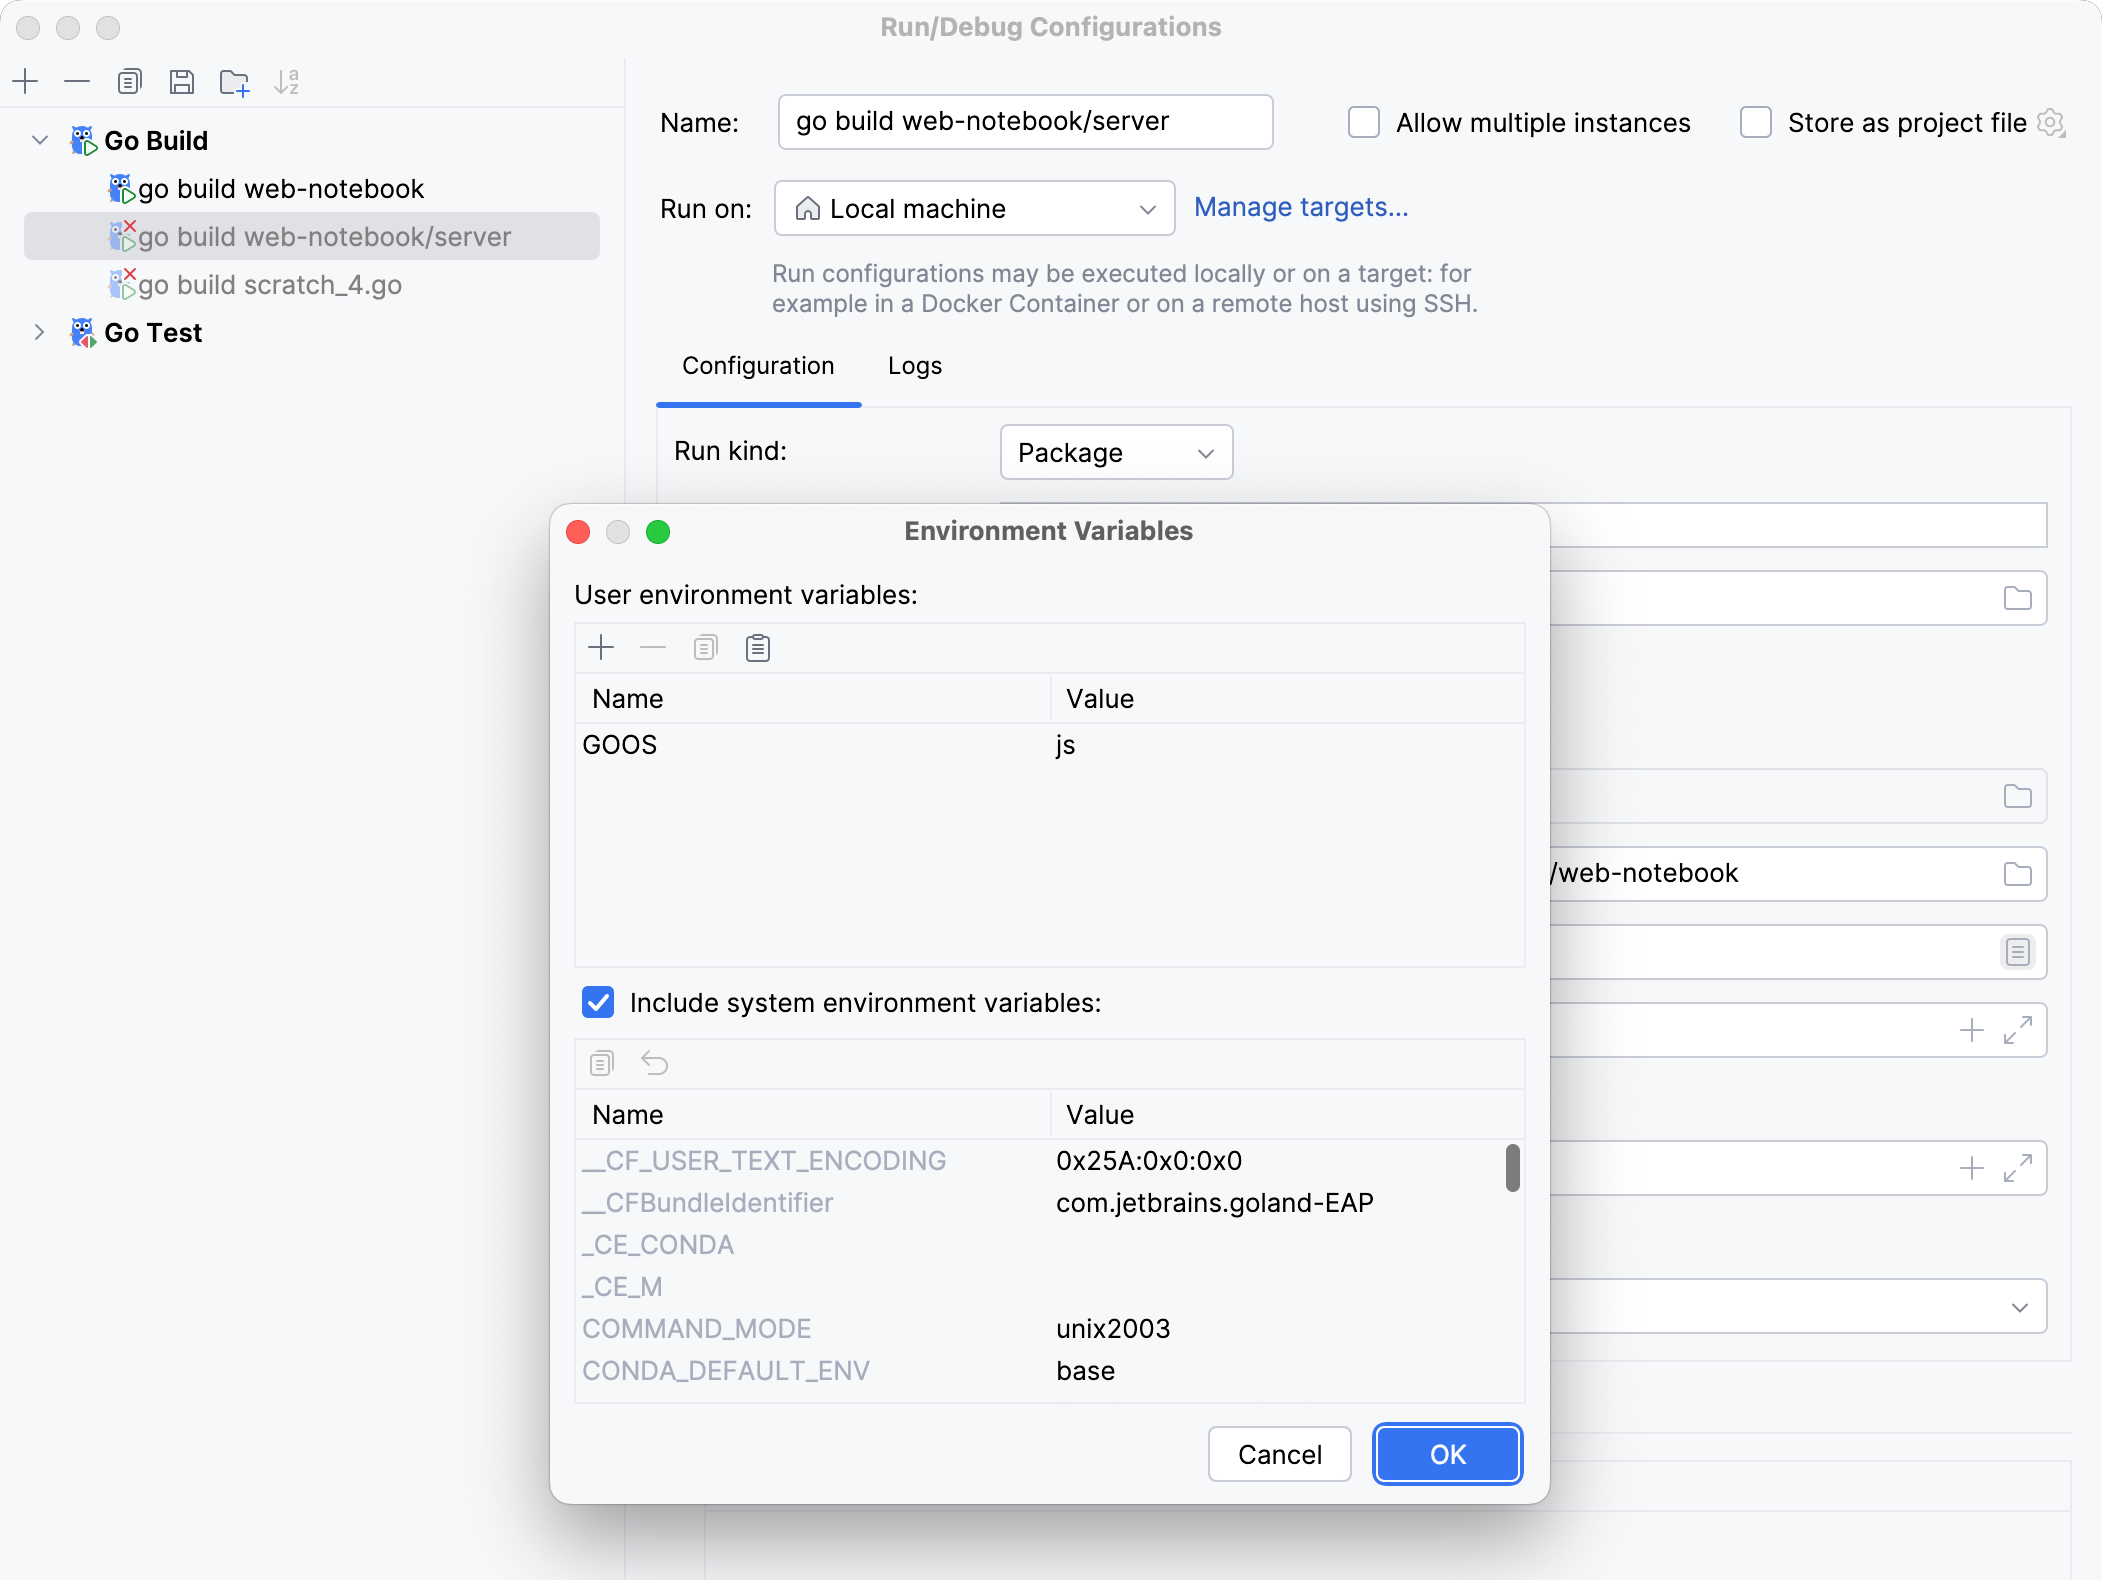 |
Go tool arguments | Arguments for the go tool (for example, |
Use all custom build tags | All tags that are applied during the build. Tags are listed in settings Ctrl+Alt+S under . For more information, refer to Build constraints and vendoring. |
Program arguments | Arguments for the built application. Also, you can use macros in this field. |
Run with sudo | Grant sudo privileges for the application. |
Module | Name of the current module. |
Before launch | Add tasks that you want to launch before the launch of the selected run/debug configuration. To add a task click the Add button Alt+Insert and select the tool that you want to add. |
Store as project file | Enable this option to save your configuration as a project file and share it with team members through VCS. |
Re-run applications
On the toolbar of the Run tool window, click
or press Shift+F10.
Run multiple tasks
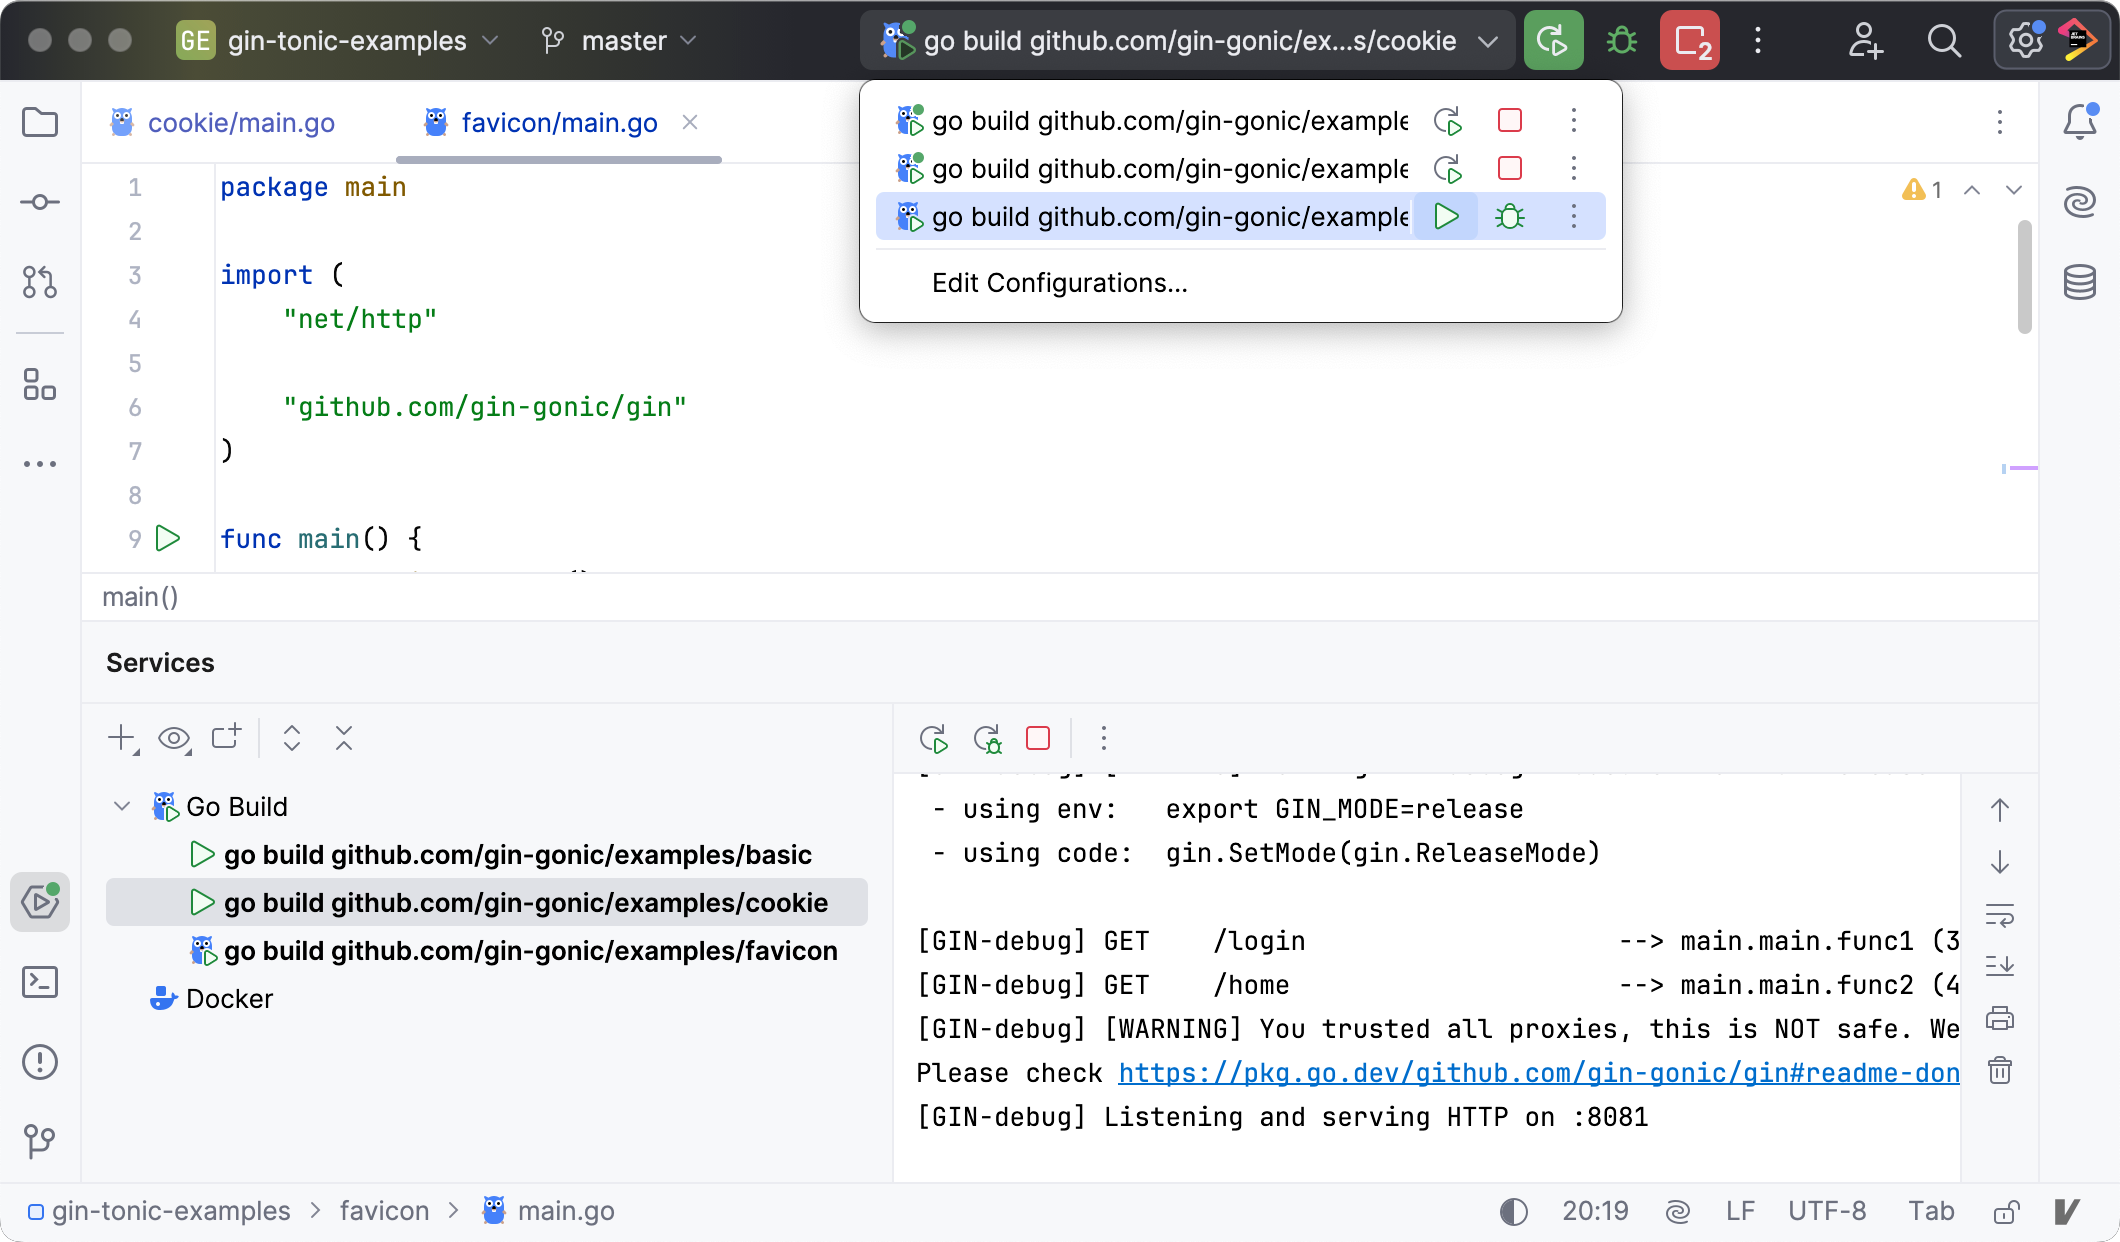
To run or debug multiple tasks simultaneously, open the run widget menu in the toolbar and select the corresponding run/debug configurations while holding down the Ctrl key.
For launching multiple tasks using a single run/debug configuration, refer to Run/debug multiple targets.
The Services tool window shows multiple go build run/debug configurations launched by a user. To hide specific configurations, such as a CLI tool, clear the checkbox for the Go Build tree item.

Stop and pause applications
When you stop a program, its process is interrupted and exits immediately. When you pause a program, it continues running in the background, but its output is suspended.
Stop a program
In the Run tool window, click
on the toolbar. Alternatively, press Ctrl+F2 and select the process to stop.
Pause the program output
Right-click in the Run tool window and select Pause Output from the context menu. Use the same toggle to resume the program.
Show running processes
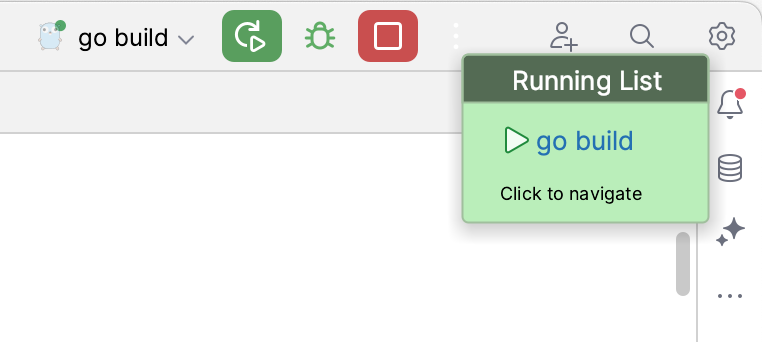
You can view the list of all active run or debug sessions and navigate between them.
Go to Run | Show Running List. In the top-right corner of the editor, GoLand shows a list with all active applications.
When you run, debug, or test your code, GoLand creates a temporary run/debug configuration. This configuration includes all the details of how you want to perform the operation. Usually, a temporary configuration is enough to run or debug your code. You can use the temporary configuration to run your application one time, or save it for future use.
Depending on your purposes, you can edit existing or create new configurations. For more information about editing you configurations, refer to Run/debug configurations.
You can review the output from your running applications in the Run tool window. The output from each application is displayed in its own tab, named after the corresponding run/debug configuration.