Start the debugger session
Starting a debugger session is very similar to running the program in normal mode. The debugger is attached behind the scenes, so you don't have to configure anything specific to start a debugger session. If you are able to run your program from GoLand, you will also be able to debug it using the same configuration.
Each time you debug a program, the debugger session is based on a run/debug configuration. It allows you to configure parameters and actions for launching the application. For example, you can specify to build the application every time you start a debugger session or use the previously compiled code.
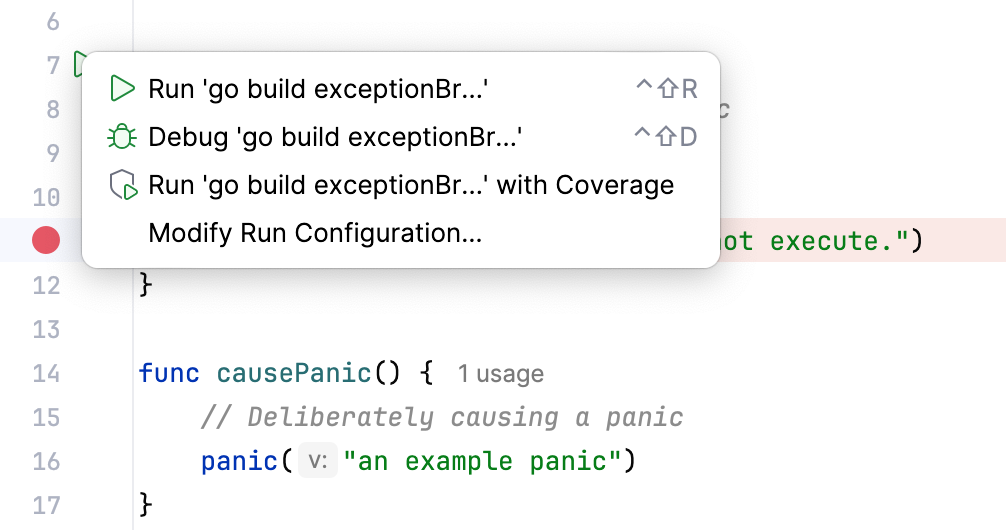
To run the program from an entry point, such as the main() method or a test, click Run
icon in the gutter near it and select Debug.

This will create a temporary run/debug configuration for you. After that, you can customize and save this temporary configuration if needed. This is the quickest way to debug your program without configuring the startup parameters.
If you already have a run/debug configuration, select it in the run widget, then click Debug or press Shift+F9.

To launch a debug session for an existing run/debug configuration from the editor, press Alt+Shift+F9 and select it from the menu.
Pause and resume a debugger session
When the debugger session is running, you can pause/resume it using the buttons on the toolbar of the Debug tool window:
To pause a debugger session, click
.
To resume a debugger session, click
F9.
Terminate a debugger session
Click
in the Debug tool window.
Alternatively, press Ctrl+F2 and select the process to terminate (if there are two or more of them).
Debug multiple tasks
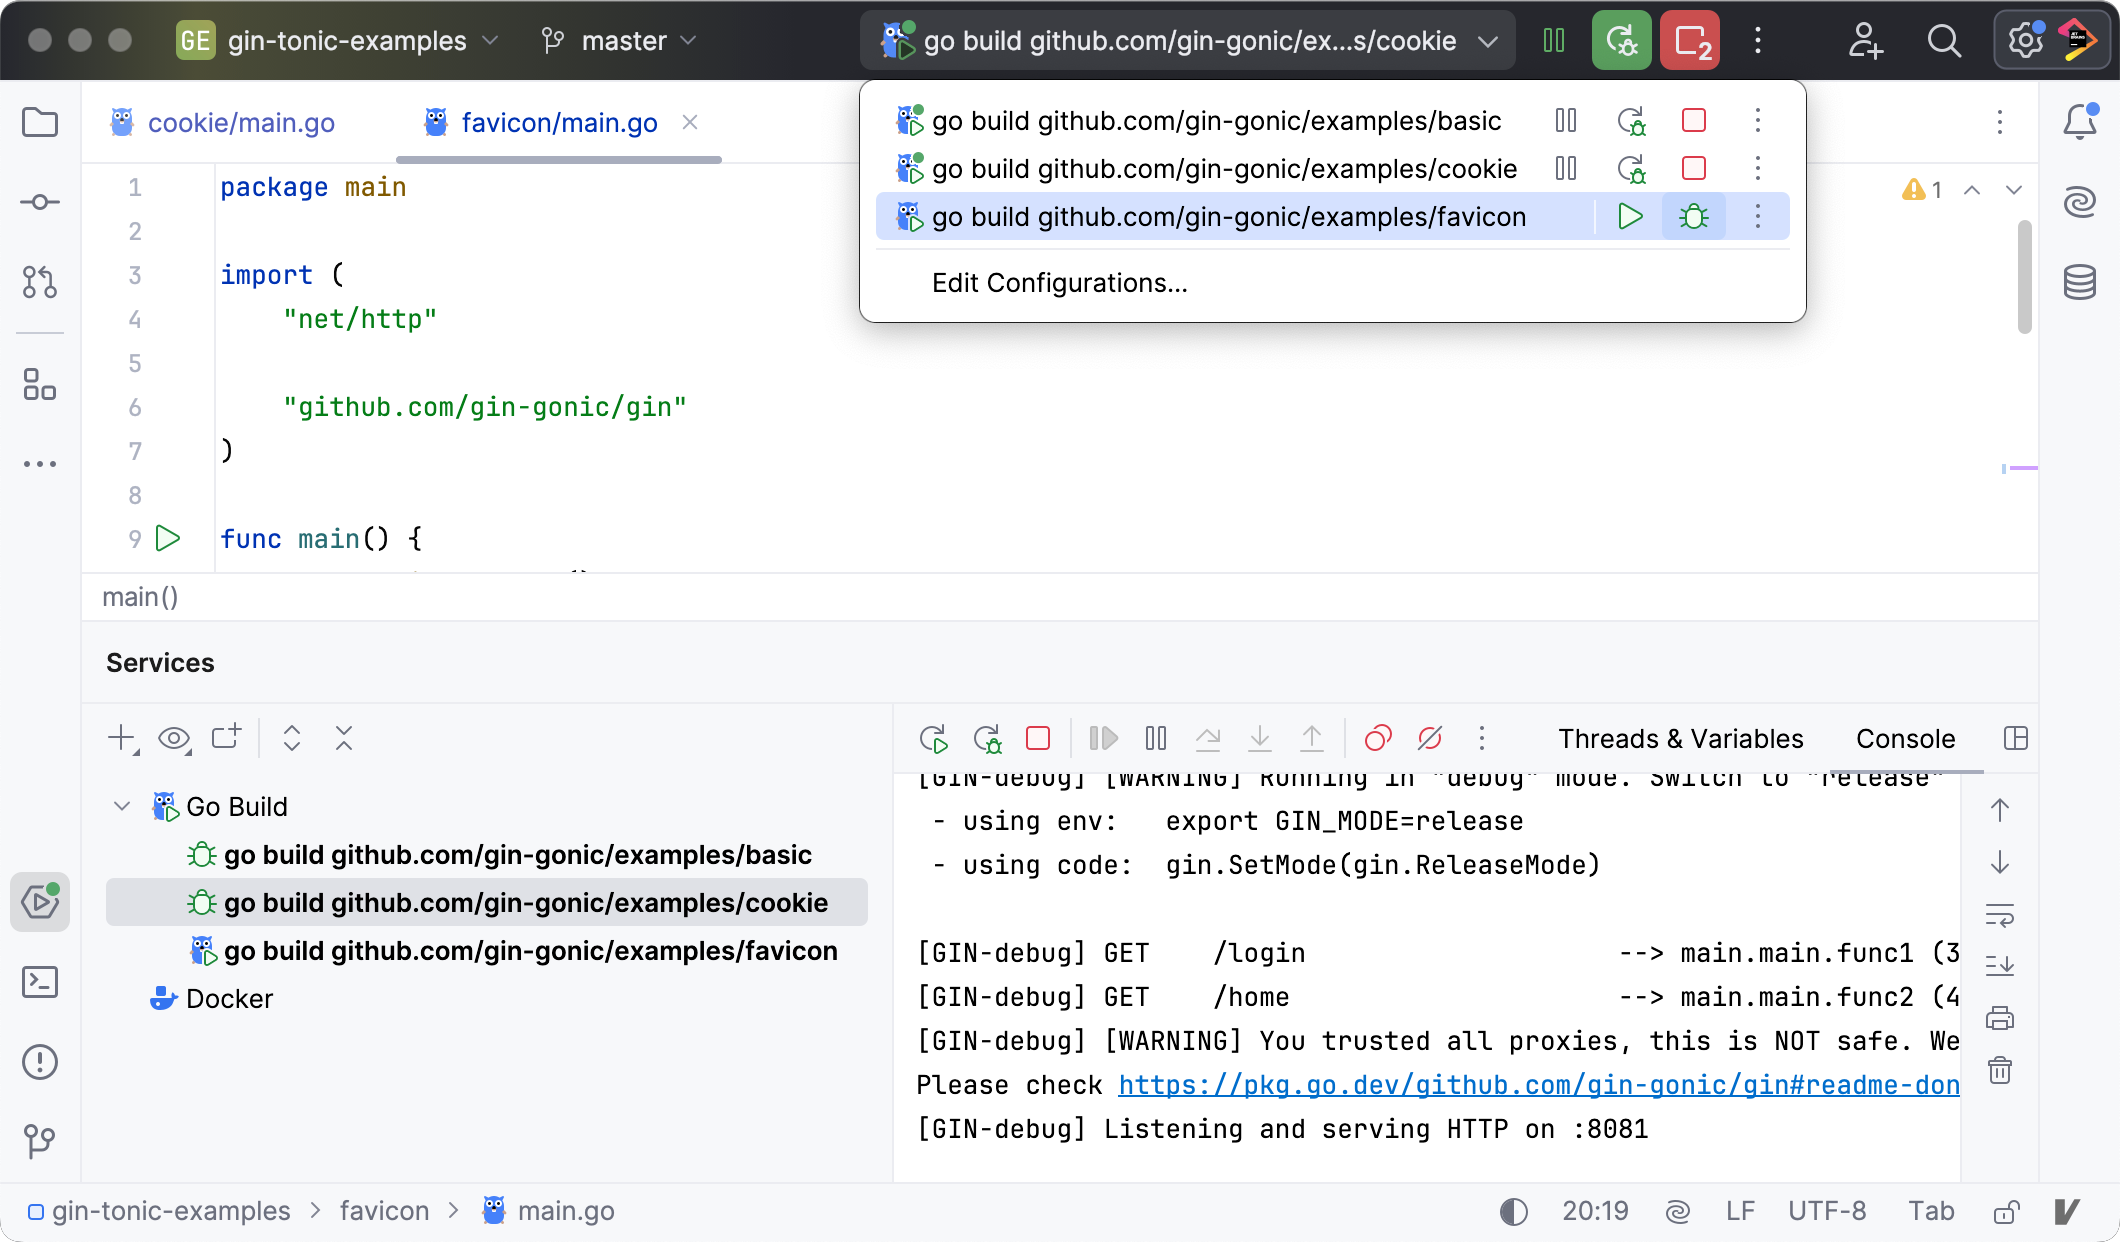
To run or debug multiple tasks simultaneously, open the run widget menu in the toolbar and select the corresponding run/debug configurations while holding down the Ctrl key.

For launching multiple tasks using a single run/debug configuration, refer to Run/debug multiple targets.
The Services tool window shows multiple go build run/debug configurations launched by a user. To hide specific configurations, such as a CLI tool, clear the checkbox for the Go Build tree item.

Before debugging
Set breakpoints in the source code.
If necessary, create or modify the corresponding Run/Debug configuration.
The debug session starts with the selected run/debug configuration. Note that several debug processes can be launched simultaneously.