YouTrack Widgets
When YouTrack is connected as a service in Hub, the following widgets are available for use on your dashboards.
Issues List Widgets
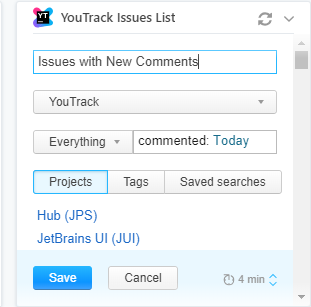
An issues list widget displays a list of issues that match a search query, saved search, project, or tag.
To add an issue widget to the dashboard:
Click the Add widget button on the dashboard.
From the drop-down list, select YouTrack Issues List.
Enter an optional widget title.
If your Hub instance is connected to multiple YouTrack servers, select a YouTrack service to use as the data source for the widget.
- Configure the widget by performing one of the following actions:
Select a context (optional) and enter a search query in the input field.
Select a project on the Projects tab.
Select a tag on the Tag tab.
Select a saved search on the Saved Search tab.

Set the refresh rate for the widget. The default refresh rate is 4 minutes.
- Click the Create widget button
The issue widget is added to the dashboard.
If you didn't specify a title, the title of the card is set to the selected search query, saved search, project, or tag.
When you click the title of the widget, YouTrack displays the issue list with the results of the search query configured for the widget.
The widget content is refreshed according to the custom refresh rate, when set. Otherwise, the widget is refreshed every 10 minutes. To manually refresh an issue widget, click the refresh icon in the title bar.
Report Widgets
A report widget displays the calculation of a predefined report. You can only add a report widget for an existing YouTrack report. You can add report widgets for the reports that you have created or that have been shared with you.
If there are no reports available, click the Create new report link to open YouTrack and create a report.
Report widgets support all of the report types that can be created in the Reports area in YouTrack with the exception of the Gantt Chart. Reports that are displayed as charts on an agile board are not supported, however, you can create separate Burndown and Cumulative Flow reports with similar settings and add them to your dashboards.
To add a report widget to the dashboard:
Click the Add widget button on the dashboard.
- From the drop-down list, select Report.
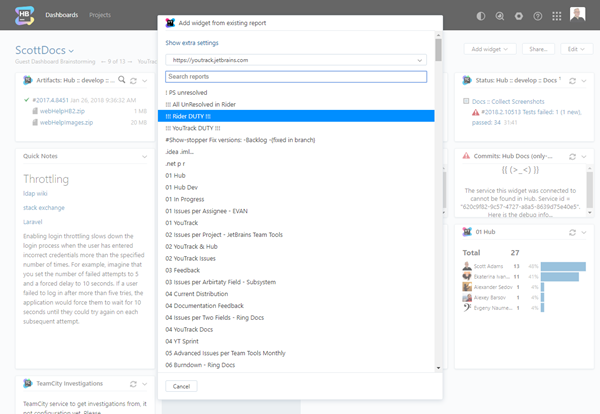
A card is added to the dashboard with the title Add widget from existing report.
- Click the link to expand the extra settings. The following options are available:
Enter an optional widget title.
Set a custom refresh rate for the widget, in seconds. The default refresh rate for a report widget is 10 minutes (600 seconds).
If your Hub instance is connected to multiple YouTrack servers, select the YouTrack service to use as the data source for the widget.
- Select a report on the card. To limit the list of reports, enter text in the input field.

The report widget is added to the dashboard.
If you didn't specify a title, the title of the card is set to the name of the selected report.
If you want to add a report that is not available in the reports list of the widget, create the report in YouTrack.
The widget content is refreshed according to the custom refresh rate, when set. Otherwise, the widget is refreshed every 10 minutes.
For reports widgets, this action does not always recalculate the report. The report is recalculated according to the report parameters. For example, if a report is set to recalculate daily, the report widget is refreshed every 10 minutes. When the report is recalculated according to the report parameters, the widget displays the updated report the next time the widget is refreshed.
For 'quick reports' that do not have recalculation settings, the report is recalculated when the widget is refreshed. For these reports, click the refresh icon in the title bar to recalculate the data.