Troubleshooting
Last modified: 30 January 2025If you stumble upon a problem while working with IDE Services, make sure to contact the IDE Services support team. If possible, we recommend including the following information in your report:
Screenshots or a screencast demonstrating the problem in the user interface
Logs from the Toolbox App and your IDE
A tbe_diagnostics.json file from your IDE
Logs and diagnostic data
Collect Toolbox App logs
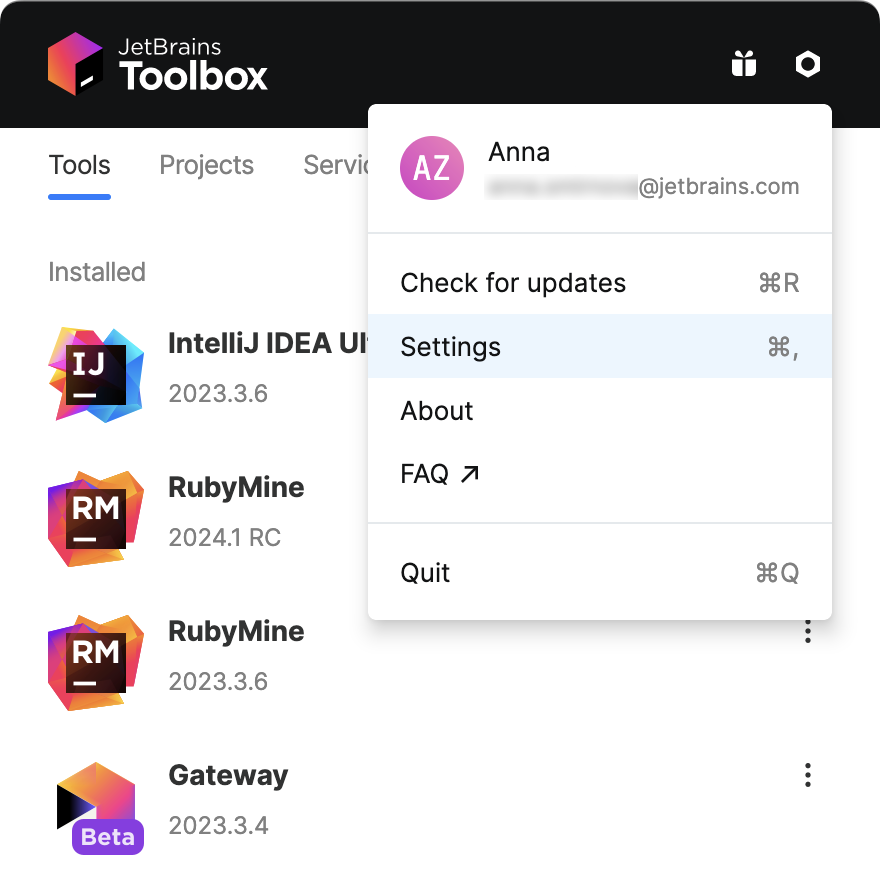
In the Toolbox App, click the locknut icon in the upper right corner and select Settings .
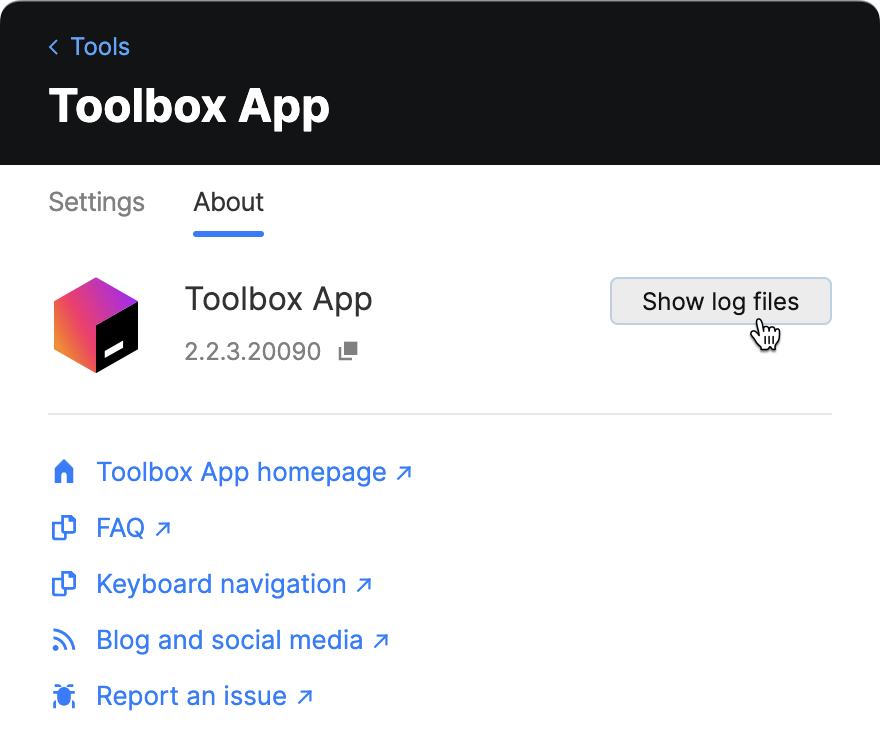
Navigate to the About tab and click the Show log files button.
As an alternative, you can find Toolbox App logs in your file system:
macOS:
~/Library/Logs/JetBrains/Toolbox/Windows:
<SYSTEM_DRIVE>\Users\<USER_ACCOUNT_NAME>\AppData\Local\JetBrains\Toolbox\logsLinux:
~/.local/share/JetBrains/Toolbox/logs/
Collect IDE logs
The log file is called idea.log and is rotated based on its size. When submitting an issue, it's recommended to zip and attach the most recent log files.
Navigate to the product log file from the IDE
From the main menu, select Help and choose one of the following menu items:
Show Log in Explorer (for Windows and Linux)
Show Log in Finder (for macOS)
tip
You can also select Help | Collect Logs and Diagnostic Data to generate a ZIP file with all the log files, including build logs and automatic thread dumps.
As an alternative, you can find IDE logs in your file system:
macOS:
~/Library/Logs/JetBrains/<IDE_NAME_AND_VERSION>Windows:
%LOCALAPPDATA%\JetBrains\<IDE_NAME_AND_VERSION>\logLinux:
~/.cache/JetBrains/<IDE_NAME_AND_VERSION>/log
Collect IDE Services diagnostic data in IDEs
In your IDE, press Shift twice to open the Search Everywhere dialog.
Start typing
Collect JetBrains IDE Services Diagnostics Dataand select the action from the list.
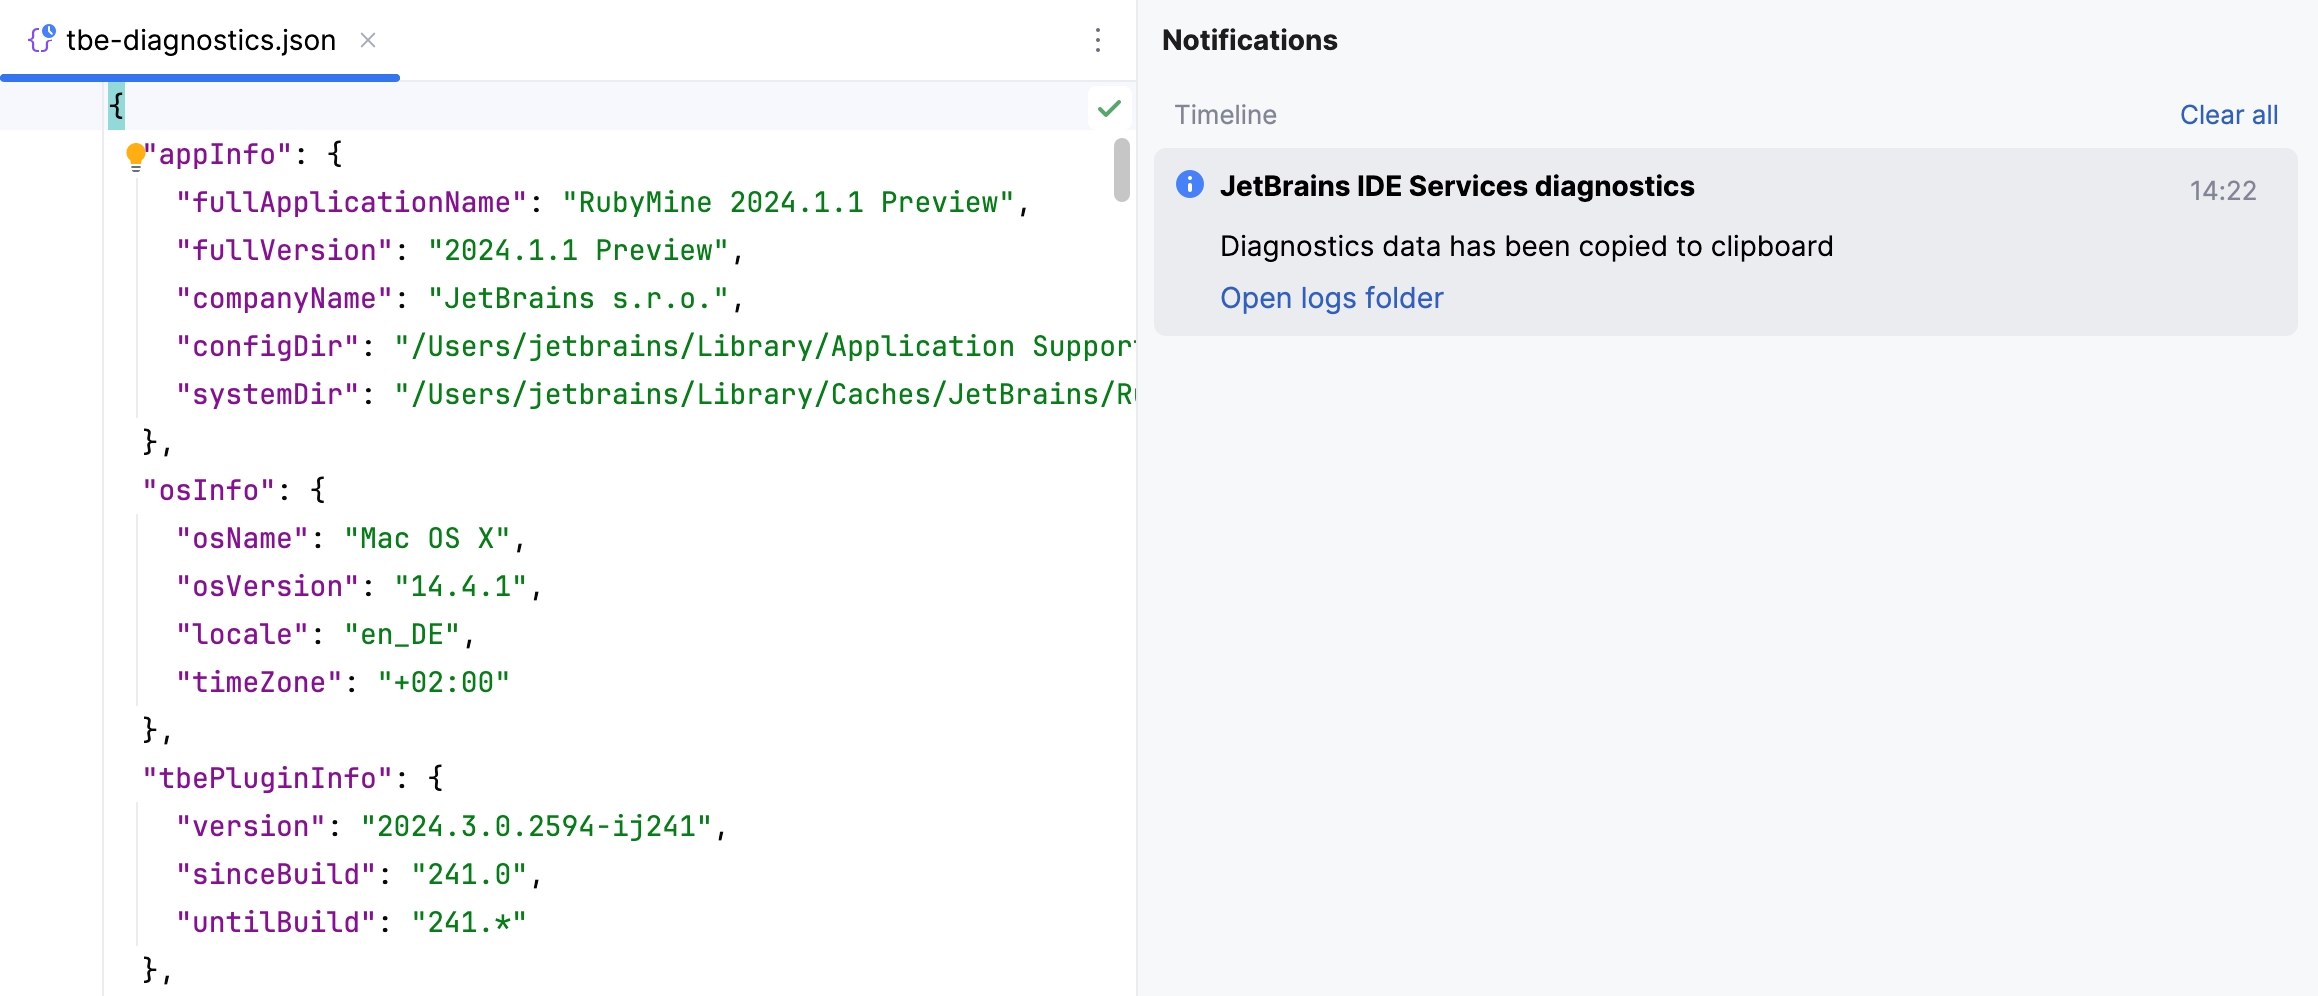
Your IDE will create a scratch tbe-diagnostics.json file, open it in the editor, and copy its contents to the clipboard.
Server public key
View the server public key
In case of activation or licensing problems, the IDE Services support team may ask you to provide the public key of your IDE Services Server.
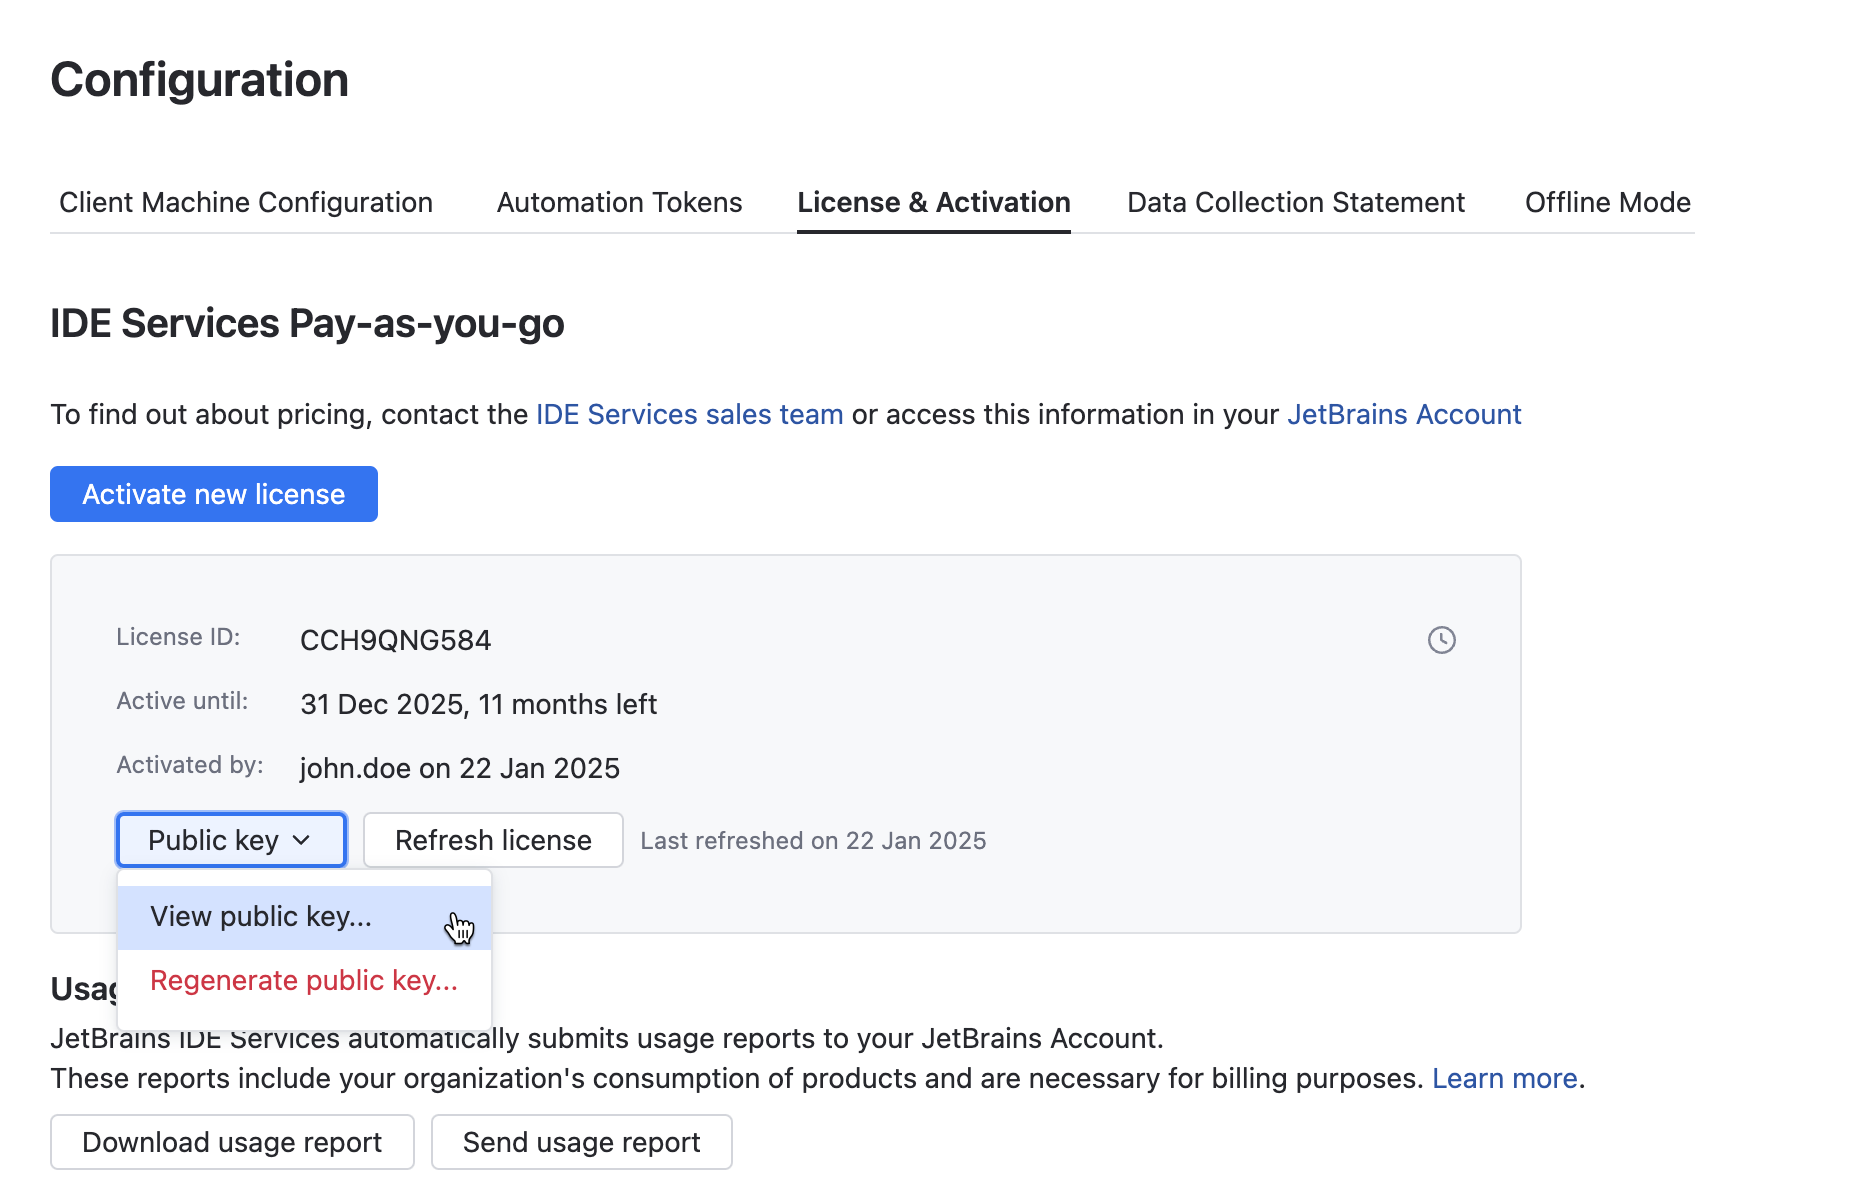
In the IDE Services Web UI, navigate to Configuration | License & Activation.
Click Public key | View public key.
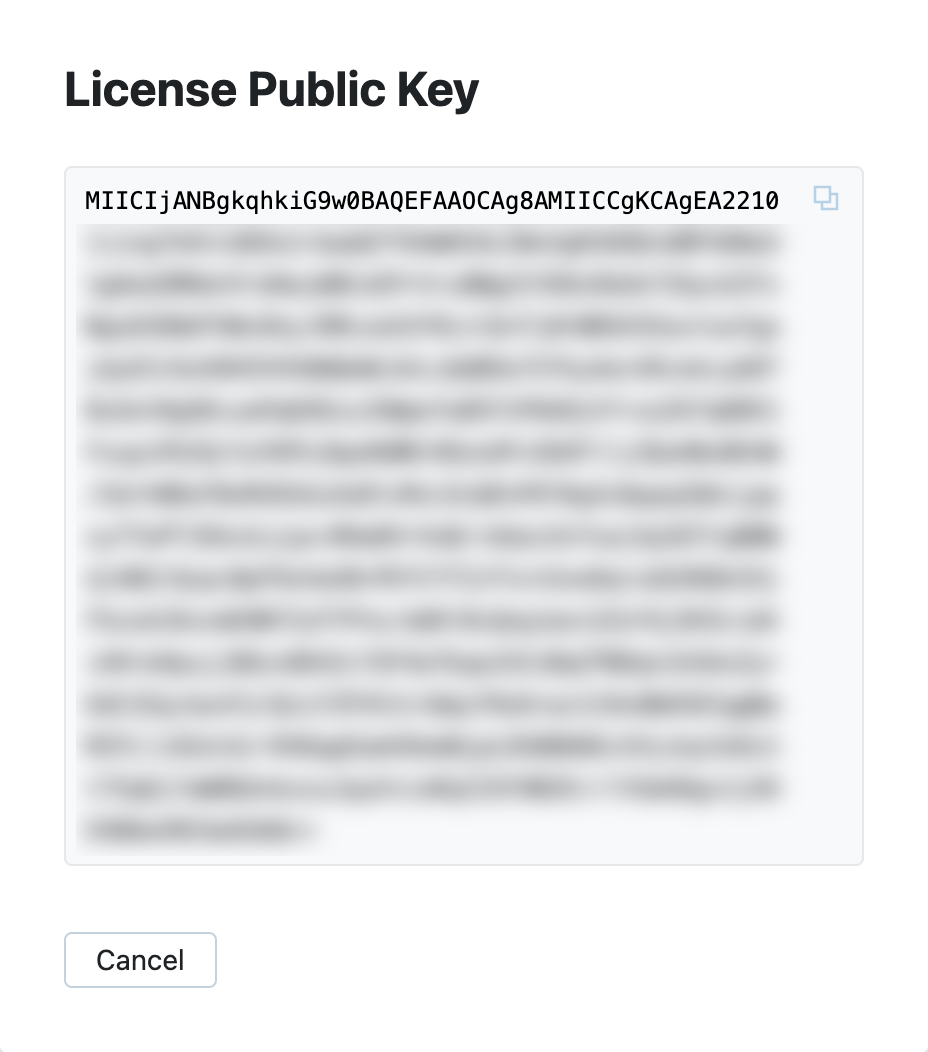
Copy the key from the License Public Key dialog.
Regenerate a server public key
warning
Regenerating a server public key results in losing all current license configurations and requires IDE Services re-activation. The server will turn into an inactive state, which means that it will stop functioning until activated again. Only proceed with this action if the IDE Services support team has specifically asked for it.
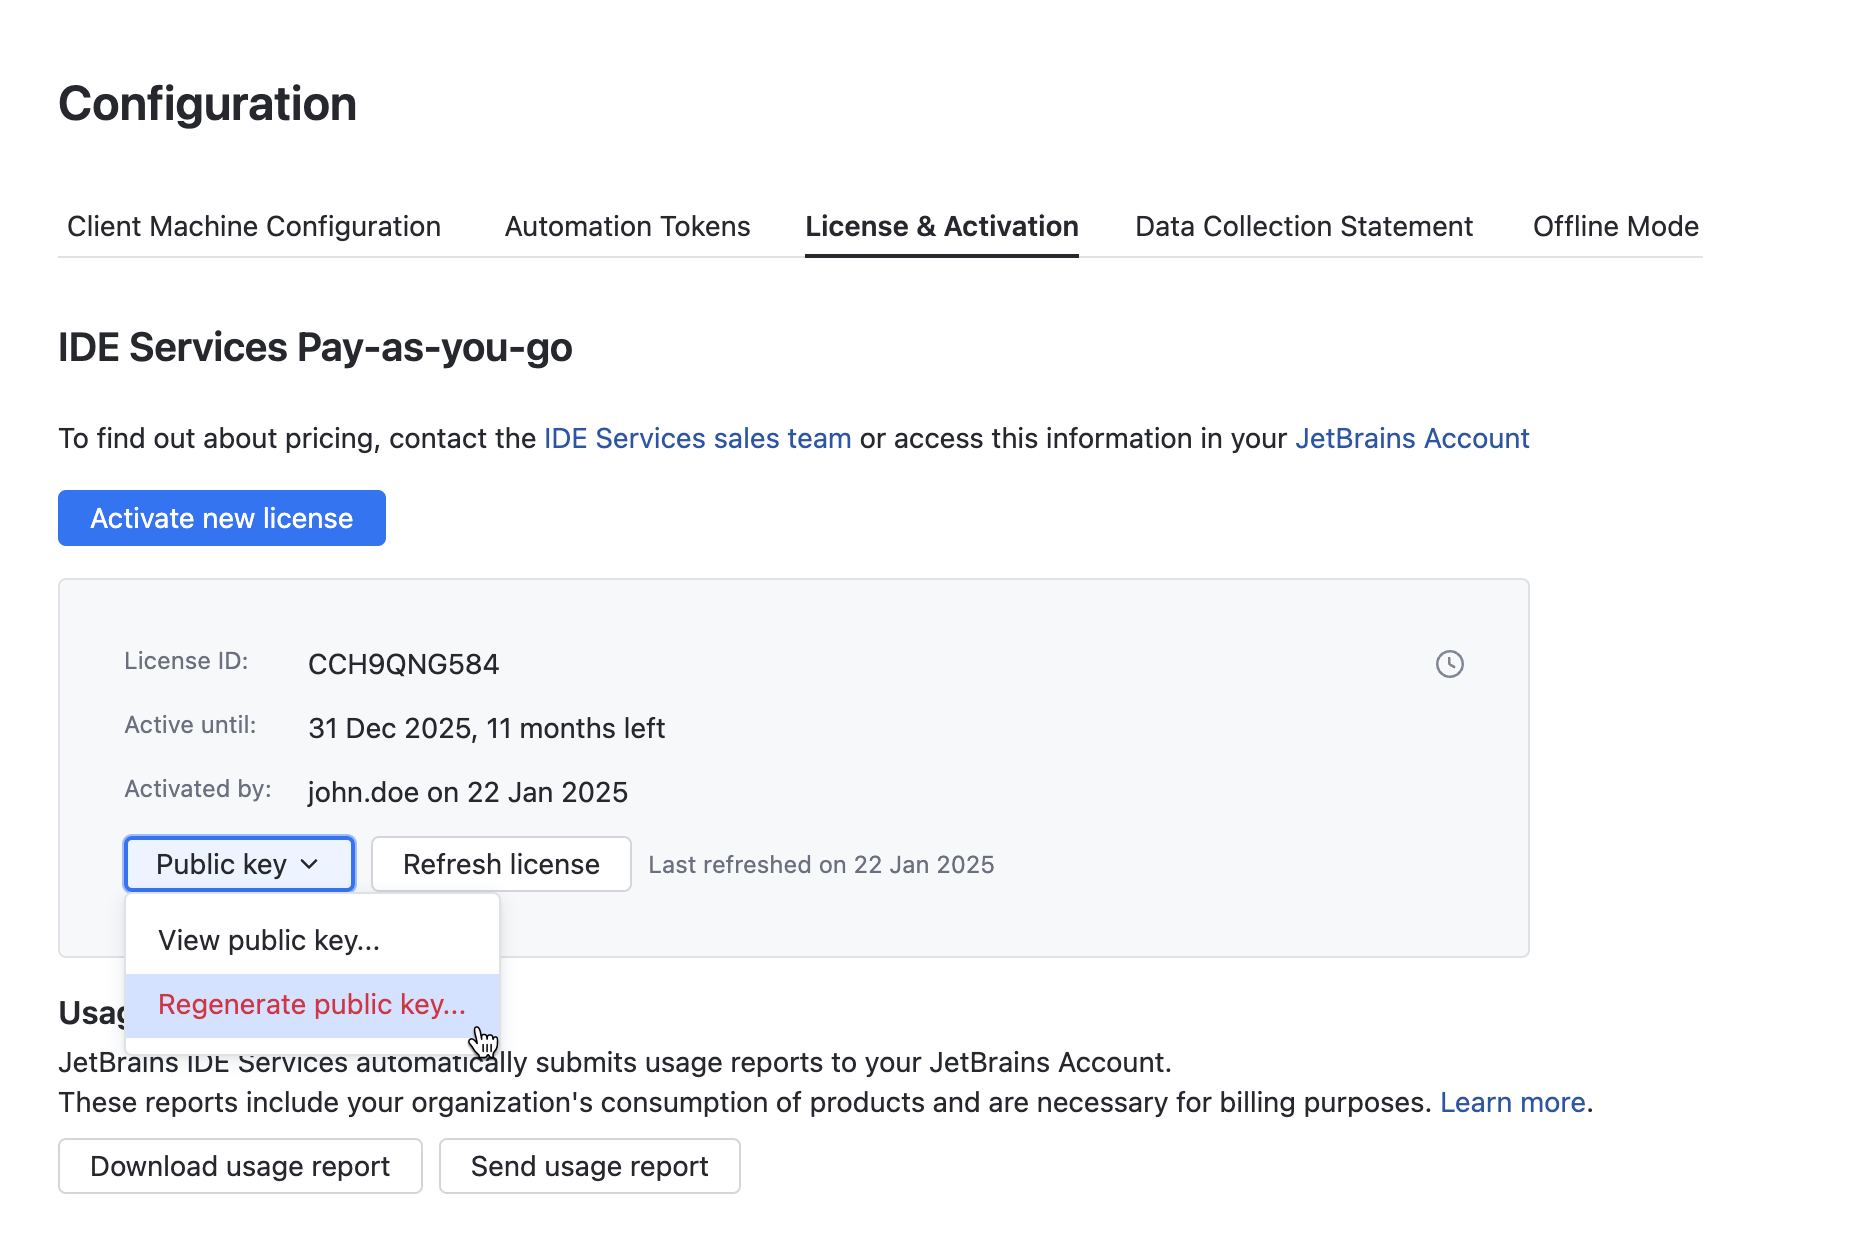
In the IDE Services Web UI, navigate to Configuration | License & Activation.
Click Public key | Regenerate public key.
In the Generate New Public Key dialog, confirm that you understand the effects of generating a new public key and have contacted the support team.
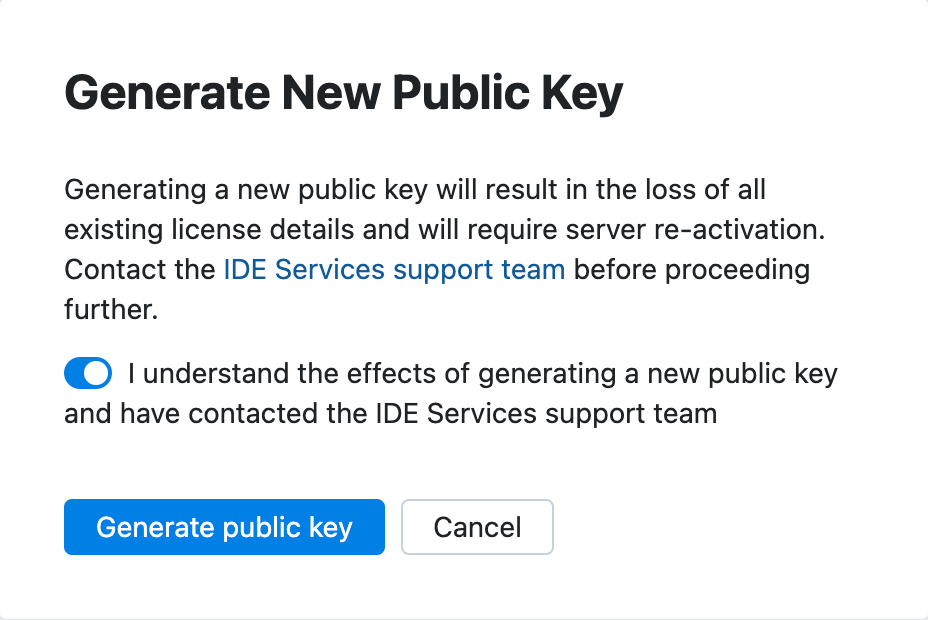
Click Generate public key.