Compare profiler snapshots
IntelliJ IDEA allows you to compare profiler snapshots. This may be useful to see how a certain change in the code affects performance or how the same piece of code performs in different runtimes.
Open two snapshots for comparison
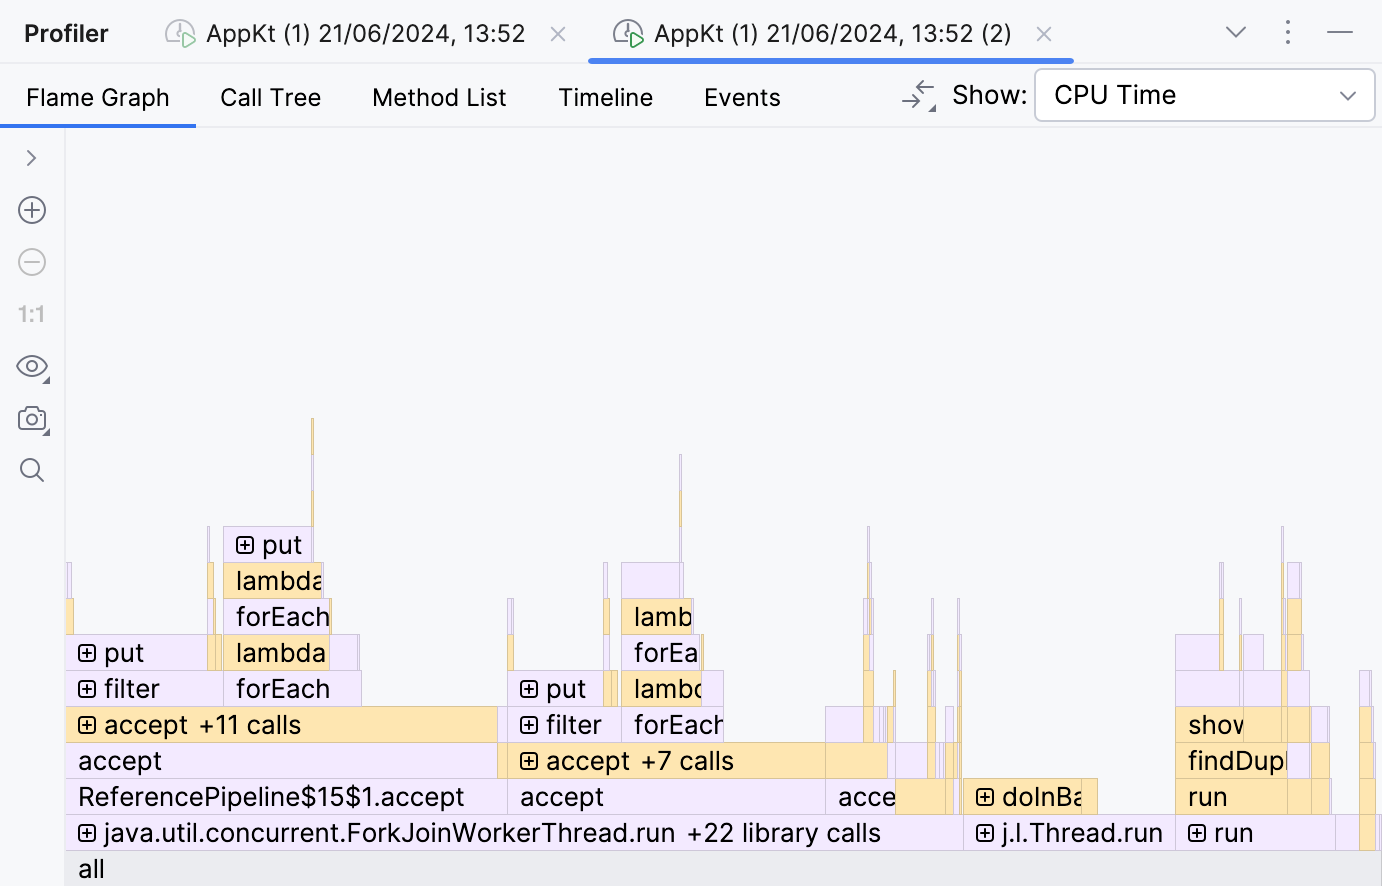
Open the two snapshots that you are going to compare and select one of them.
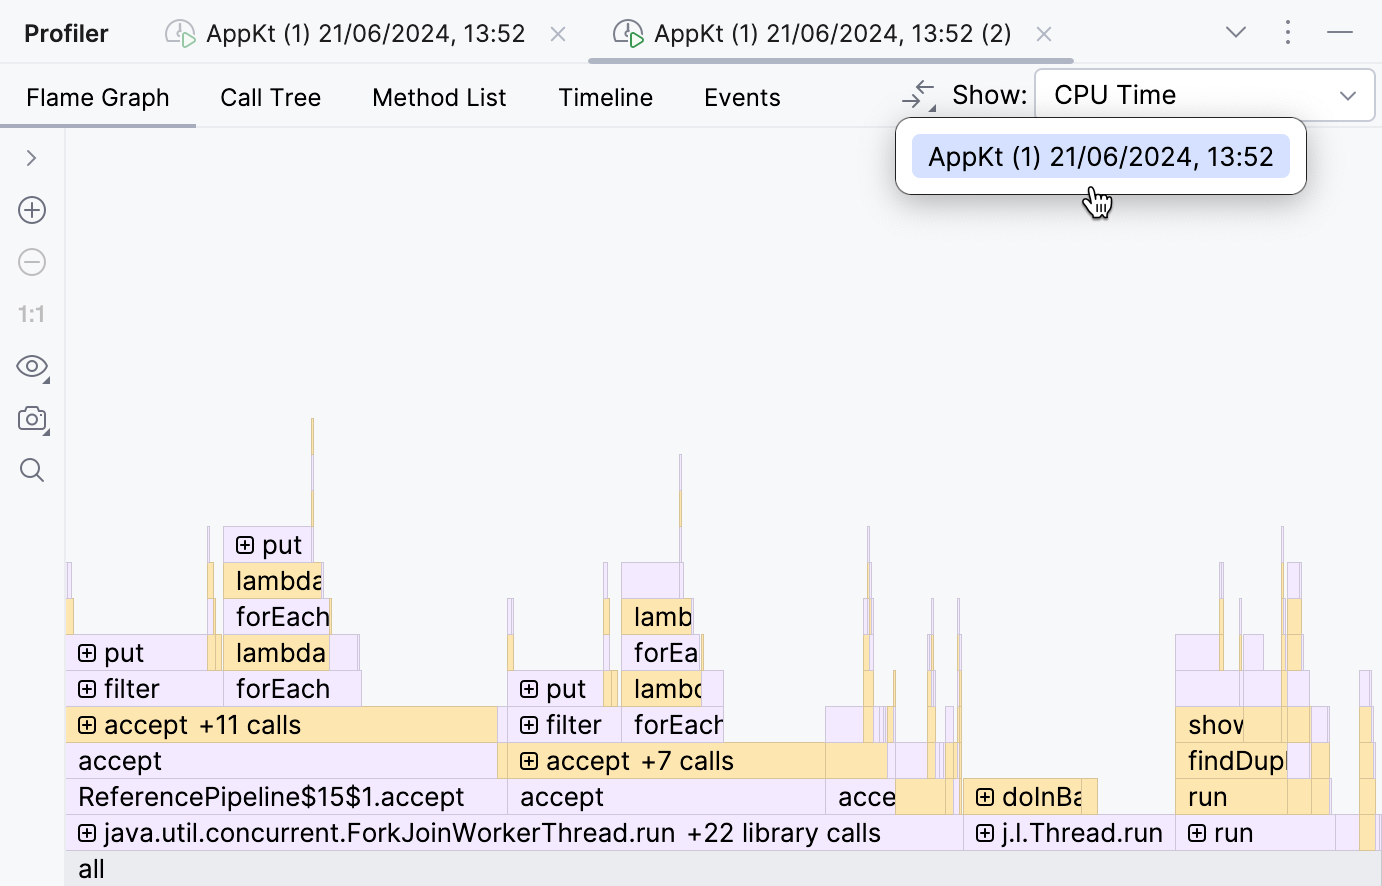
In the right-hand part of the toolbar, click Compare With Baseline, then select the other snapshot.
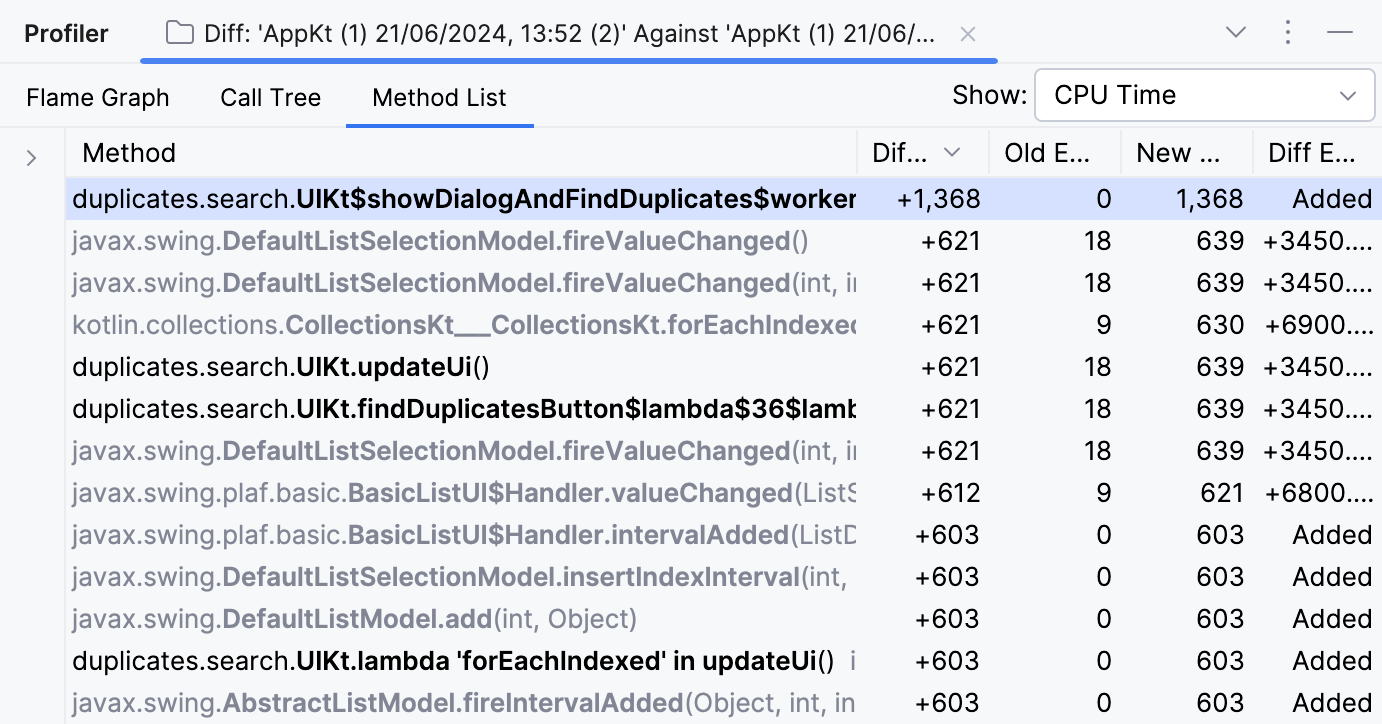
For comparison, you can use the flame graph, the call tree, or the method list. In the comparison mode, the tabs offer their regular functionality while additionally showing how the two snapshots differ in terms of each entry (for example, a tree node or a method list item).
Let's look at the flame graph.
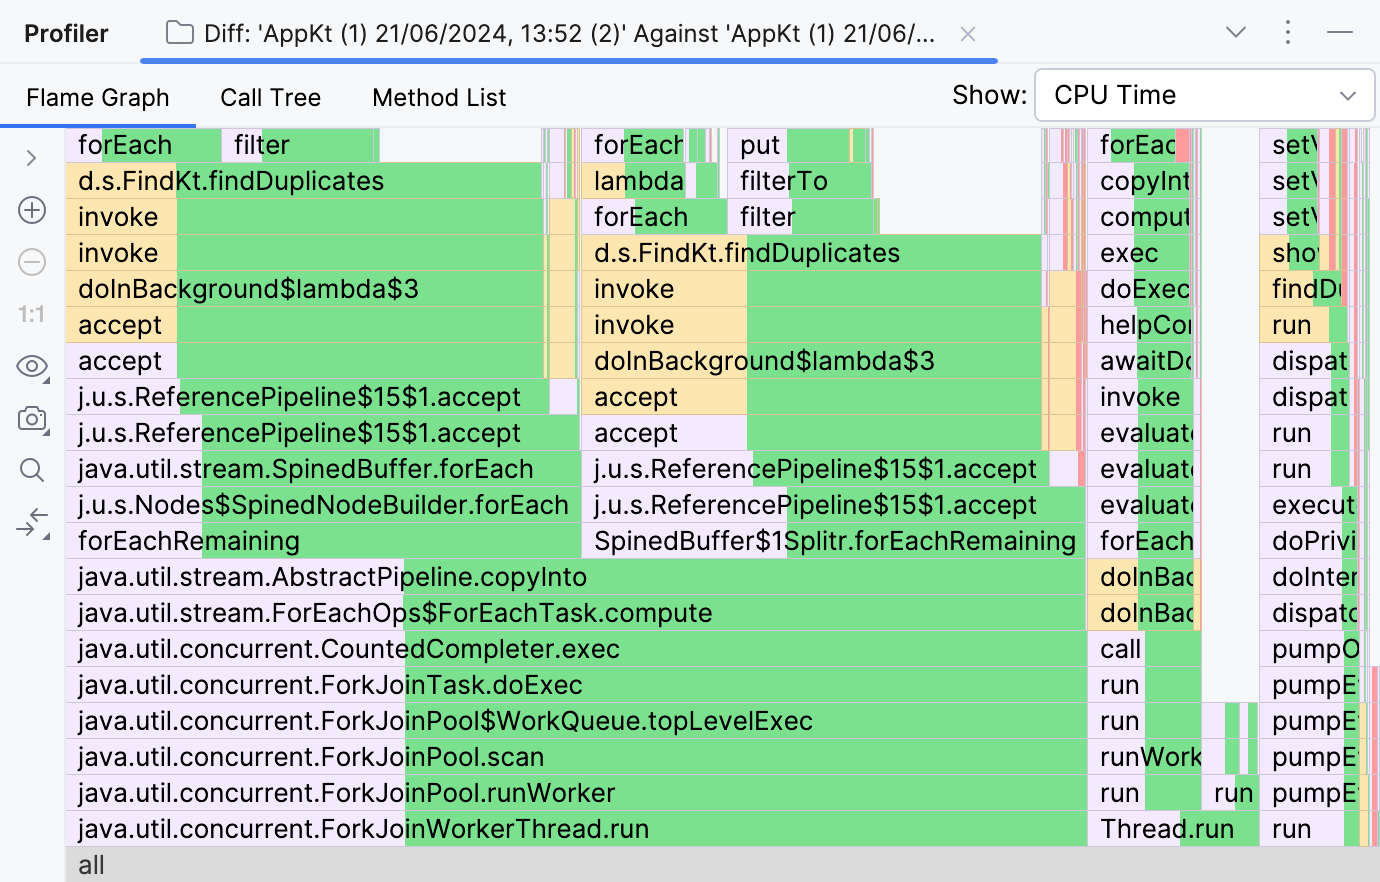
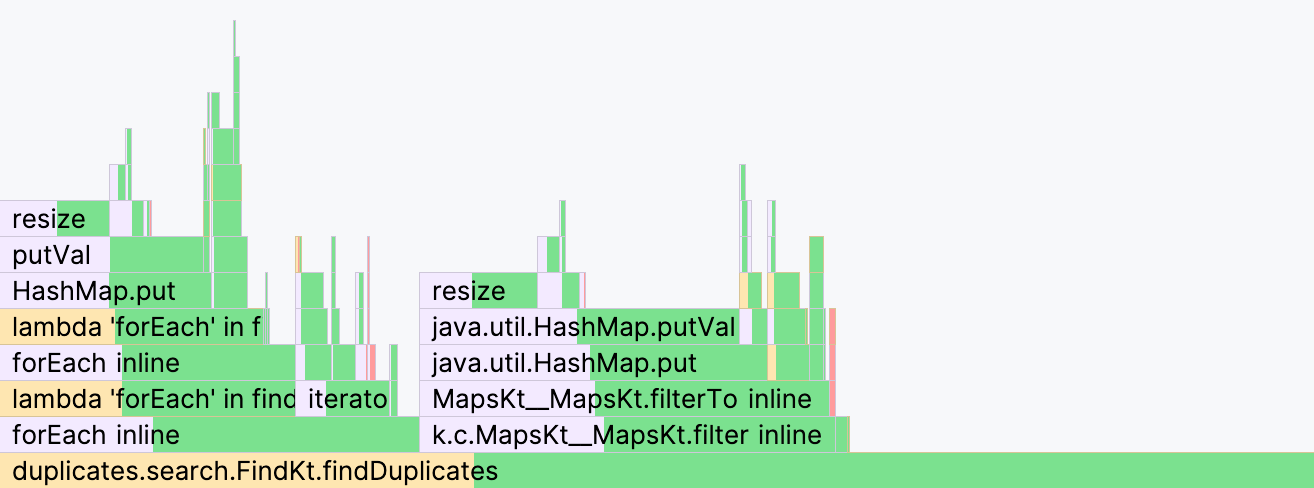
Where a part of a frame is green, it means that this frame had less execution time in the second snapshot. If its entire frame is green, it means that the frame is completely absent from the second snapshot. A red color means that the frame had more samples in the second snapshot and more execution time, accordingly.
For example, the following section of the graph tells us that the findDuplicates() method became more than twice as fast, and that this was because of reduced time spent in forEach and filter. This doesn't necessarily mean, however, that the implementation has improved. This might also be attributed to the possibility that the method had a different amount of data to process in the second run.
