Introduction to CPU and allocation profiling
This topic describes the basic concepts of CPU and allocation profiling. These concepts will help you understand how IntelliJ Profiler works.
How IntelliJ Profiler works
For CPU and allocation profiling, IntelliJ IDEA provides integration with the following profilers:
Java Flight Recorder – a standard profiling tool shipped as part of the JDK.
Async Profiler – a very accurate profiler that can also collect native call and memory allocation data.
By default, IntelliJ IDEA runs both profilers in parallel to provide the most accurate results. While it is possible to use the supported profilers separately, the combined configuration that you get out of the box is a better choice for most scenarios. This approach leverages the advantages of both profilers and abstracts you from any setup whatsoever unless you have very specific requirements.
IntelliJ Profiler collects both CPU and allocation profiling data. Here's the brief explanation of what this means.
CPU profiling
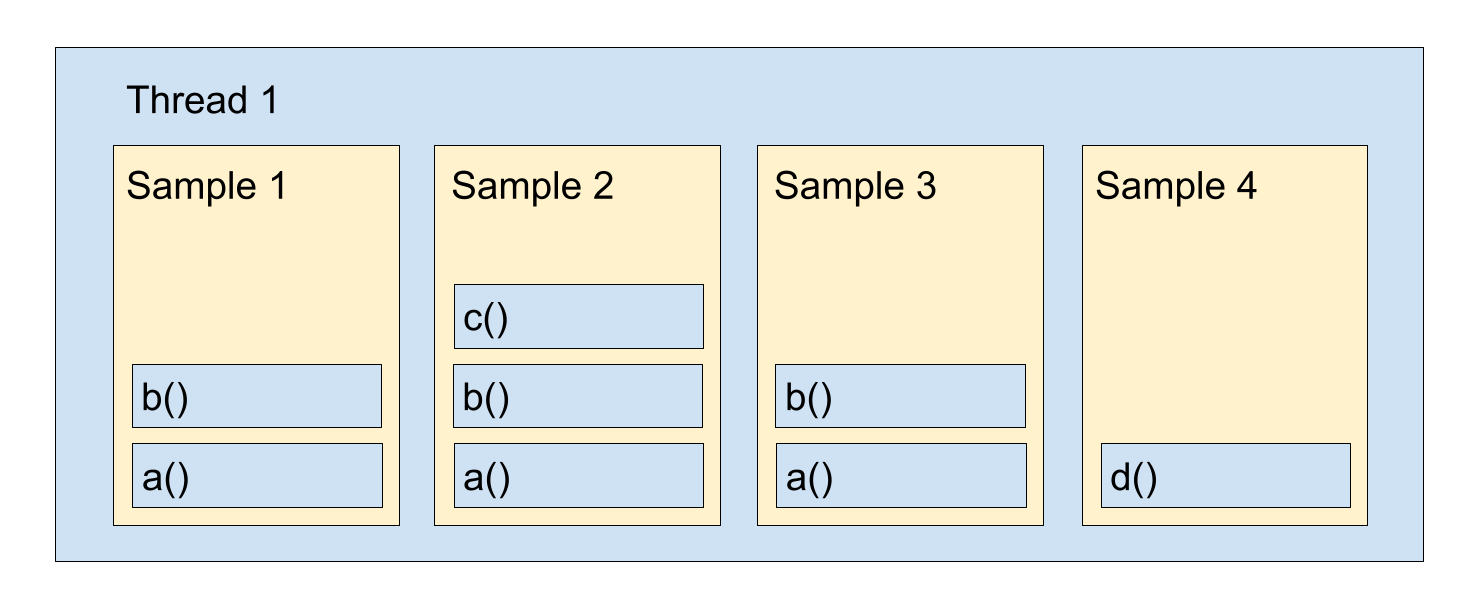
CPU profiling works by periodically collecting the stack traces of all running threads. To achieve this, IntelliJ Profiler uses both JVM and OS APIs, which allows you to get insight into the native part and ensures accurate JVM profiling even for corner-cases where profilers that only query JVM usually fail.
Profilers in IntelliJ IDEA use sampling. This means that instead of capturing all method entries and exits, which instrumentation-based profilers do, IntelliJ Profiler will only get the stack traces at a regular interval.

This sacrifices a small portion of data, which does not affect the overall picture, but brings in a couple of significant benefits, such as minimized footprint on the profiled application. This gives you an unbiased view of things and even allows you to profile applications in production with little impact on their performance.
The frequency with which the profiler collects samples is called the sample rate. You can configure it according to your profiling scenario. A higher sample rate provides a more accurate picture at the expense of snapshot size. Conversely, a lower sample rate may be preferable for long-running scenarios where keeping the snapshot size within manageable limits is an important factor.
Memory allocation profiling
IntelliJ Profiler reacts to memory allocation events. When such an event happens, IntelliJ Profiler records the call stack for the thread from which the request was made and the type of the allocated object.
This information helps you understand which code paths account for the allocation of particular types, and how massive these allocations are.
As with CPU profiling, the profiler minimizes the footprint by only recording the data that is sufficient to form a meaningful picture.
Profiling workflow
Typically, the profiling procedure consists of the following steps:
Collect the data. You may attach the profiler at the application start or do it at a later time. After you stop profiling, IntelliJ IDEA will generate the snapshot.
Open and analyze the profile. At this step, the built-in tools help you organize the raw data in a meaningful form and slice it as required. The approaches to analysis may differ depending on your goal.