CPU and memory live charts
IntelliJ IDEA provides a way to monitor live performance statistics for a running process through CPU and Memory Live Charts.
As opposed to viewing static figures, live data may help you to visualize resource consumption, identify resource-related bottlenecks, and understand how certain events affect the program performance.
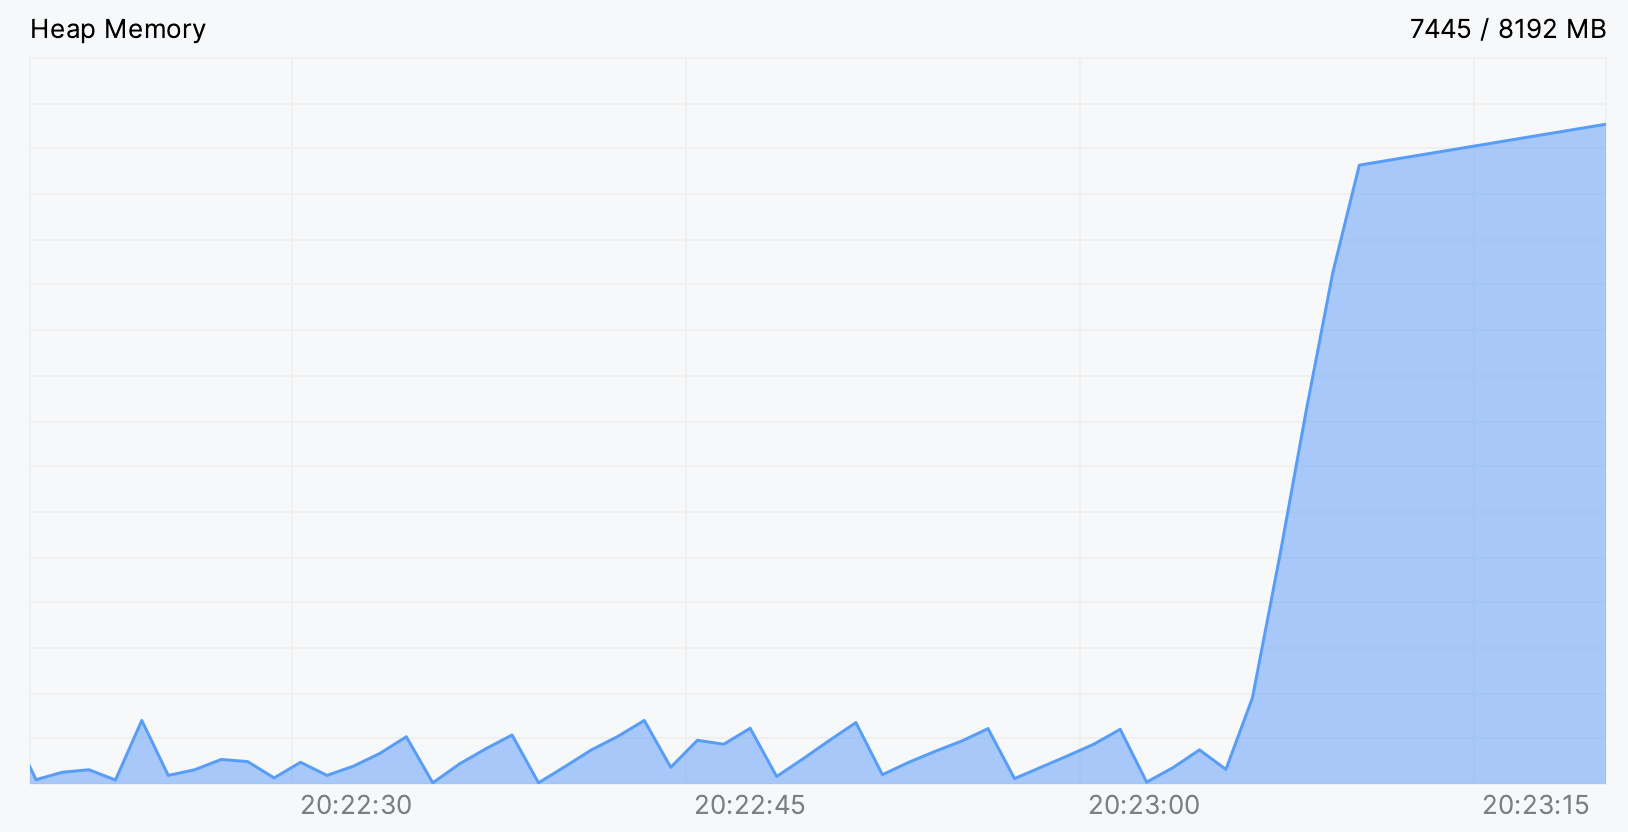
For example, in the picture below, we can see what a memory leak looks like in the Heap Memory chart. Sometimes it is enough to figure out the cause, and when it is not enough, it can give a clue for further investigation.

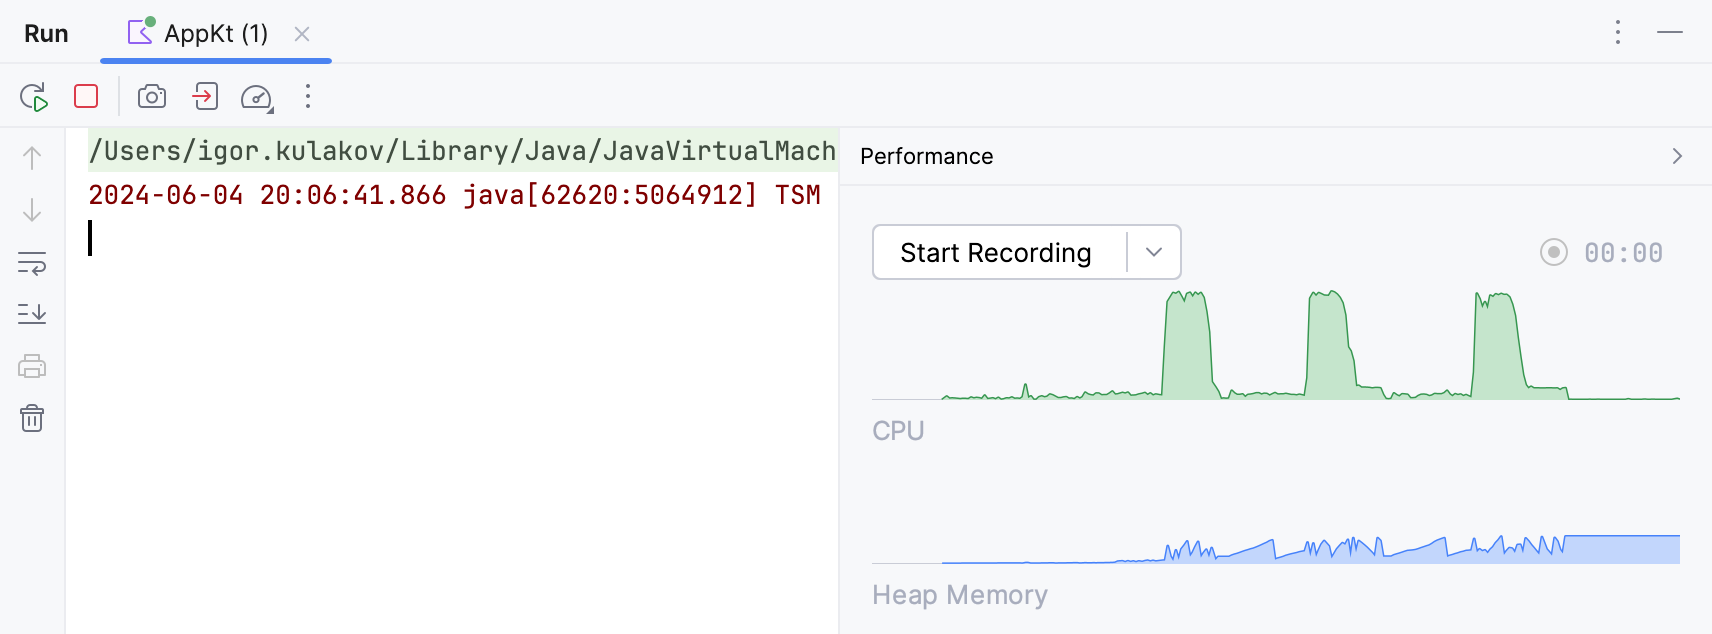
CPU and Memory Live Charts are automatically shown for all programs that you run from IntelliJ IDEA:

In case the target process was launched outside IntelliJ IDEA, you can open CPU and Memory Live Charts from the Profiler home page. This dedicated view will also show thread usage data.
In the main menu, go to View | Tool Windows | Profiler.
Right-click the necessary process in the Profiler tool window and select CPU and Memory Live Charts.

A new tab opens in which you can see the resources the selected process consumes.

The following metrics are available:
CPU – CPU load for the given process. Each process has its own figure.
Heap memory – the current usage of heap memory and maximum heap size. The heap size increases when new objects of reference types are allocated and decreases when they are garbage-collected.
Threads – the overall number of threads (yellow) and daemon threads (red). The number after the slash is the peak number of threads since the process has started.
Non-heap memory – this type of memory is used by the JVM to store class metadata, method data, and other JVM internals. The first value is the current memory value, and the second is the maximum value since the charts have started.
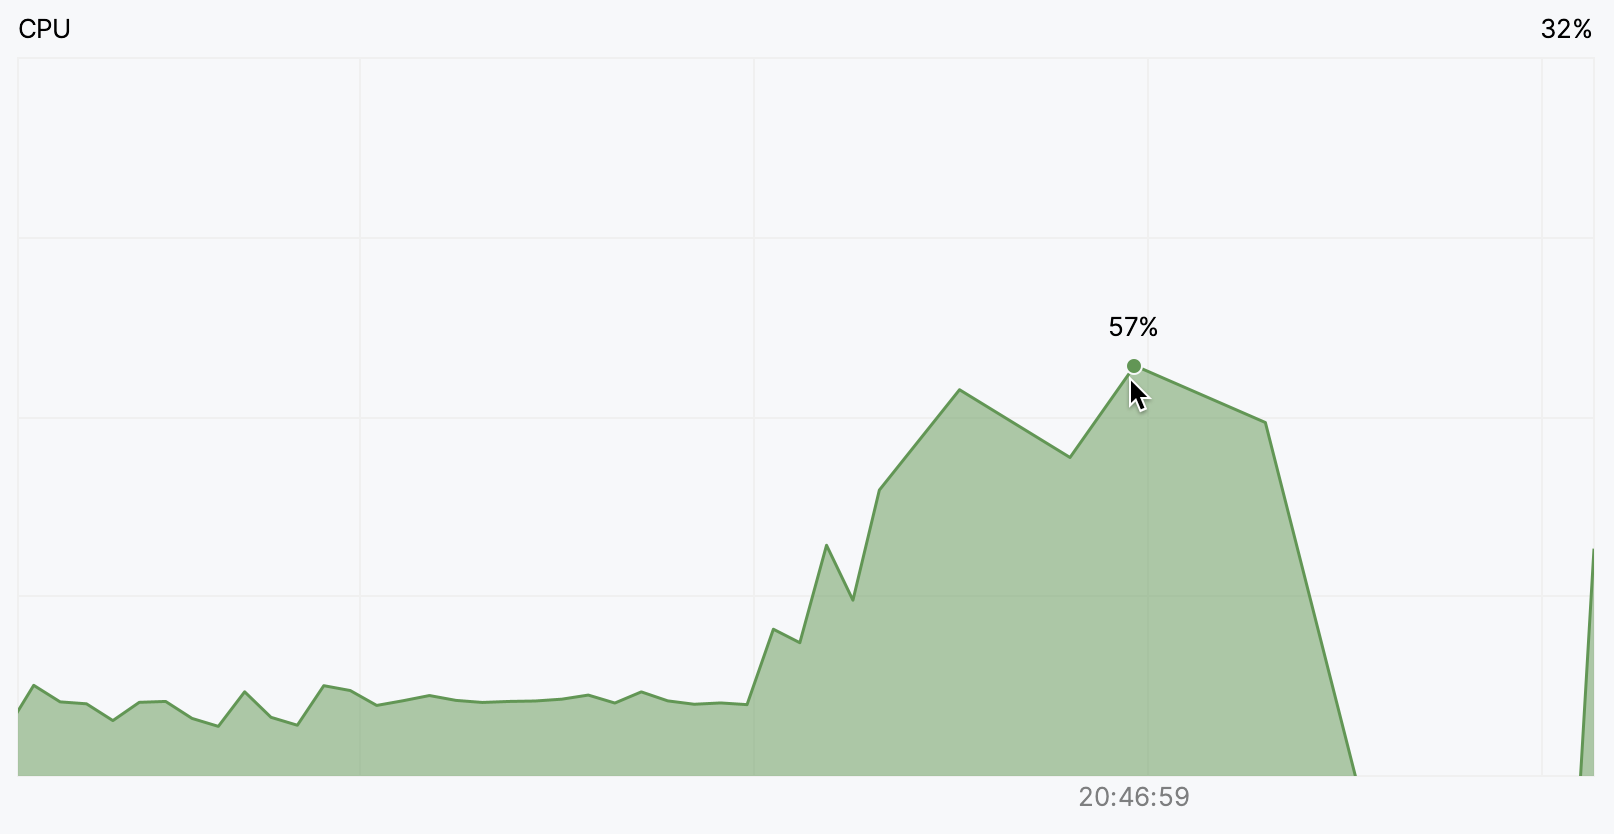
Hover over the point on the chart. IntelliJ IDEA will show the corresponding metric and timestamp.

Click
and select the time period over which you want to see the collected data. Alternatively, you can select Show all data – this will display the entire recording.

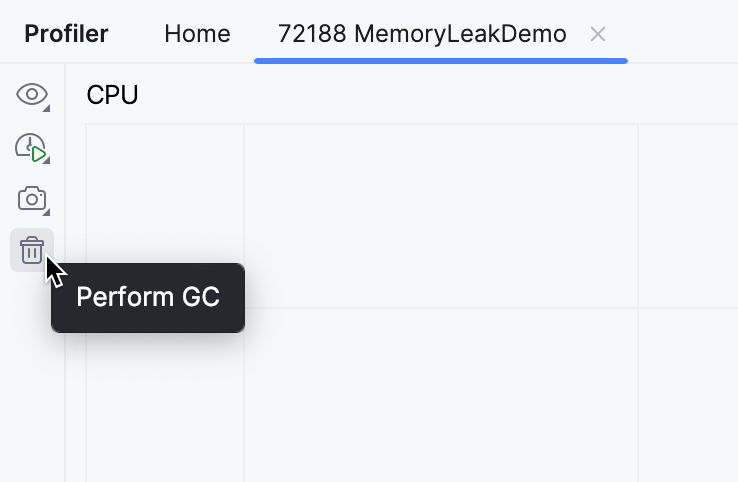
If you need to test how garbage collection works under specific conditions, you can request it from CPU and Memory Live Charts. For that, click the Perform GC button.

Thanks for your feedback!