Selenium
Selenium is a widely used open-source testing framework for automating web browser interactions. The framework supports various web browsers and platforms, making it versatile for comprehensive web application testing.
Selenium support allows you to create a dedicated project for automated tests in Java, Kotlin, Groovy, and Python. You can choose Maven or Gradle for dependency management. To manage test cases, you can select TestNG or JUnit.
Create a new Selenium project
In the main menu, go to . Alternatively, if you're on the Welcome screen, click New Project.
From the list on the left, select Selenium.
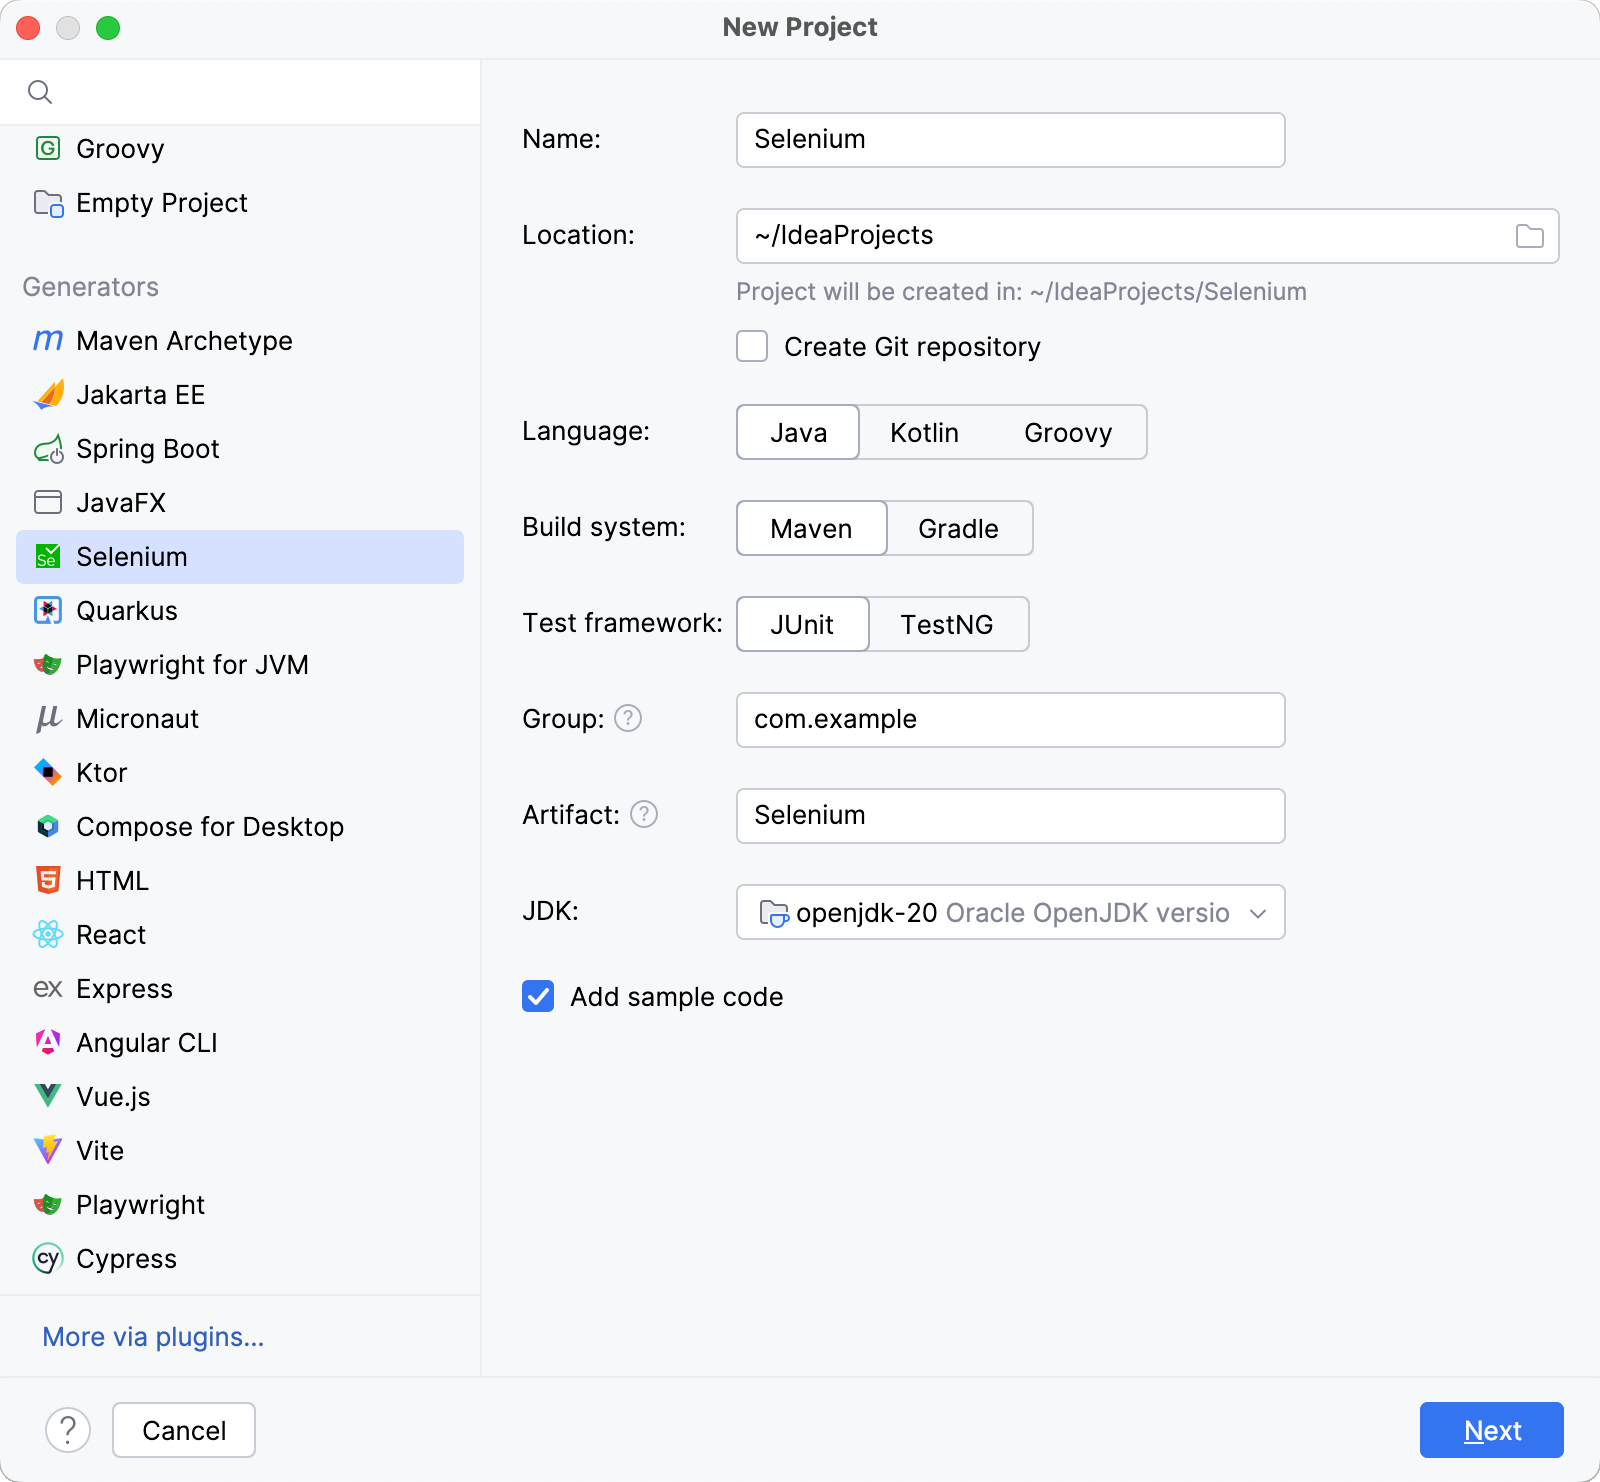
Name the new project and change its location if necessary.
(Optional) Enable the Create Git repository option to place the new project under version control. If you do not want to do it now, you can do it later at any time.
Select the Language that you want to use.
Select the build system that you want to use in your project: Maven or Gradle.
Select the test framework that you want to use for test cases management: JUnit or TestNG.
(Optional) Modify the Group and Artifact parameters.
From the JDK list, select the JDK that you want to use in your project.
If the JDK is installed on your computer, but not defined in the IDE, select Add JDK and specify the path to the JDK home directory.
If you don't have the necessary JDK on your computer, select Download JDK.
(Optional) Enable the Add sample code parameter.
Click Next.
Select the Selenium version that you want to use and add the required dependencies.
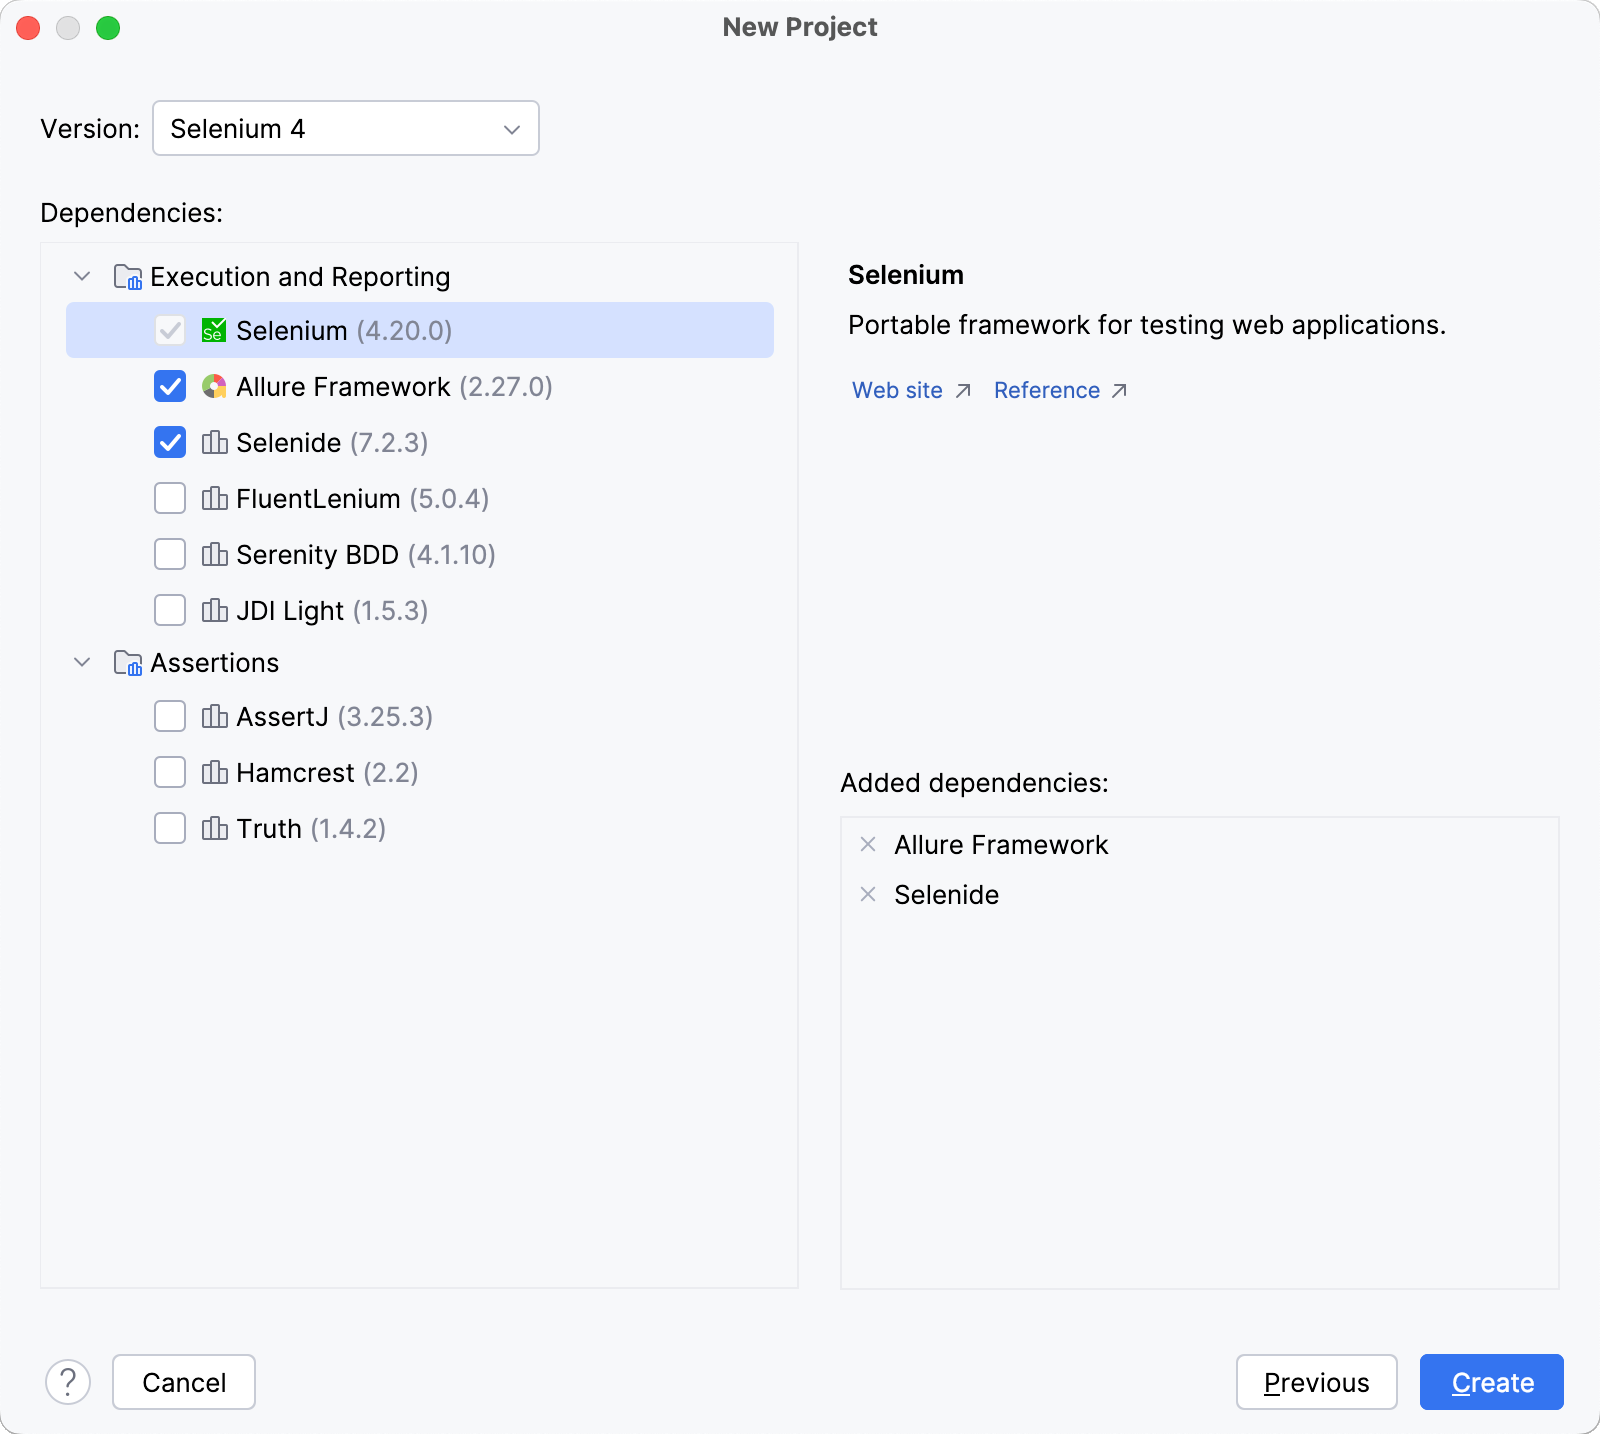
Click Create.
Click Create New Project on the Welcome screen or select from the main menu. The New Project dialog opens.
From the list on the left, select Selenium with Pytest.
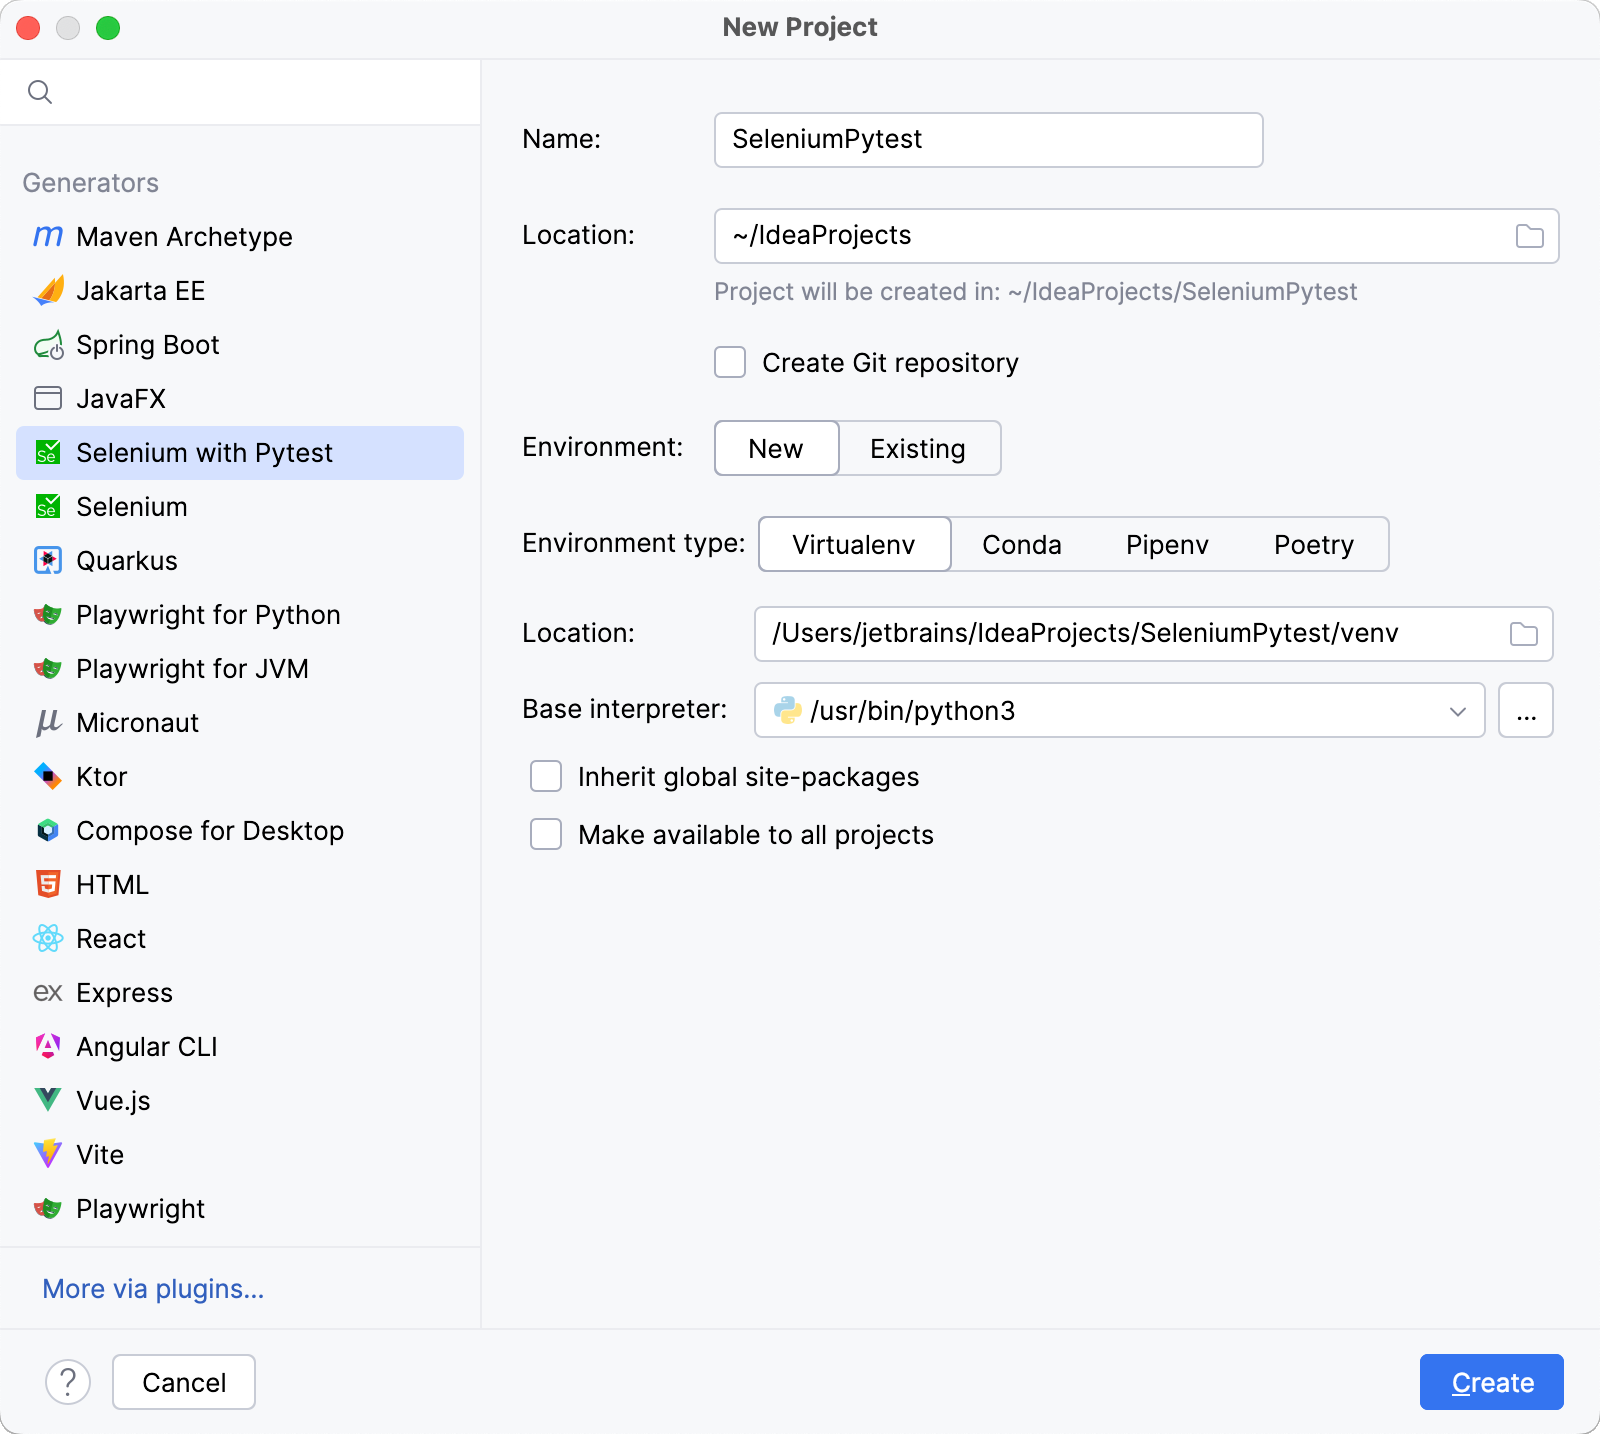
Name the new project and change its location if necessary.
(Optional) Enable the Create Git repository option to place the new project under version control. If you do not want to do it now, you can do it later at any time.
Select whether you want to create a new or use an existing Environment and configure the corresponding settings.

Select the base interpreter from the list, or click
and find the Python executable in your file system.
Specify the location of the new virtual environment in the Location field, or click
and browse for the location in your file system. The directory for the new virtual environment should be empty.
Select the Inherit packages from base interpreter checkbox if you want all packages installed in the global Python on your machine to be added to the virtual environment you're going to create. This checkbox corresponds to the
--system-site-packagesoption of the virtualenv tool.Select the Make available to all projects checkbox if you want to reuse this environment when creating Python interpreters in IntelliJ IDEA.
For more information, refer to the PyCharm documentation.

Specify the location of the new conda environment in the Location field, or click
and browse for the location in your file system. The directory for the new conda environment should be empty.
Select the Python version from the list.
IntelliJ IDEA will detect a conda installation.
If IntelliJ IDEA did not detect the installation automatically, specify the location of the conda executable, or click
to browse for it.
Select the Make available to all projects checkbox if you want to reuse this environment when creating Python interpreters in IntelliJ IDEA.
For more information, refer to the PyCharm documentation.
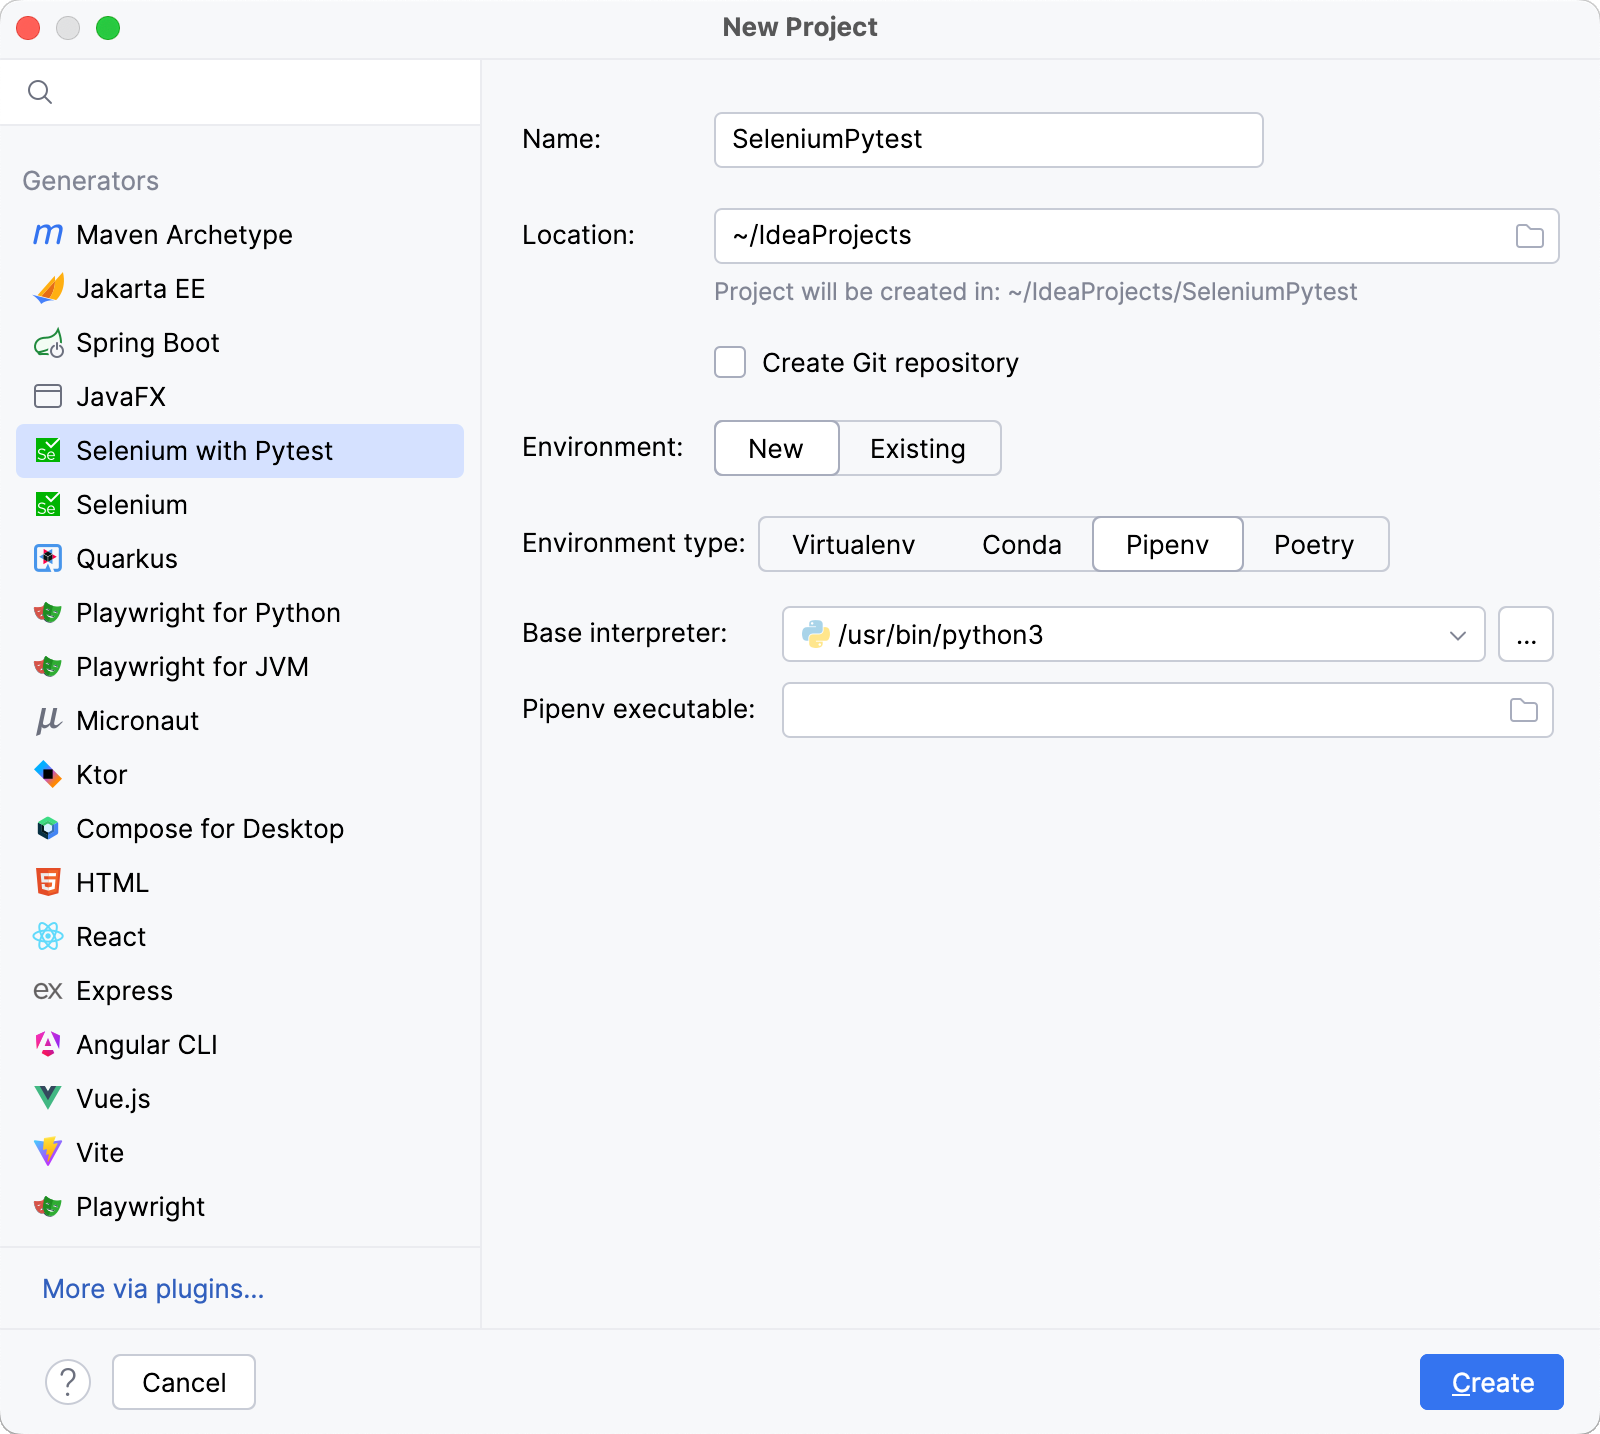
Select the base interpreter from the list, or click
and find the Python executable in your file system.
If you have added the base binary directory to your
PATHenvironmental variable, you do not need to set any additional options: the path to the pipenv executable will be autodetected.If IntelliJ IDEA does not detect the pipenv executable, click Install pipenv via pip to allow IntelliJ IDEA to install it for you automatically.
Alternatively, follow the pipenv installation procedure to discover the executable path and then specify it in the dialog.
For more information, refer to the PyCharm documentation.

Select the base interpreter from the list or click
and find the Python executable in your file system.
For more information, refer to the PyCharm documentation.
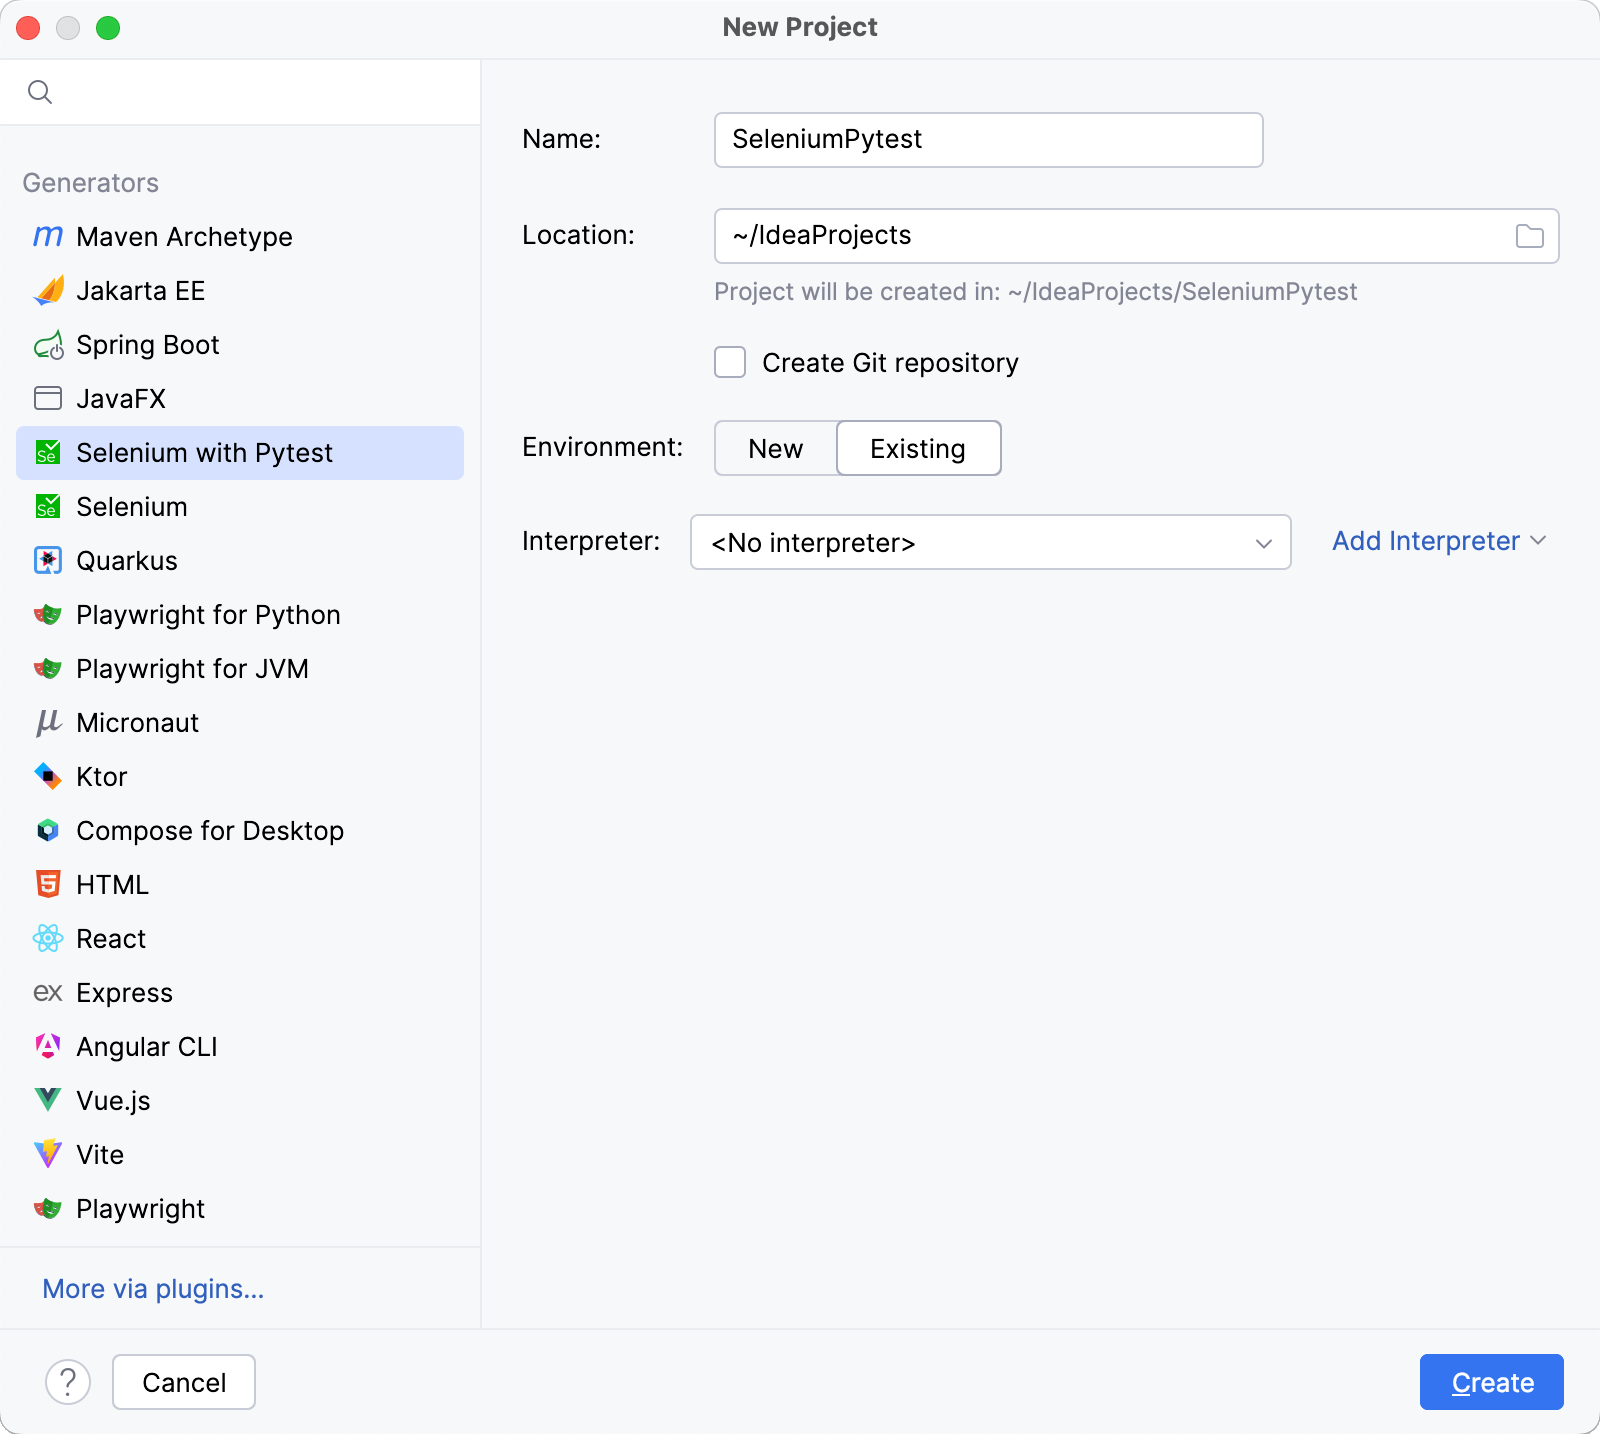
Select the interpreter from the list. If there are no available interpreters, click Add Interpreter and configure one according to your needs.
Click Create.
A new project is created according to the options that you have selected.
Add elements to code
Open the file where you want to add an element.
Click
on the right-hand sidebar to open the Web Inspector toolbar window.
Specify the URL of the page in the address bar.

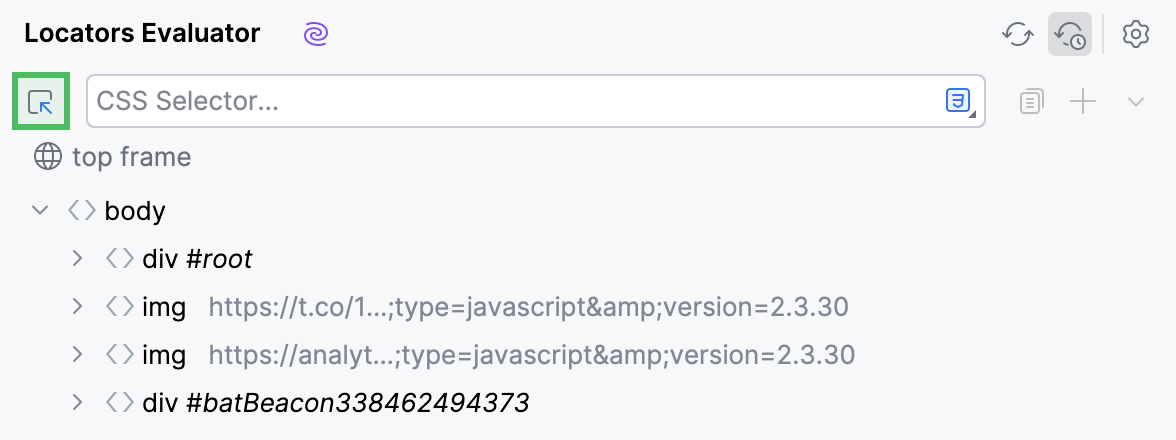
Click
and select the element that you want to add in the Web Inspector.
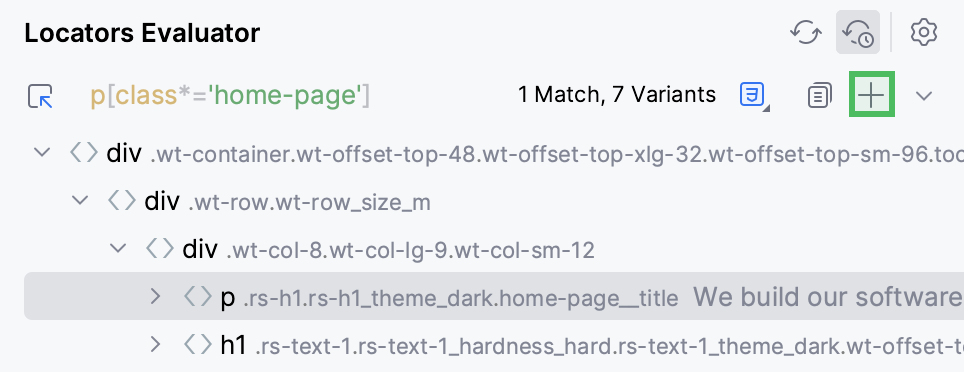
Once the element is selected, click
to add the element to the code.
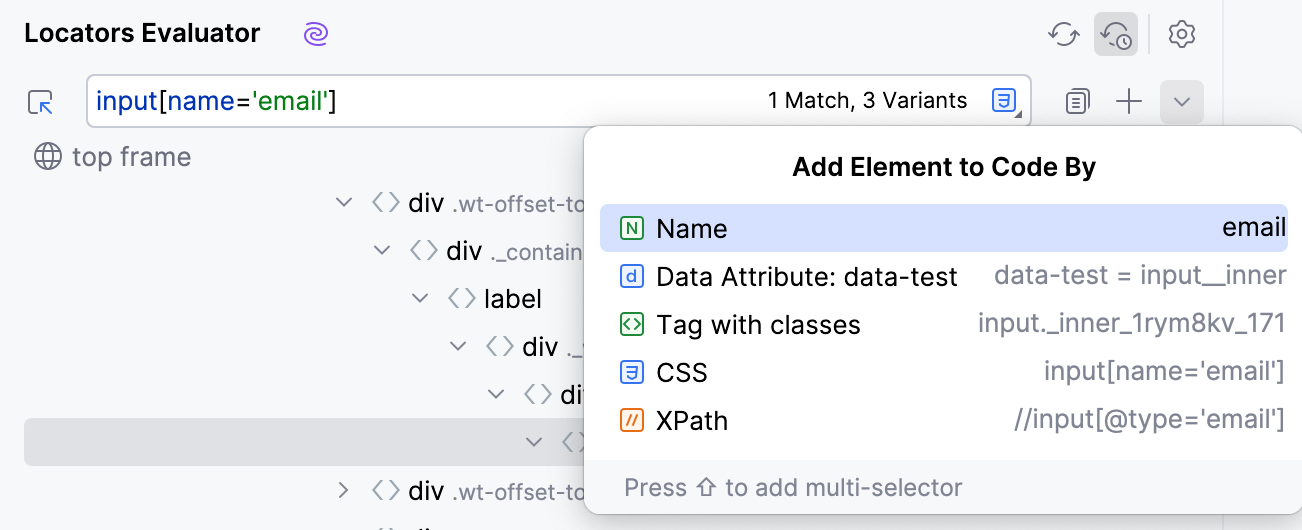
To add a specific type of the selector (ID, Name, Tag with classes, and so on), click
and select the required option.
If you want to switch specifically between CSS and XPath locators, click
and select the required locator type.

As a result, a piece of code is generated and added to the code editor.
Run tests
To run your tests, click the
gutter icon next to the test class or test method, then select the Run option from the list.
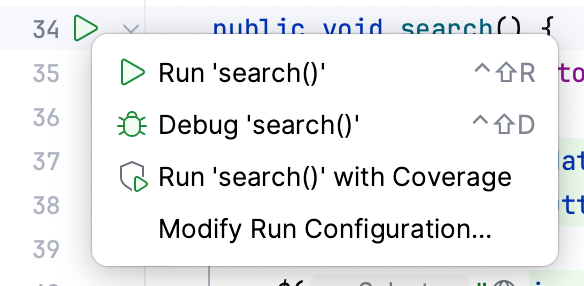
Alternatively, place the caret at the test class to run all tests in that class, or at the test method, and press Ctrl+Shift+F10.
You can run tests in a more customizable way using the run/debug configurations. For more information, refer to Run tests.
Review test results
When the tests finish running, the results are displayed on the Test Runner tab of the Run tool window. On this tab, you can rerun tests, export and import test results, see how much time it took to run each test, and perform other actions.
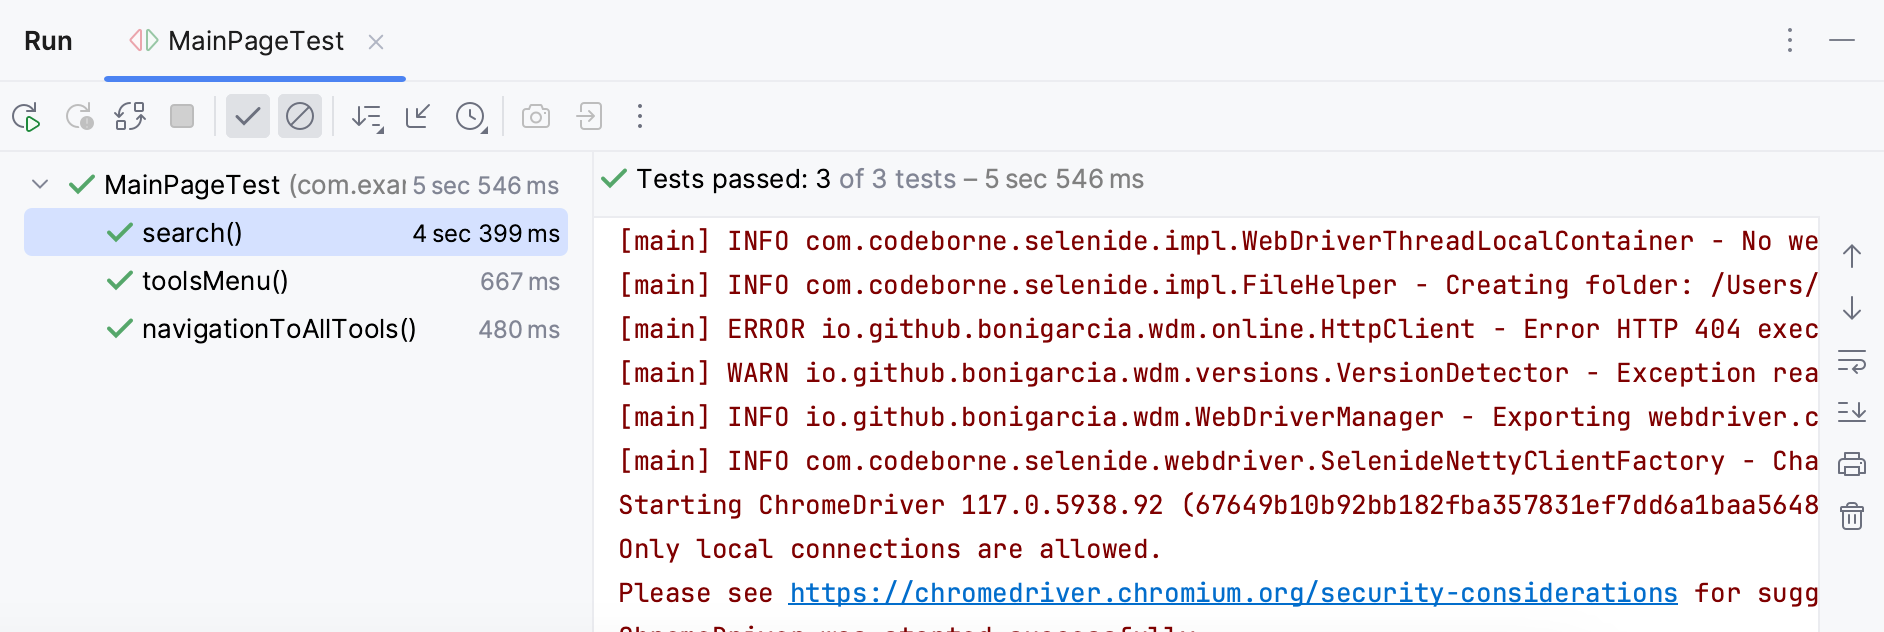
For more information, refer to Explore test results.
Debug tests
In general, the debugging procedure includes the following steps:
Set breakpoints for the lines of code where the execution must be suspended.
Run your code in debug mode.
Use the Debug tool window to analyze the code and locate potential issues.
Fix the issues.
To reproduce these steps in the IDE, do the following:
In the gutter, hover over the executable line of code where you want to suspend the execution and click
.

Click
in the gutter and select Debug. This starts the debugger session and runs your code.

Once the program hits the breakpoint, the execution becomes suspended, and you can review the results of the debugger session on the Debug tool window.

For more information on debugging, refer to Debug code.
Modify a run/debug configuration
If you want to modify the startup properties for your tests, edit the run/debug configuration:
Click the current configuration in the run/debug configuration switcher and select the Edit Configurations option.

In the Run/Debug Configurations dialog, select the configuration that you want to edit.
Configure the required startup properties.

Apply changes and click OK.
For more information on run/debug configurations, refer to Run/debug configurations.
Customize the locator template
If you want to customize how selected elements are added to your code, you can modify the template:
Click the framework name on the Status bar. The UI Automation Framework menu opens.
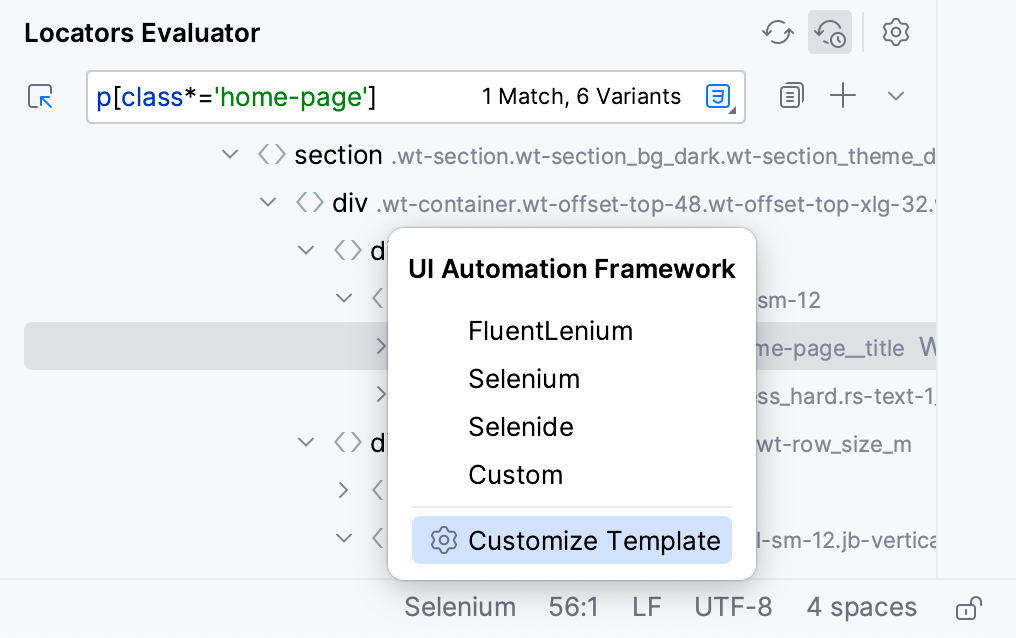
Select the Customize Template option.
In the File and Code Templates dialog, select the required framework from the list.
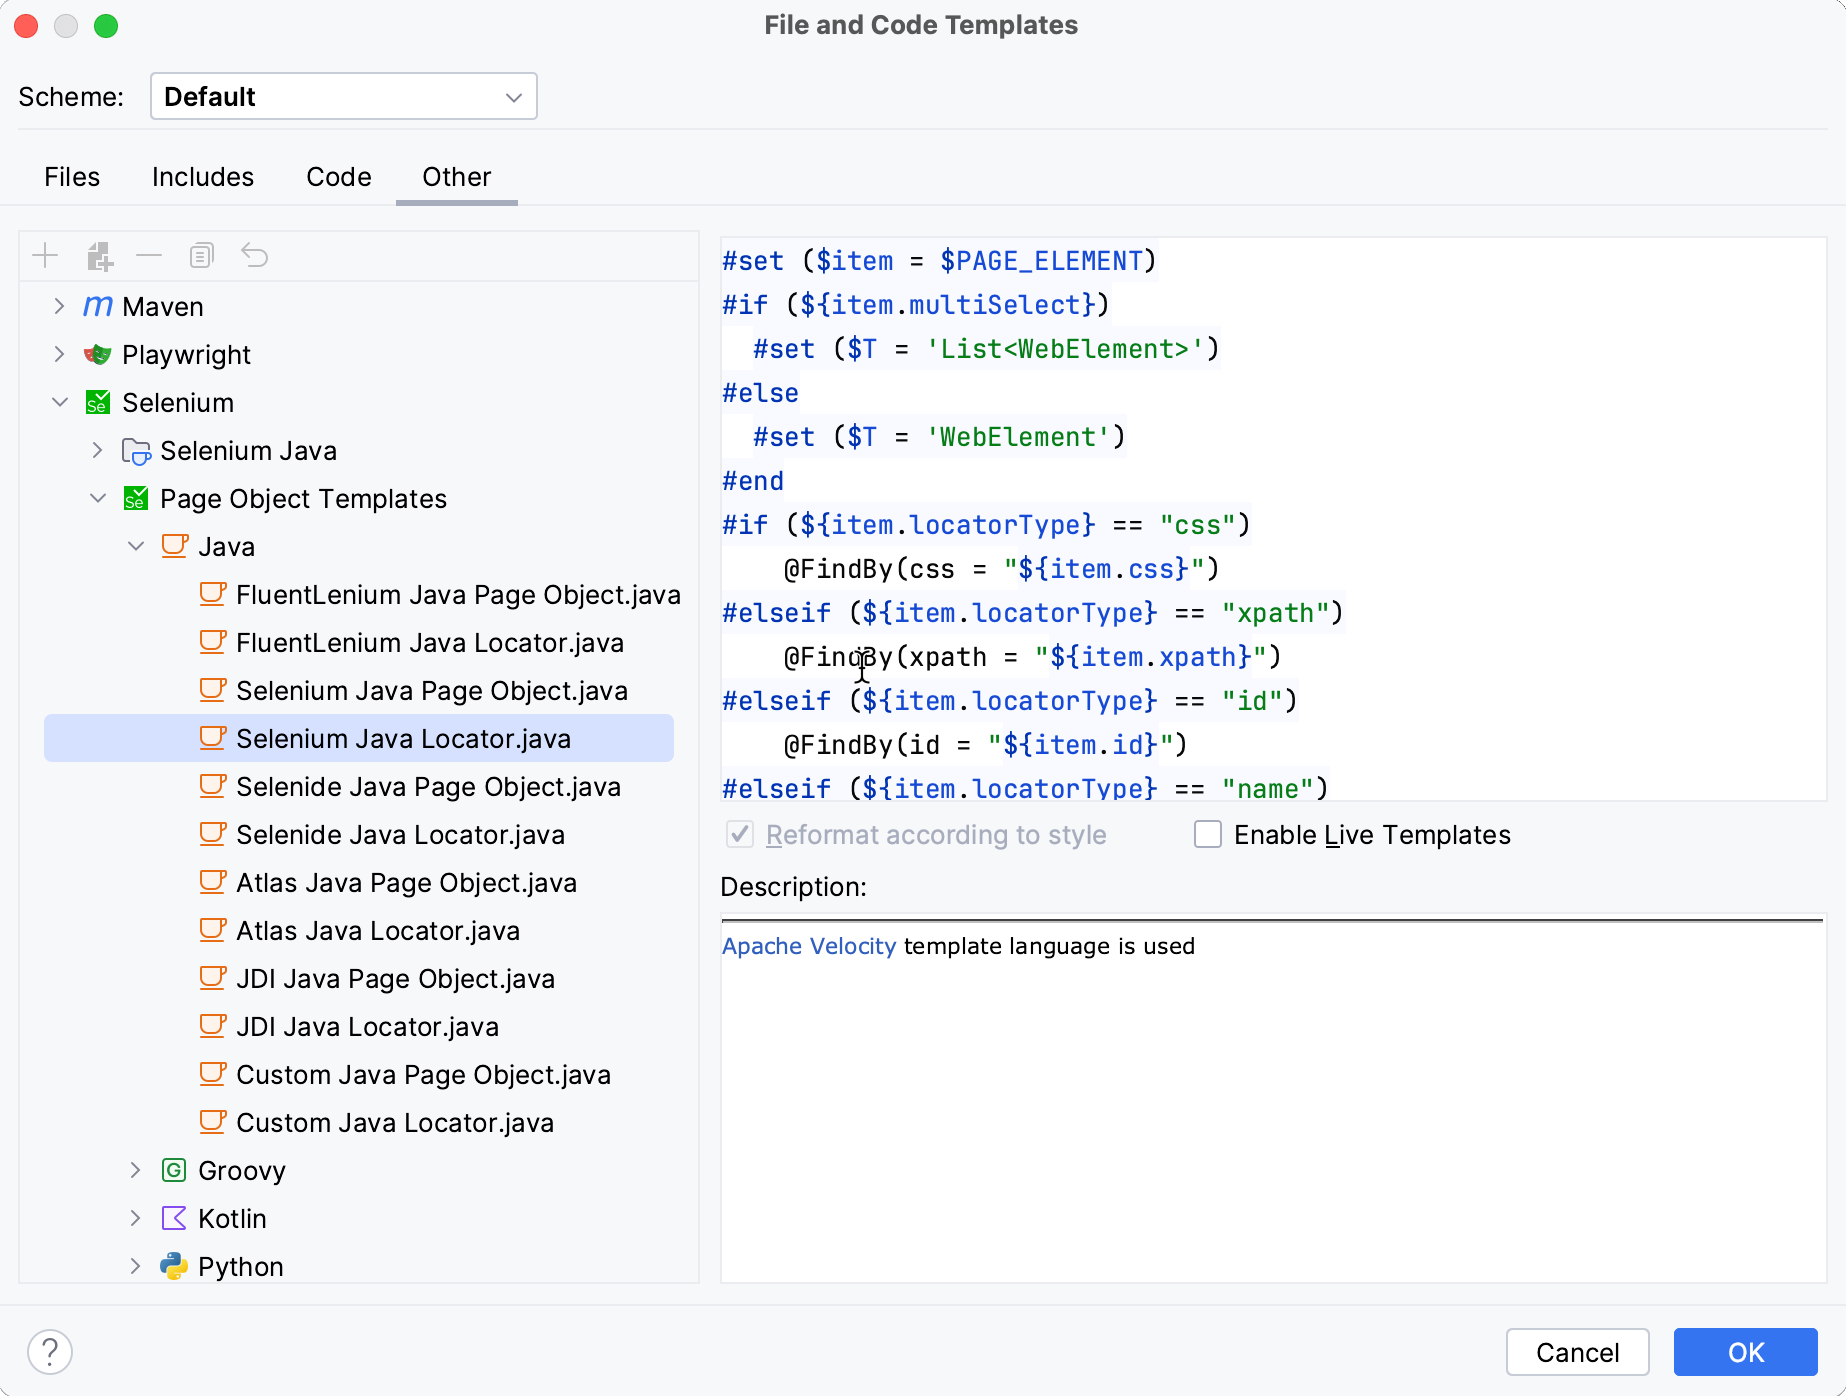
Rewrite the code generation algorithms for the web element locator.
Click OK to save changes.
As a result, the locators will be added to the code according to the updated code generation algorithms.
Use Selenoid for cross-browser testing
Selenoid is an implementation of the Selenium hub for Docker, which allows you to execute automated tests on web browsers running in Docker containers. For each test, Selenoid creates a container with the specified web browser, environment, and settings.
Run Selenoid on Docker
Open the browsers.json file in the editor.
On the panel above the editor, click Launch.
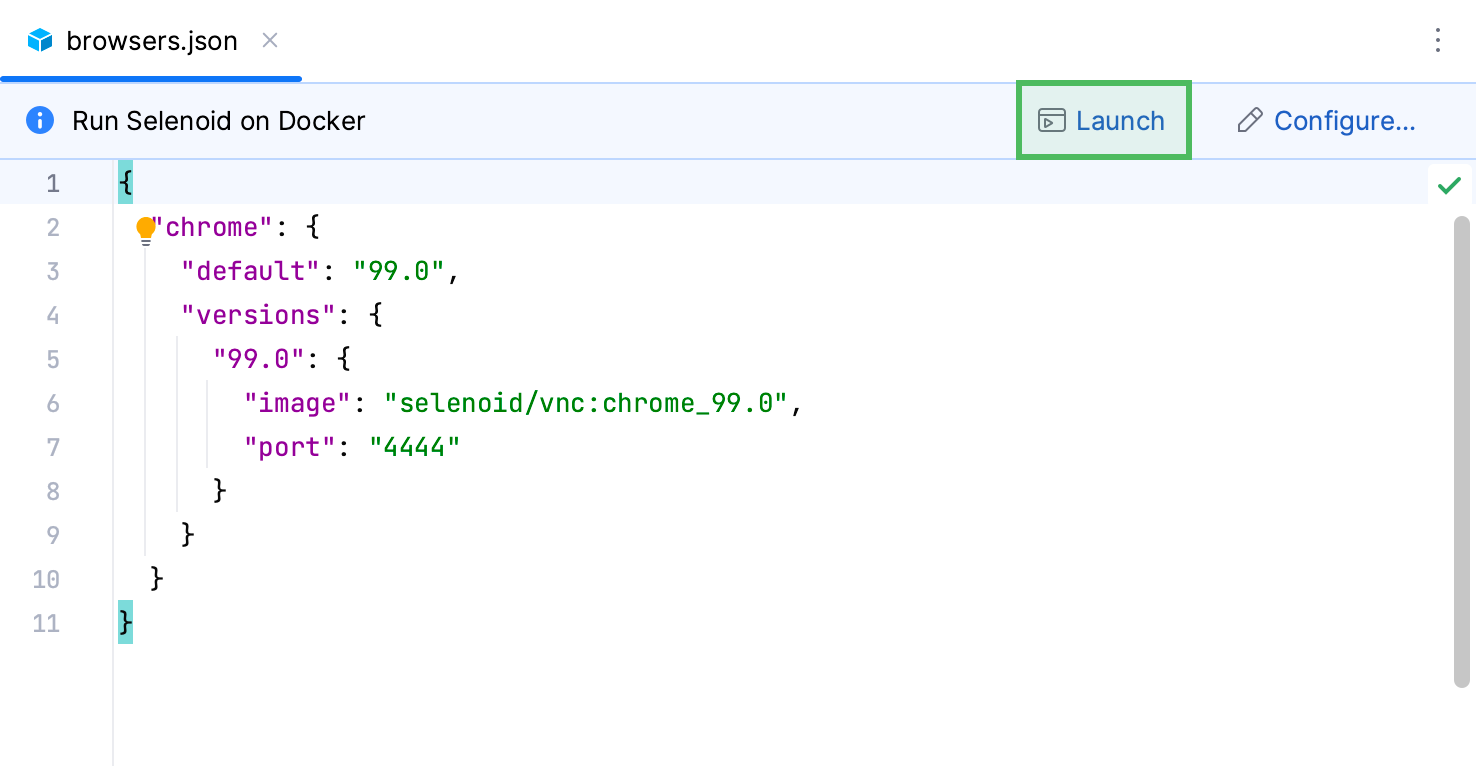
The IDE will pull all the required containers with the browsers, and run the main Selenoid container to manage them.
There are additional options available in the Selenoid run configuration settings, such as output destination folders for logs and videos. To access these options, click Configure on the pane above the editor when the browsers.json file is opened. For the detailed description of the options, refer to Docker run configurations.