Debugger
MPS provides an API for creating custom debuggers as well as integrating with debugger for java. See Debugger Usage page for a description of the MPS debugger features.
- The fundamentals
- Debugging BaseLanguage and its extensions - integration with the java debugger
- Startup of a run configuration under java debugger
- Custom viewers
- Creating custom debugger
- Traceable Nodes
- Breakpoint Creators
The fundamentals
In order to debug code that gets generated from the user models, MPS needs to:
track nodes in user models down to the generated code, in order to be able to match the two worlds seamlessly in the debugger
understand, which types of breakpoints can be created on what nodes
know the options for starting the debugged code in the debugger
optionally also have a set of customized viewers to display the current values of data in memory of the debugged program to the user
MPS tries to automate as much of it as possible, however, in some scenarios the language designer also has to do her share of weight-lifting. Suppose you have a language, let's call it high.level, which generates code in some language low.level, which in turn is generated directly into text (there can be several other steps between high.level and low.level). Suppose that the text generated from low.level consists of java classes, and you want to have your high.level language integrated with MPS java debugger engine. See the following explanatory table:
| high.level extends or generates into BaseLanguage | Do not have to do anything. |
|---|---|
| high.level does not extend nor generates into BaseLanguage | Specify which concepts in low.level are traceable. |
Debugging BaseLanguage and its extensions - integration with the java debugger
To integrate your BaseLanguage-generated language with the MPS java debugger engine, you rarely need to specify anything. MPS can keep track of the generation trace in the trace.info files, so breakpoints can be set as expected and the debugger correctly steps through your DSL code.
tip
The automatic tracing recognizes situations, when a node gets transformed through a reduction rule, and keeps a tracking record of the transformation in an appropriate model's trace.info file. For concepts that do not get reduced through their own reduction rules, you may, however, indicate explicitly, which part of the generated code should be preserved in the trace.info file. The $TRACE$ macro serves this purpose.
See Traceable nodes for more details and an example on the $TRACE$ macro usage.
Startup of a run configuration under java debugger
MPS provides a special language for creating run configurations for languages generated into java – jetbrains.mps.baseLanguage.runConfigurations. Those run configurations are able to start under debugger automatically. See Run configurations for languages generated into java for details.
Custom viewers
When one views variables and fields in a variable view, one may want to define one's own way to show certain values. For instance, collections could be shown as a collection of elements rather than as an ordinary object with all its internal structure.
For creating custom viewers MPS has jetbrains.mps.debugger.java.customViewers language.
The jetbrains.mps.debugger.java.customViewers language enables one to write one's own viewers for data of certain form.
A main concept of customViewers language is a custom data viewer. It receives a raw java value (an objects on stack) and returns a list of so-called watchables. A watchable is a pair of a value and its label (a string which categorizes a value, for example, whether a value is a method, a field, an element, a size, and so on) Labels for watchables are defined in custom watchables container. Each label could be assigned an icon.
The viewer for a specific type is defined in a custom viewer root. In the following table custom viewer parts are described:
| Part | Description |
|---|---|
| for type | A type for which this viewer is intended. |
| can wrap | An additional filter for viewed objects. |
| get presentation | A string representation of an object. |
| get custom watchables | Subvalues of this object. Result of this function must be of type |
Custom Viewers language introduces two new types: watchable list and watchable.
This is the custom viewer specification for java.util.Map.Entry class:
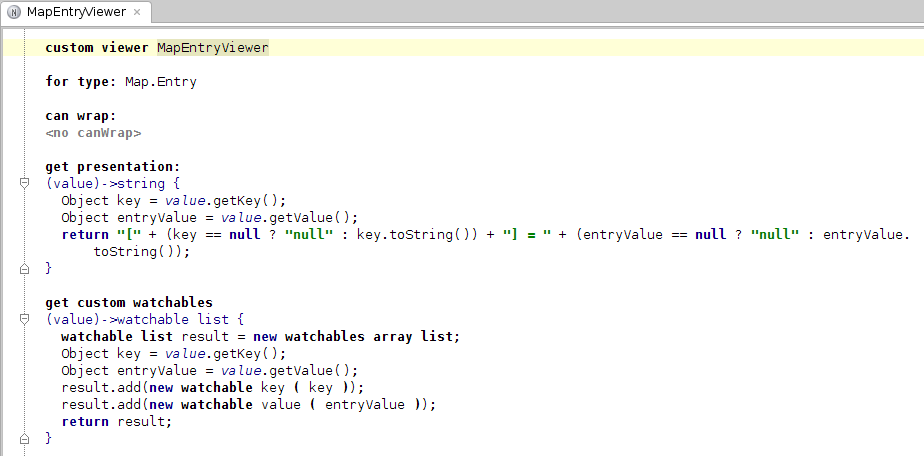
And here we see how a map entry is displayed in debugger view:

tip
Note that the JDT-tools solution must be imported into your plugin solution in order to compile your custom viewers.
Creating custom debugger
If generation of your language avoids BaseLanguage, you'll need to take care of node tracing and breakpoint specification manually. Additionally, if you are generating languages other than Java, you'll have to attach the target platform debugger into MPS. The Debugger API provided by MPS allows you to create such non-java debuggers. All the necessary classes are located in the "Debugger API for MPS" plugin. See also Debugger API description.
To summarize, when you target a language other than BaseLanguage, you typically need to specify:
nodes which should be traced (see Traceable nodes)
on which nodes breakpoints could be created (see Breakpoint creators)
how to compile your generated sources (see Make facets)
how to start your application under debug (see Run configurations for languages generated into java)
Not all of those steps are absolutely necessary - which of them are depends on the actual language.
tip
The customizedDebugger sample project bundled with MPS will give you an easy-to-follow example of a non-BaseLanguage Java-generating language that customizes the breakpoints as well as node traces in order to support debugging.
Traceable Nodes
This section describes how to specify which nodes require to save some additional information in trace .info file (like information about positions text, generated from the node, visible variables, name of the file the node was generated into, and so on). trace.info files contain information allowing to connect nodes in MPS with generated text. For example, if a breakpoint is hit, java debugger tells MPS the line number in source file and to get the actual node from this information MPS uses information from trace .info files.
Specifically, trace.info files contain the following information:
position information: name of text file and position in it where the node was generated;
scope information: for each "scope" node (such that has some variables, associated with it and visible in the scope of the node) – names and ids of variables visible in the scope;
unit information: for each "unit node" (such that represent some unit of a language, for example a class in java) – name of the unit the node is generated into.
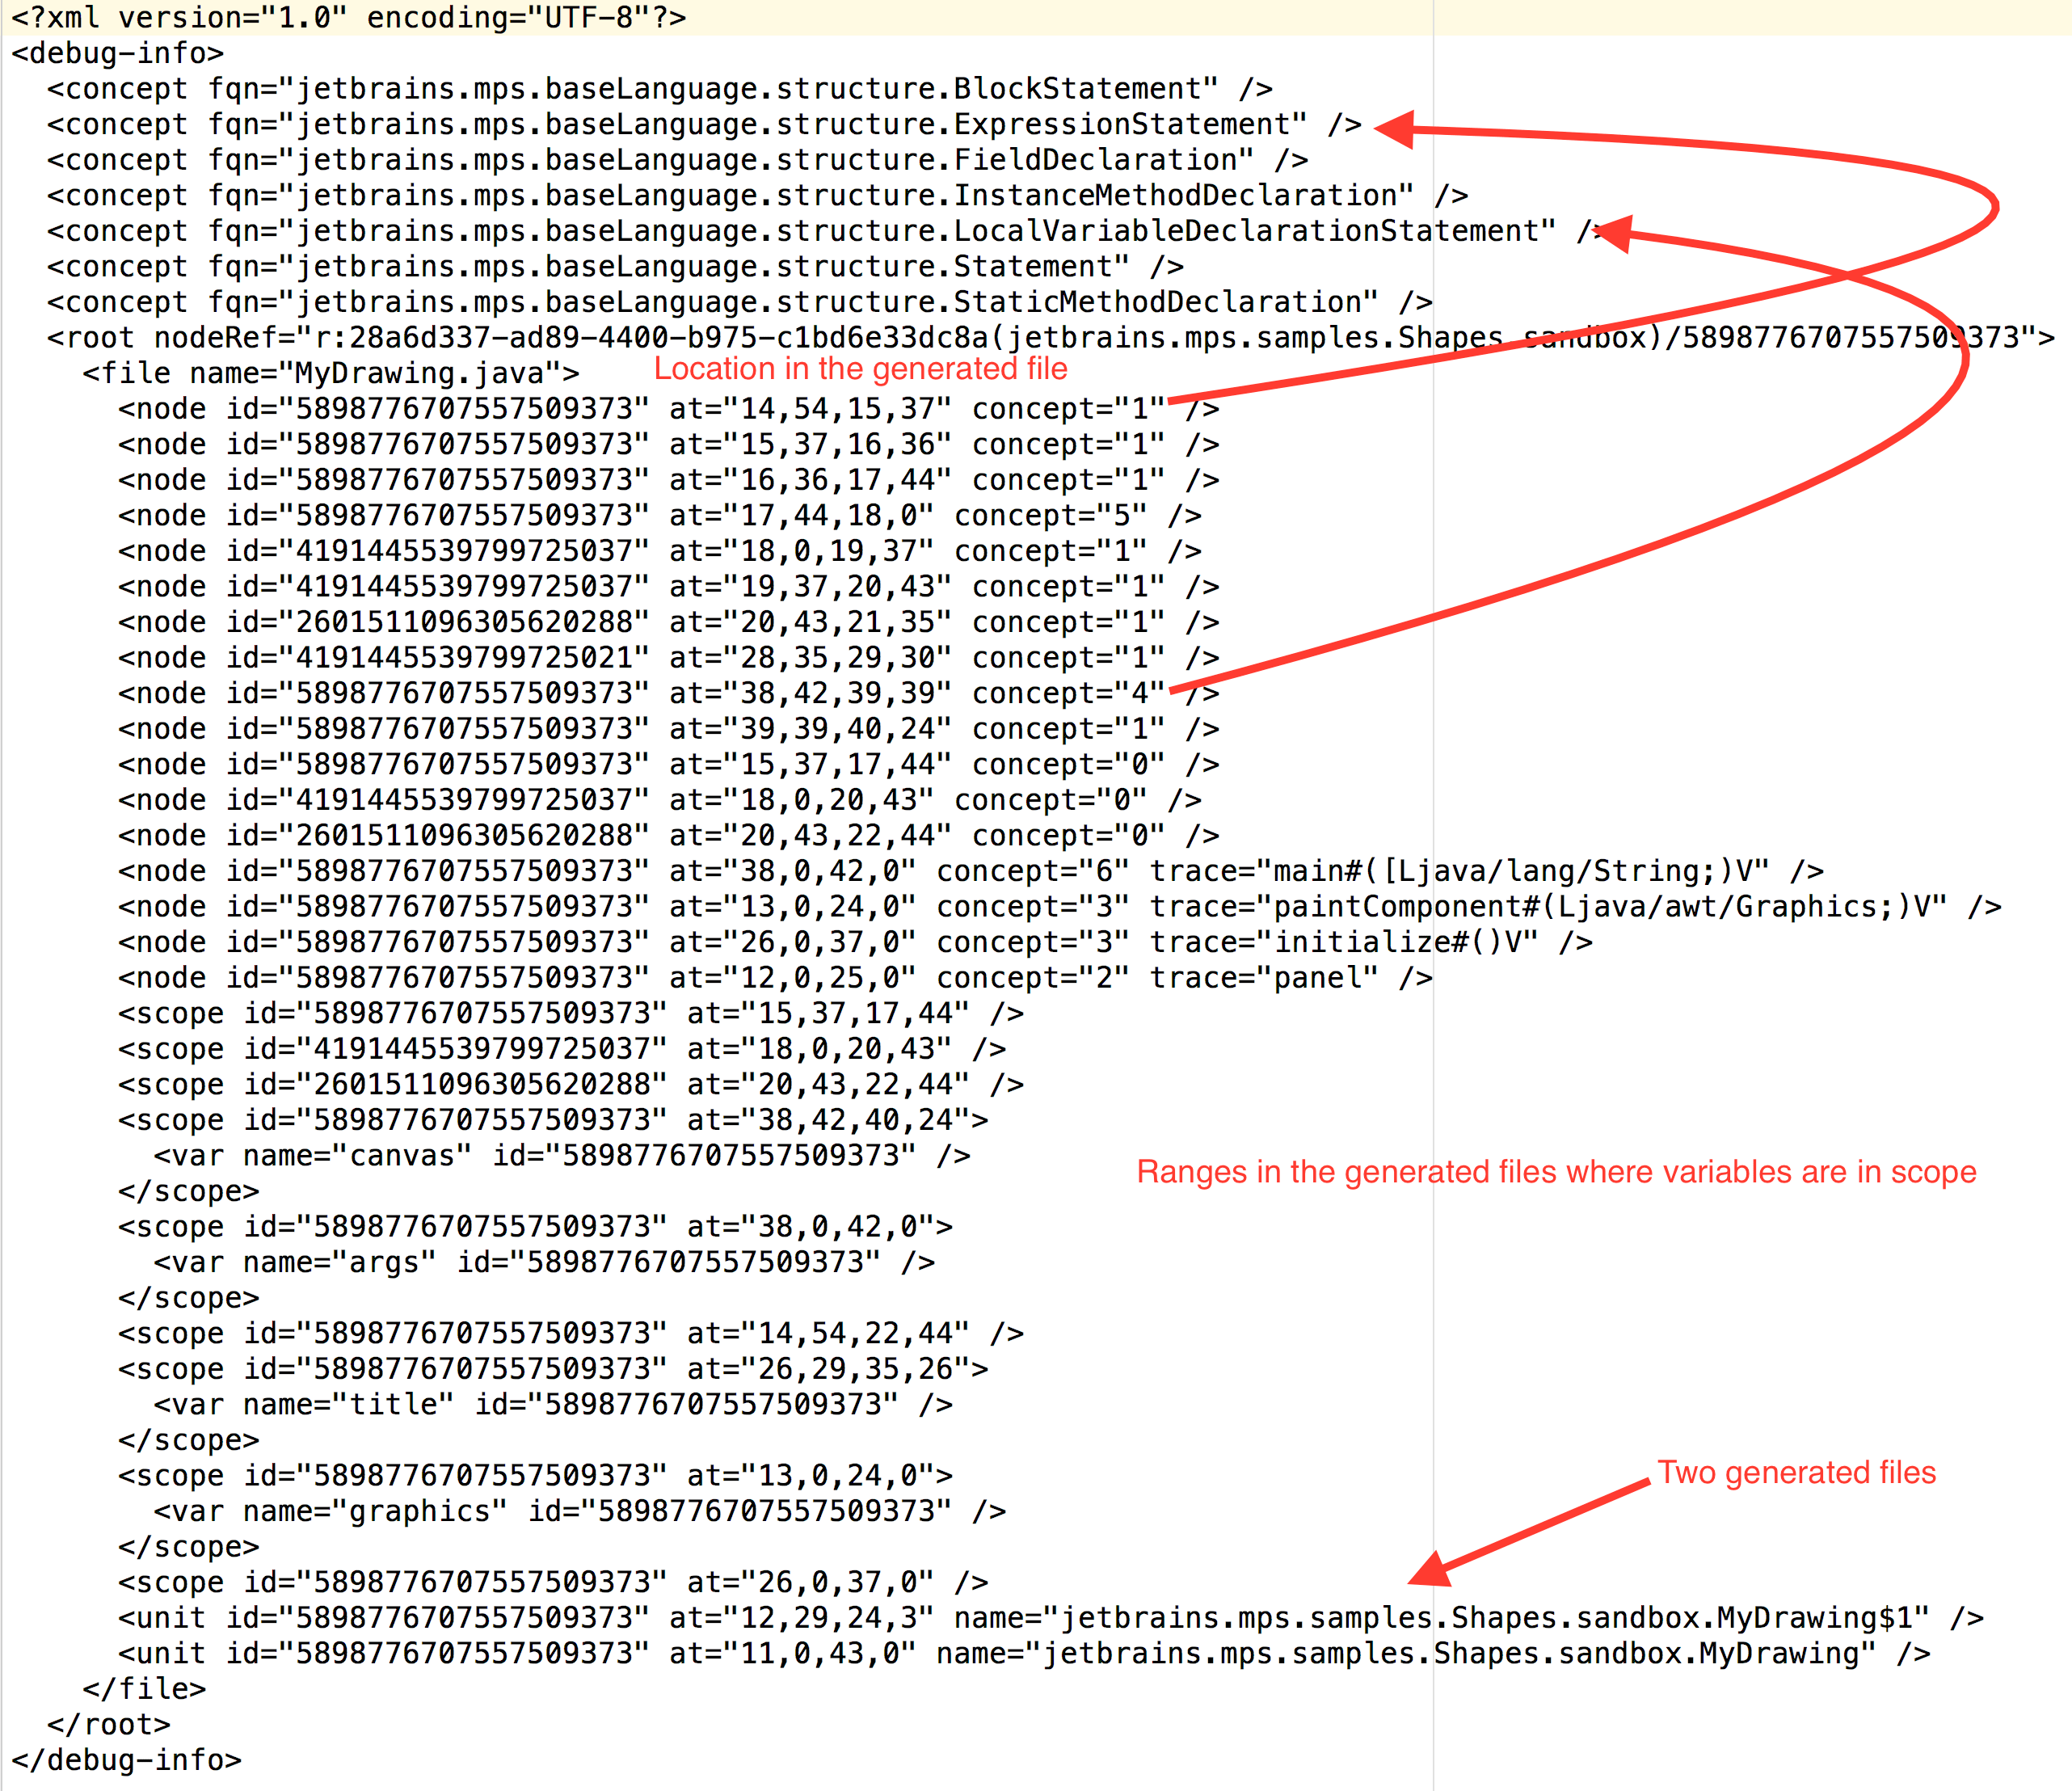
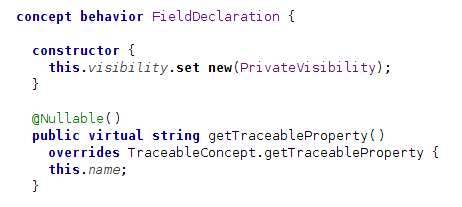
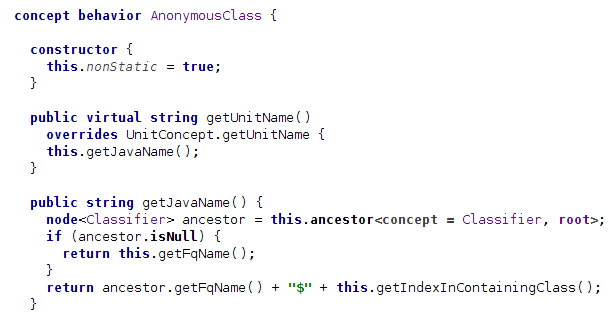
Concepts TraceableConcept, ScopeConcept and UnitConcept of language jetbrains.mps.lang.traceable are used for that purpose. To save some information into trace.info file, user should derive from one of those concepts and implement the specific behavior method. The concepts are described in the table below.
| Concept | Description | Behavior method to implement | Example |
|---|---|---|---|
| | Concepts for which location in text is saved and for which breakpoints could be created. | |
 |
| | Concepts which have some local variables, visible in the scope. | |
 |
| | Concepts which are generated into separate units, like classes or inner classes in java. | |
 |
trace.info files are created on the last stage of generation – while generating text. So the described concepts are only to be used in languages generated into text. The entries are filled in automatically, whenever a TraceableConcept, ScopeConcept or UnitConcept are being generated through a reduction rule.
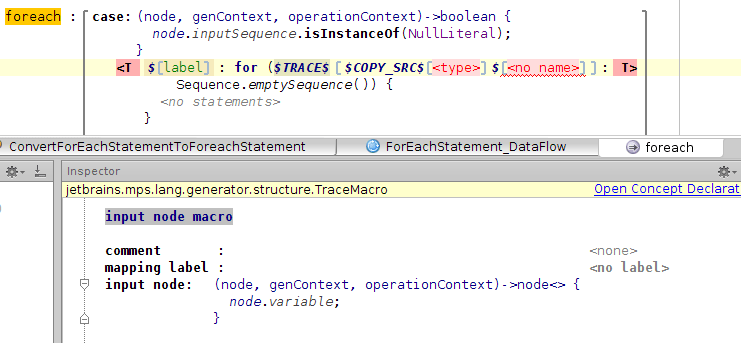
When automatic tracing is impossible, the $TRACE$ macro can be used in order to match the desired input node of a concept from language.high with the generated code explicitly.
Breakpoint Creators
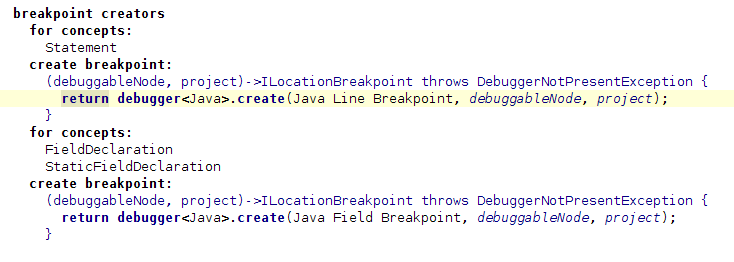
To specify how breakpoints are created on various nodes, root breakpoint creators is used. This is a root of concept BreakpointCreator from jetbrains.mps.debugger.api.lang language. The root should be located in the language plugin model. It contains a list of BreakpointableNodeItem, each of them specify a list of concept to create breakpoint for and a method actually creating a breakpoint. jetbrains.mps.debugger.api.lang provides several concepts to operate with debuggers, and specifically to create breakpoints. They are described below.
DebuggerReference – a reference to a specific debugger, like java debugger;
CreateBreakpointOperation – an operation which creates a location breakpoint of specified kind on a given node for a given project;
DebuggerType – a special type for references to debuggers.
On the following example breakpoint creators node from baseLanguage is shown.
In order to provide more complex filtering behavior, instead of a plain complex list breakpoint creators can use isApplicable function. There is an intention to switch to using this function.