Query results
Usually, when you run a query, you receive results in a table format. PhpStorm displays the results in a data editor. For each statement, the data editor with results appears in a separate tab in the Services tool window. For example, if you run three SELECT statements in the query console, you will see three tabs in the tool window.
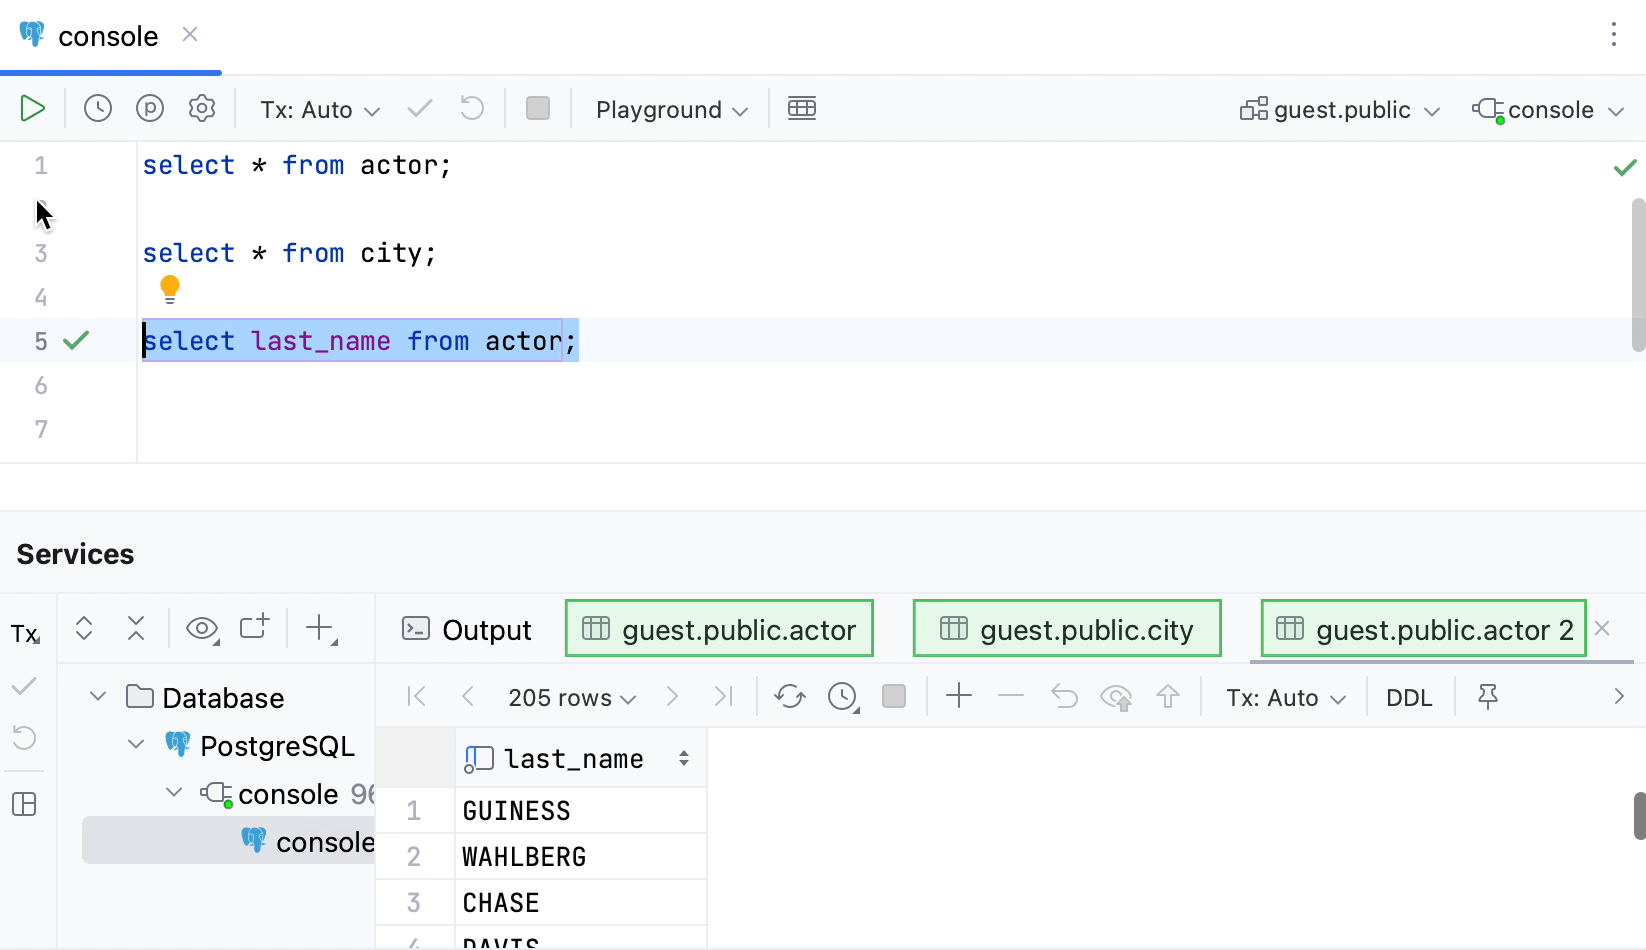
The data editor and viewer, or data editor, provides a user interface for working with data. In the data editor, you can sort, filter, add, edit, and remove the data as well as perform other associated tasks. For full information about data editor, refer to the Data editor and viewer topic.
For more information about query consoles and Services tool window, refer to Query consoles and Services tool window.
By default, PhpStorm updates the same tab with results each time you run a new query after the previous one. You can change this behavior and create a tab each time you run a new query.
In the IDE settings CtrlAlt0S, go to Tools | Database | Query Execution.
Select the Open results in new tab checkbox and click OK.
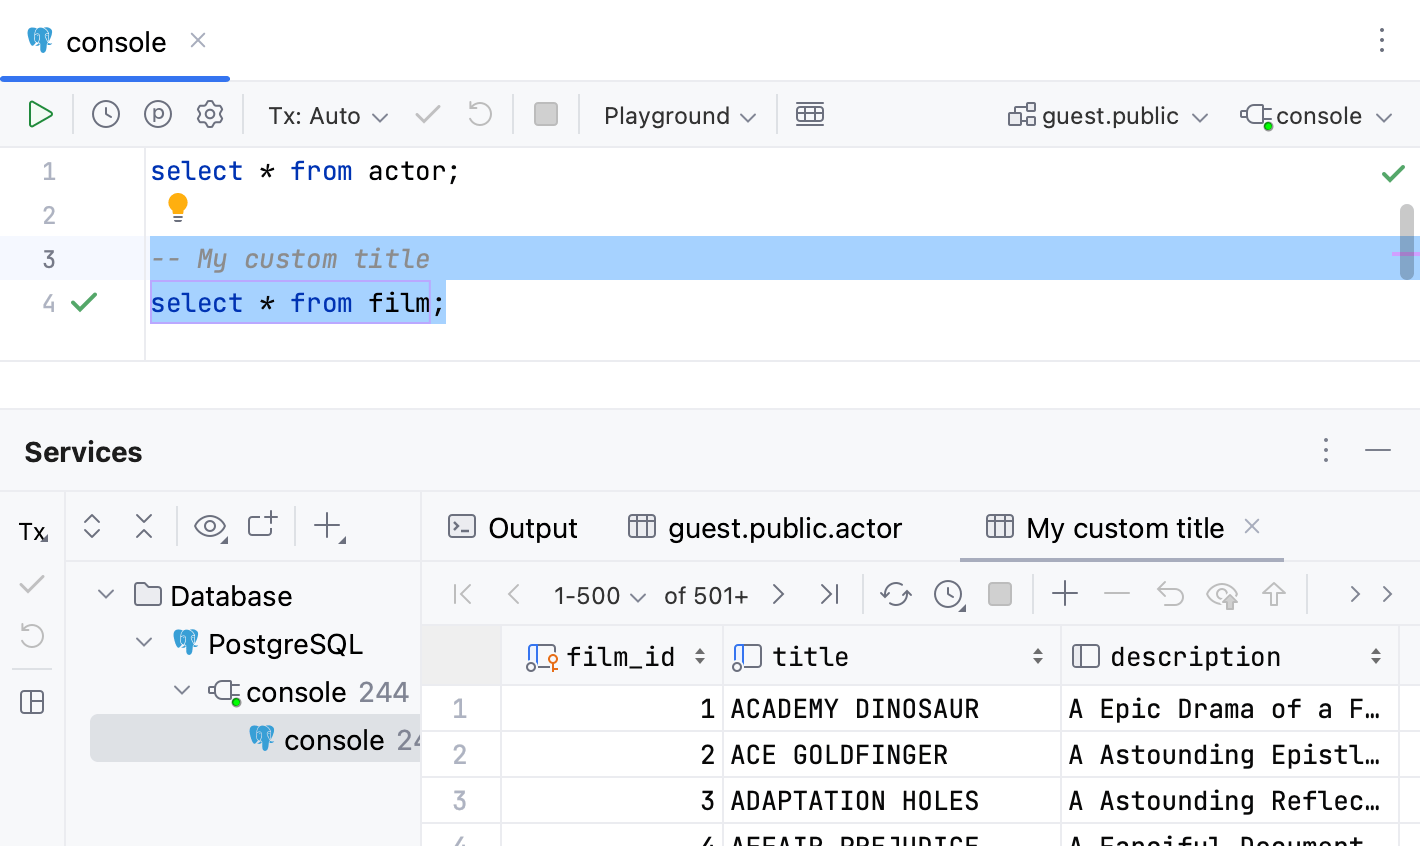
You can define a tab title in the comment section before the query. In the Treat text as title after field, you can reserve a combination of symbols or characters after which any text will be treated as a tab title. By default, no combination is used, so any text after -- or /* is treated as a tab title.
Open settings by pressing CtrlAlt0S, navigate to Tools | Database | Query Execution | Output and Results.
In the Treat text as title after field, define a combination for tab titles.
To disable this feature, open settings CtrlAlt0S, navigate to Tools | Database | Query Execution | Output and Results, and clear the Create title for results from comment before query checkbox.
For more examples of custom titles for tabs, refer to Name the result tabs at youtube.com.
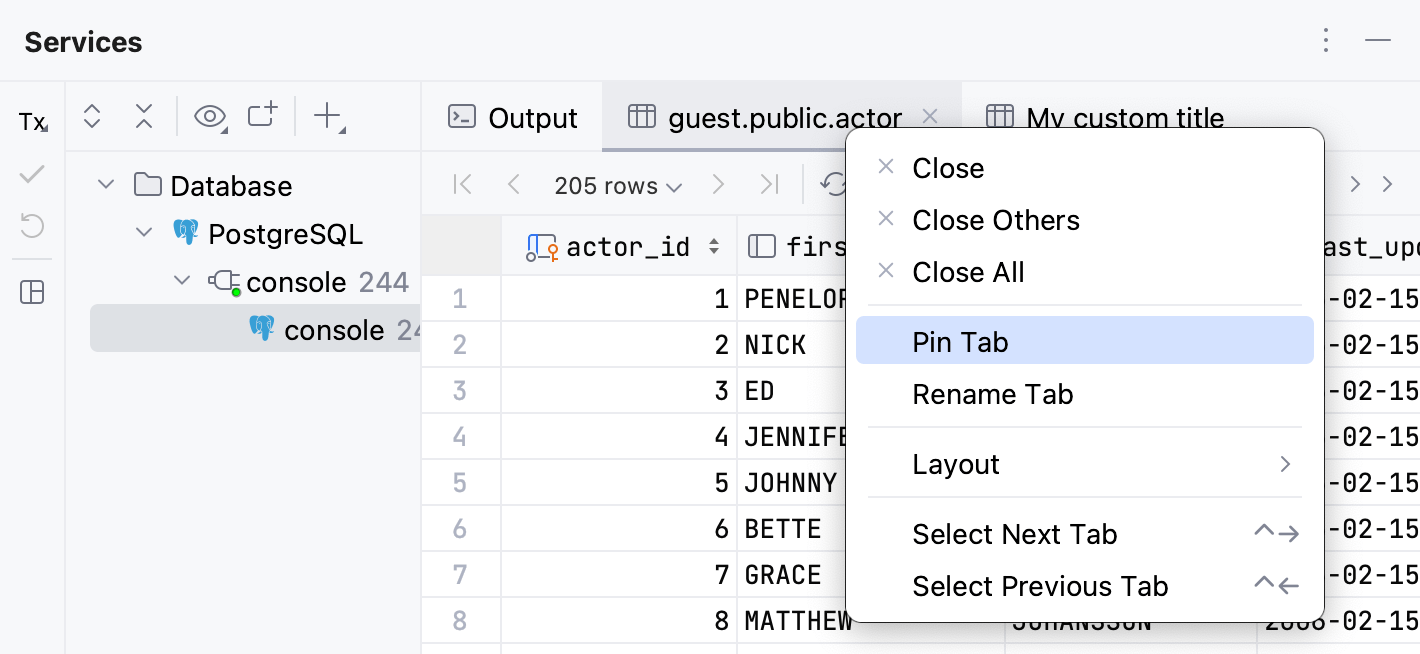
If one and the same tab is used to show your query results, and you get the result that you want to keep, you can pin the tab to the tool window.
Right-click the tab and select Pin Tab.
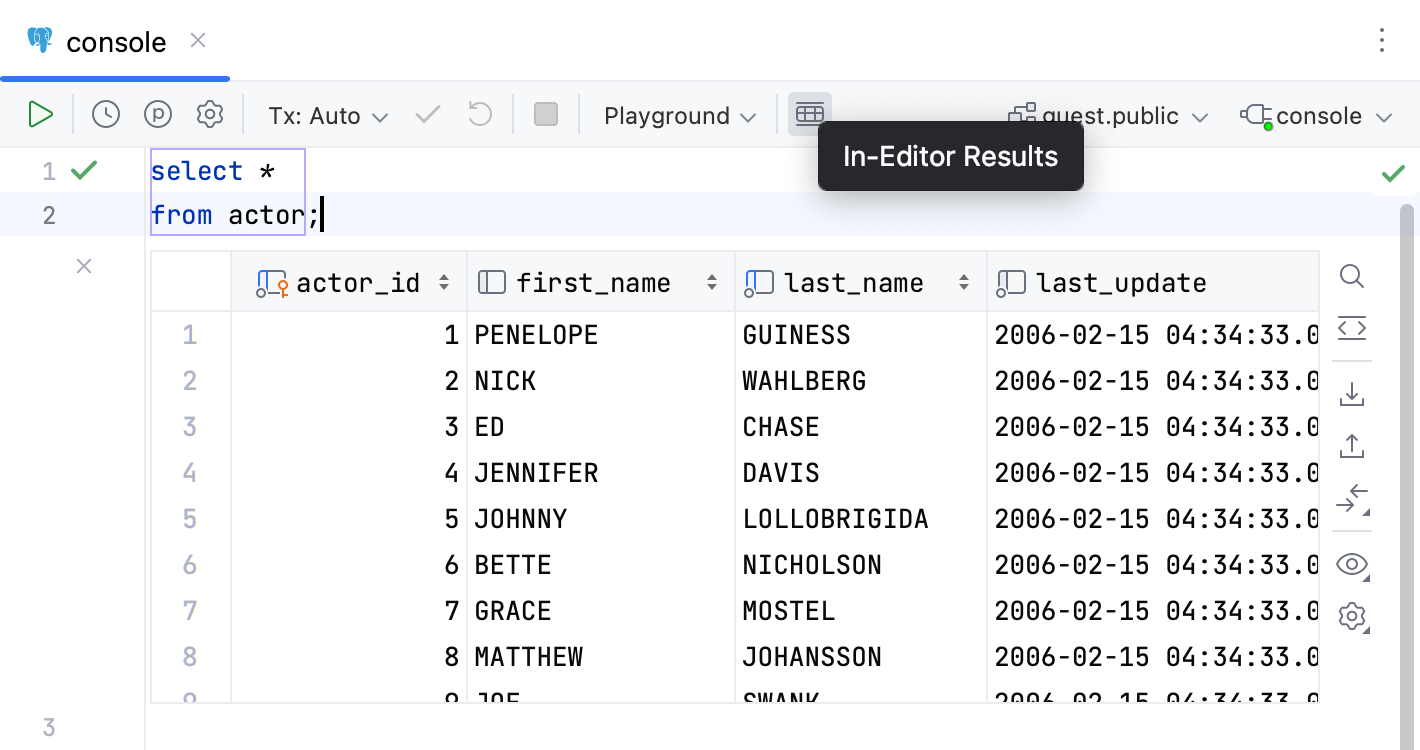
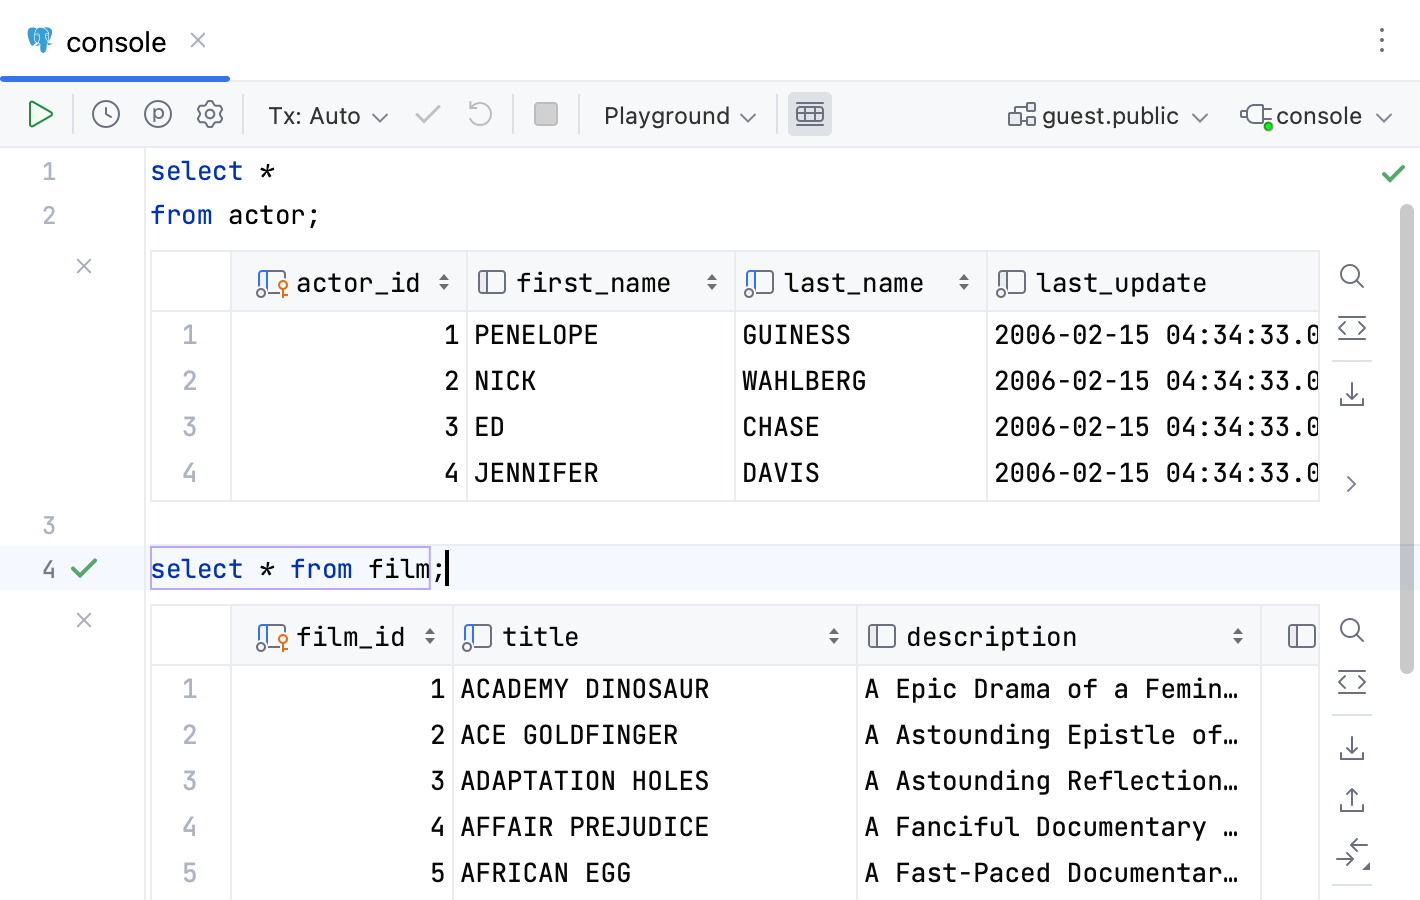
You can also view the query results within the editor. To do that, use the In-Editor Results feature.
To toggle the In-Editor Results feature for the current file, click the In-Editor Results button (
) on the toolbar.
To toggle the In-Editor Results feature for all files across the IDE, open settings by pressing CtrlAlt0S and navigate to Database | Query Execution | Output and Results | Results. Clear the Show results in editor checkbox.
Click the In-Editor Results button (
) on the toolbar to view the result sets one above the other.
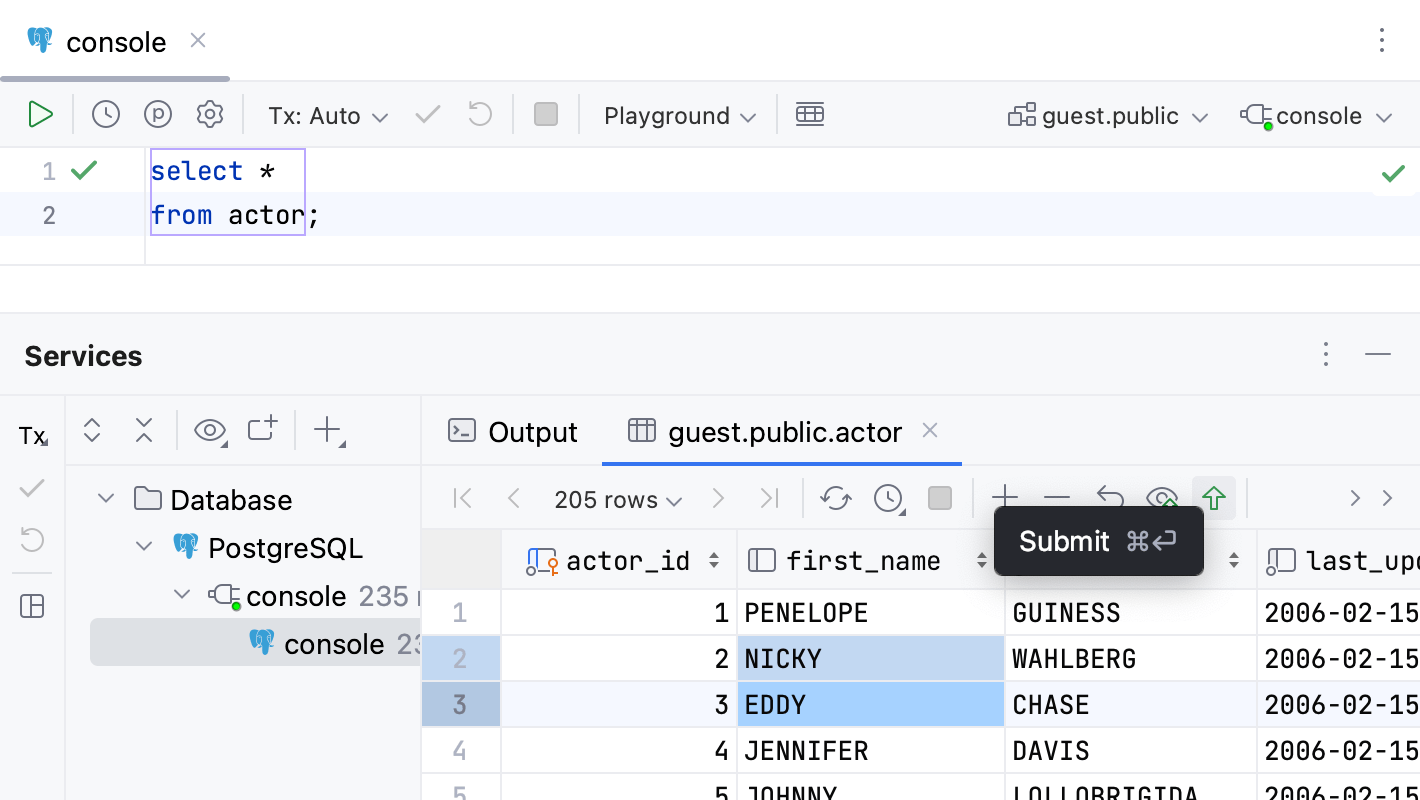
In the result set, click a cell value that you want to edit.
Specify a new value and press Enter.
To submit changes to a database, click the Submit button (
) on the toolbar, or press CtrlEnter.
For more information about submitting changes to a database, refer to the Submit changes to a database topic.
Run queries to tables that you want to compare.
In the Services tool window, click the Compare Data button (
), and select the result set that you want to add to diff.
If needed, change a value of the Tolerance parameter in the comparison dialog. The Tolerance parameter defines a maximum number of differences that are allowed between two result sets. For example, if you want to consider two rows as equal if their data differs in a single column, enter
1in the Tolerance field.See another example of comparing two result sets in Compare data at youtube.com.
On the Output tab in the Services tool window, you can see a log of user and internal queries.
In the Database tool window ( View | Tool Windows | Database) , , open a query console by right-clicking a data source and navigating to New | Query Console.
Alternatively, select a data source and press F4.
Run a query.
In the Services tool window that opens, click the Output tab.
For full information about Services tool window, refer to the Services tool window topic.
Use the Output tab of Services tool window to view information about SQL statements and other operations that you performed in a query console. Also, the Output tab displays information about errors, timestamps, affected rows, query duration, the autocommit mode, and other operations.
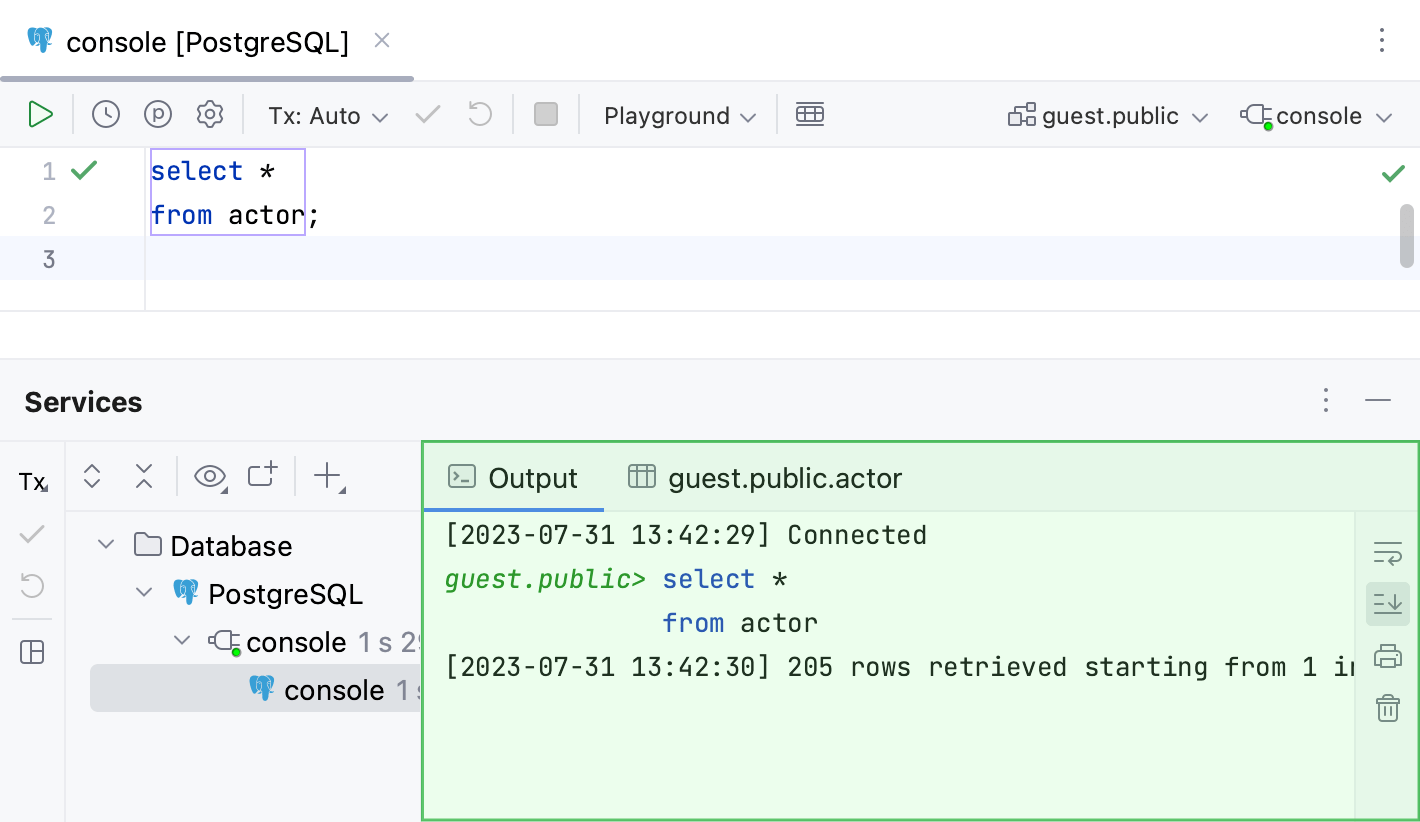
Right toolbar
Item | Tooltip | Description |
|---|---|---|
Soft-Wrap | Wrap long lines of text. | |
Scroll to End | Scroll the output log to the end. | |
Print a query console file, a selected text, or all the files in a directory. | ||
Clear All | Clear the Output tab. |
Context menu
Item | Description |
|---|---|
| Copy the selected text. |
Copy Path/Reference | Copy a reference link to a file or a line. |
| Open the Clipboard vs Editor dialog where you can see the diff between the selected text and the text that you copied to a clipboard. |
Search with Google | Open a browser and run a search on Google for the selected text. |
Fold Lines Like This | Fold the lines that include the selected text. |
Pause Output | Pause the output logging. |
| Clear the output log. |
Use the Result tab of Services tool window to see the data that was retrieved from the database in a table format. You can sort, add, edit, and remove data as well as perform other associated table tasks. For more information about working with tables, rows, columns, and cells, refer to Tables.
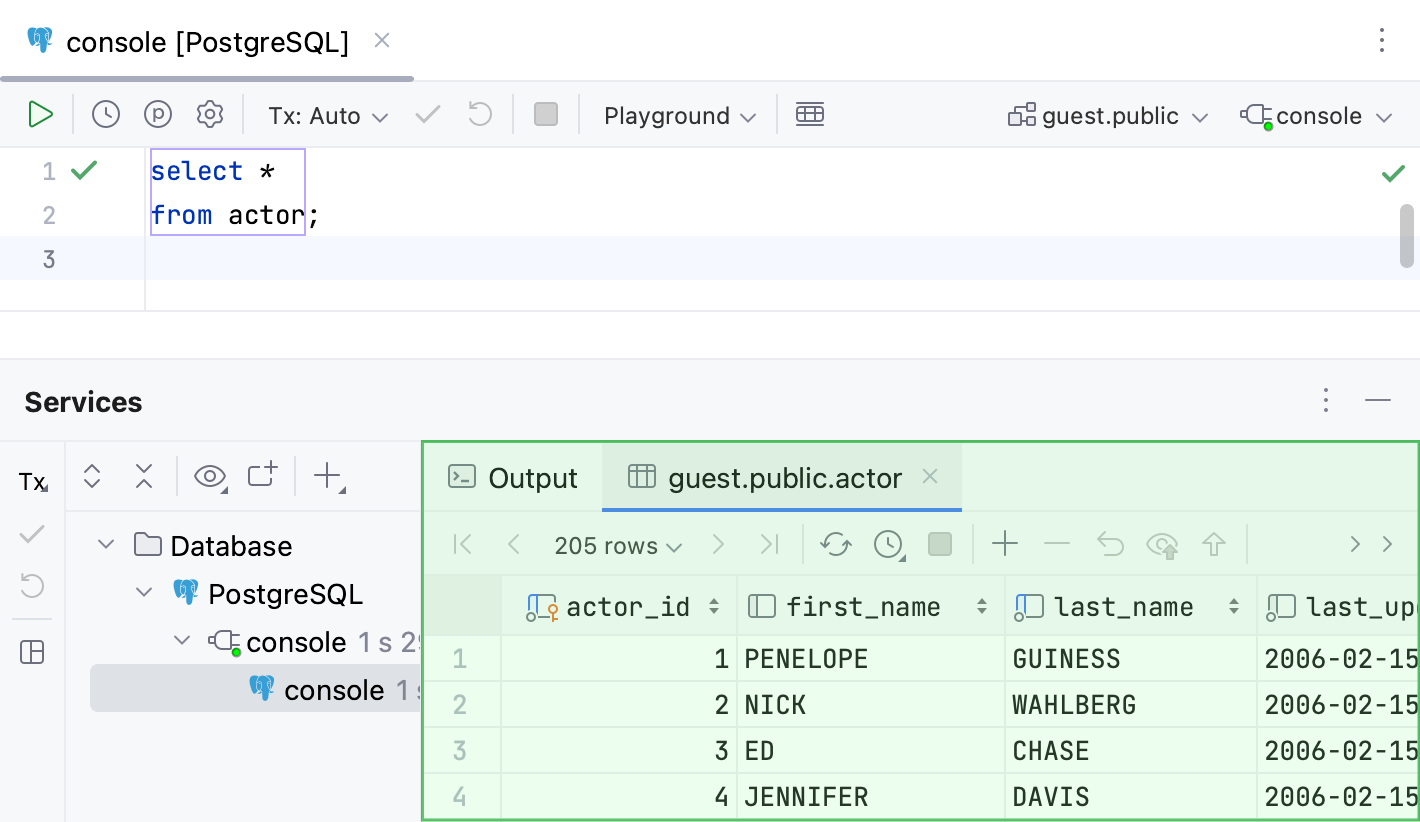
Most of the functions in the Result tab are accessed by using controls on the toolbar, context menu commands for the data cells, and associated keyboard shortcuts. You can see what other actions with tables you can perform in Tables.
Icon | Action and shortcut | Description |
|---|---|---|
| First Page Previous Page CtrlAlt0↑ Change page size Next Page CtrlAlt0↓ Last Page | Use navigation icons and corresponding commands for switching between pages that show the retrieved data and change the page size. A number of rows that you see on the Result tab are referred to as a result set page. If this number is less than the number of rows that satisfy the query, only a subset of all the rows is shown at a time. If all the rows are currently shown, navigation icons and the corresponding commands are inactive. You can see the limit between the navigation buttons. You can change it here by clicking and selecting the necessary limit or in settings.
To change the size of a result set page, click the Change page size button and select the size. Alternatively, open settings (CtrlAlt0S) and navigate to Tools | Database | Data Editor and Viewer. In the Limit page size to field, type a new size of a result set page. Alternatively, to disable the page size restriction, clear the Limit page size to checkbox. |
Reload Page CtrlF5 | Reload data for the table view to synchronize the data that you see in the editor with the contents of the database. Also, use the Reload Page button when you want to apply a new page size limit setting after its change. | |
Update Interval | Select, pause, or disable update interval for the current table. You can also set a custom one. | |
Cancel Running Statements CtrlF2 | Terminate execution of the current statement or statements. | |
Add Row AltInsert | Add a row to the table. To save a new row, click Submit button ( The Add Row button is disabled in the inappropriate context. For example, if the current table does not permit adding rows. For more information about working with rows, refer to Rows. | |
Delete Row Ctrl0Y | Delete the selected row or rows. To select multiple rows, click numbers in the gutter. Also, you can press Ctrl and click the necessary rows. The Delete Row button is disabled in the inappropriate context. For example, if the current table does not permit removing rows. | |
Revert Selected CtrlAlt0Z | Revert changes that you made to a cell value. You can select a scope of different cells and revert values in this scope. For more information about reverting changes, refer to Submit changes to a database. | |
Preview Pending Changes | Preview DML of changes that you made to the table. | |
Submit CtrlEnter | Submit local changes to the database server. For more information about submitting and reverting changes, refer to Submit changes to a database. | |
| Transaction Mode and Transaction Isolation | Select the isolation level for database transactions and the way the transactions are committed.
For more information about database transaction modes and isolation, refer to Submit changes to a database. |
Submit and CommitCtrlAltShiftEnter | Submit and commit the current transaction. This button is available only for the manual transaction mode. See also, transaction mode and isolation. | |
| Roll Back | Roll back changes. This button is available only for the manual transaction mode. See also, transaction modes and isolation. |
Pin Tab | Pin the tab to the tool window to keep the query result. For more information about pinning tabs, refer to Pin the tab with query results. | |
| Data Extractors | Select an output format for your data. For the list of available formats and full information about data extractors, refer to the Data extractors topic. Also, you can configure the following options:
For more information about data extractors, refer to the Data extractors topic. |
Export Data | Export the table data to the clipboard or save to a file. | |
Copy to Database | Copy the data to another table, schema or database. Select the target schema (a new table will be created) or table (the data will be added to the selected table). In the dialog that opens, specify the data mapping info and the settings for the target table. | |
Compare Data | Compare the current table with a table from the list. For more information about comparing tables, refer to Compare table data. | |
View as | Select the mode for browsing and editing table data.
For more information about viewing data, refer to View data. | |
Show Options Menu | The Show Options Menu list includes the following options:
|
You can find all basic actions for working with cells under the context menu. To call the context menu, right-click the cell that you want to modify. The following table lists all the actions.

Action | Shortcut | Description | |
|---|---|---|---|
Edit | F2 | Edit a value in the selected cell or cells. Alternatively, you can double-click the cell and start typing a value. The Edit command is unavailable for read-only values.
For more information about editing cells, refer to Cells. | |
| ShiftEnter | Open in a separate value editor where you can edit data that is stored in the cell. For more information about the editor, refer to Value editor. | |
| Open the aggregate view where For more information about the view, refer to Aggregate view. | ||
| CtrlAlt0Z | Revert changes that you made to a cell value. You can select a scope of different cells and revert values in this scope. For more information about reverting changes, refer to Submit changes to a database. | |
Set Highlighting Language | Select a language that the IDE should use to highlight data in a cell. | ||
Change Display Type | Select how the IDE should display binary data in the column. 16-byte data is displayed as UUID by default. | ||
Set DEFAULT | CtrlAlt0D | Set the current cell value to the default value or the value that you specified for the column. For more information about viewing or set a default value, refer to Manage default and NULL values for a cell. | |
Set NULL | CtrlAlt0N | Set the current cell value to NULL. For more information about allowing a NULL value, refer to Manage default and NULL values for a cell. | |
Load File… | Load a file into the field. | ||
Save LOB… | For the cells that contain a binary large object (LOB). Save content of a cell into a file. | ||
| Ctrl0C | Copy selection to the clipboard. | |
| Copy a summary value for a range of cells. By default, PhpStorm copies the | ||
| Ctrl0V | Paste the contents of clipboard into the table. | |
| Add a row to the end of a table. | ||
| AltDelete | Delete selected rows. | |
| Create a duplicate of the selected row and adds the duplicate to the end of a table. | ||
Go To | Navigation Bar | Jump to a navigation bar. | |
Database | Open the selected object in the Database tool window. | ||
Related Symbol | Navigate to one of the related objects. | ||
DDL | Open an object definition (DDL). | ||
Row… | Ctrl0G | Jump to a specified row. In the Go to Row dialog, specify the column and row number (use the | |
All Related Rows | F4 | Jump to a related record. The command options are a combination of those for Go To | Referenced Rows and Go To | Referencing Rows. Read more about related data in Navigate between related data. The command is not available if there are no related records. | |
Referenced Rows | Ctrl0B | Switch to a record that the current record references. If more than one record is referenced, select the target record in the popup that appears. Read more about related data in Navigate between related data. The command is not available if there are no referenced records. | |
Referencing Rows | AltF7 | Use this command or shortcut to see the records that reference the current record. Read more about related data in Navigate between related data. In the popup that appears there are two categories for the target records:
The command is not available if there are no records that reference the current one. | |
Filter by | Select a filter that you want to a column. | ||
| CtrlAltShift0F | Open a search window where you can search for data in your database or a group of databases. For more information about full-text search, refer to Full-text search in databases. | |
| Copy the whole table to the clipboard. This action does not depend on Limit page size to setting. | ||
Switch Session (your_current_session_name) | Open a window to select another session or create a new one. For more information about sessions, refer to Sessions. | ||
Quick Documentation | Ctrl0Q | Show information about selected objects. For different database objects, Quick Documentation shows corresponding information. For example, for a group of cells, you will see a summary for the selection. You can preview it in a regular or in a transposed view and also see the related records by their foreign keys. | |
Thanks for your feedback!