Debug a PHP HTTP request
Besides debugging the entire application, you can debug separate HTTP Requests. This is helpful when you are actually interested in a specific page that is accessed in a number of steps, but for this or that reason you cannot specify this page as the start page for debugging, for example, because you need to "come" to this page with certain data.
To debug PHP HTTP requests in PhpStorm, you can use the following methods:
Compose and debug the request via the HTTP client in the code editor, which is the recommended approach.
Use the PHP HTTP Request run configuration. Based on the configuration settings, PhpStorm composes the request to run.
Before you start debugging, make sure that you have a debugging engine installed and configured properly. PhpStorm supports debugging with two most popular tools: Xdebug and Zend Debugger. These tools cannot be used simultaneously because they block each other. To avoid this problem, you need to update the corresponding sections in the php.ini file as described in Configure Xdebug and Configure Zend Debugger.
Open the active php.ini file in the editor:
In the Settings dialog () , click PHP.
On the PHP page that opens, click
next to the CLI Interpreter field.
In the CLI Interpreters dialog that opens, the Configuration file read-only field shows the path to the active php.ini file. Click Open in Editor.
Breakpoints are source code markers used to trigger actions during a debugging session. Typically, the purpose behind setting a breakpoint is to suspend program execution to allow you to examine program data. However, PhpStorm can use breakpoints as triggers for a variety of different actions. Breakpoints can be set at any time during the debugging process. Your breakpoints don't affect your source files directly, but the breakpoints and their settings are saved with your PhpStorm project, so you can reuse them across debugging sessions.
Place the caret at the desired line of the source code.
Breakpoints can be set in the PHP context inside php, html, and files of other types. Line breakpoints can be set only on executable lines, but not on comments, declarations, or empty lines.
Do one of the following:
Click the gutter area at a line where you want to toggle a breakpoint.
Go to Run | Toggle Line Breakpoint.
Press .
Using the built-in HTTP Client, you can compose, execute, and debug HTTP requests directly from the PhpStorm code editor.
Open an existing HTTP request file, or create a new one: in the File menu, point to New, and then click HTTP Request.
Compose an HTTP request for the query that you need to debug.
Place the caret at the request and press or click
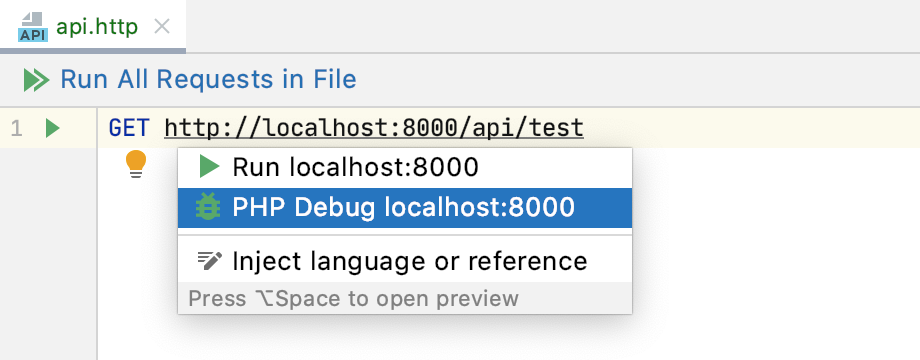
in the editor gutter. From the popup menu, select PHP Debug <host>.

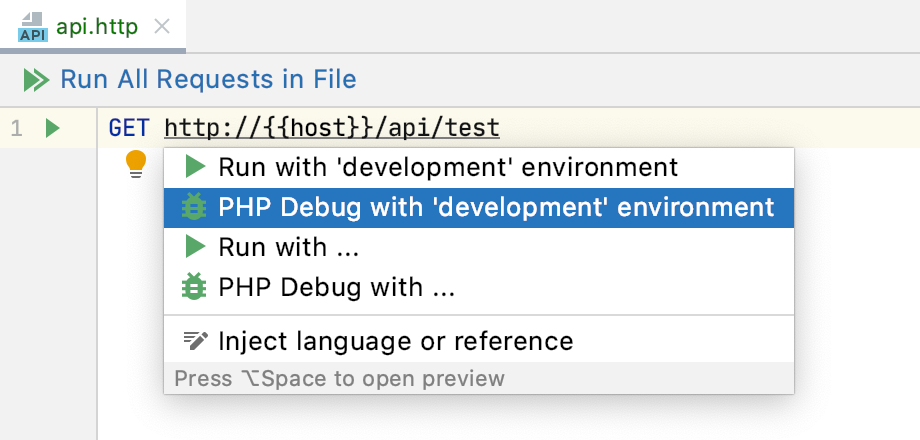
If you have environments defined, select PHP Debug with ... and choose the environment in the popup menu. The selected environment will be used as the default one when executing or debugging the request later.

PhpStorm will automatically add the
XDEBUG_SESSIONcookie to the request, execute it, and stop at the specified breakpoint.
When a request is executed, PhpStorm automatically creates a dedicated temporary HTTP Request run/debug configuration for it. You can save it as a permanent run/debug configuration if necessary.
tip
Press to run or to debug the corresponding saved run/debug configuration at any moment without the need to open the request file in the editor. This can be useful if you are working on the web service endpoint implementation and want to quickly test it by sending an HTTP request.
PhpStorm comprises the settings specified in this configuration into a PHP HTTP request. Note that using HTTP Client in editor for debugging HTTP requests is a more convenient and recommended approach.
Open the Run/Debug Configuration dialog by doing one of the following:
Go to Run | Edit Configurations.
Press , then press to display the Edit Configuration dialog or select the configuration from the popup and press .
Click
on the toolbar or press . From the list, select the PHP HTTP Request configuration type. The PHP HTTP Request dialog opens.
Specify the configuration name.
In the Server list, specify the debug server configuration to interact with the Web server where the application is executed. Select one of the existing configurations or click Browse
and define a debug server configuration in the Servers dialog that opens as described in Create a PHP debug server configuration.
In the URL field, complete the
hostelement of the request to debug. Type the path relative to the host specified in the debug server configuration. As you type, PhpStorm composes the URL address on-the-fly and displays it below the field.Specify whether you want to bring any data to the target page. From the Request method list, choose the relevant request type:
To access the page without bringing any data, choose GET.
To access the page with some data saved in variables, choose POST and type the relevant variables in the Request body field.
By default, the Project Encoding is used in requests' encoding if it is not specified explicitly, for example:
header('Content-type: text/html;charset=utf-8');The Project Encoding is specified on the File Encodings page of the Settings dialog () .
In the Query field, type the query string of the request. This string will be appended to the request after the ? symbol.
Click OK, when ready.
To start debugging, click the Debug button
on the toolbar.
As soon as the debugger suspends on reaching the first breakpoint, examine the application by analyzing frames. A frame corresponds to an active method or function call and stores the local variables of the called method or function, the arguments to it, and the code context that enables expression evaluation. All currently active frames are displayed on the Frames pane of the Debug tool window, where you can switch between them and analyze the information stored therein in the Variables and Watches panes. For more information, refer to the section Examine a suspended program.
Continue running the program and examine its frames as soon as it is suspended again.
To control the program execution manually, step through the code using the commands under the Run menu or toolbar buttons: Step Into , Step Out , Step Over , and others. For more information, refer to Step through the program.
To have the program run automatically up to the next breakpoint, resume the session by choosing Run | Debugging Actions | Resume Program or pressing .