Playwright
note
Playwright support in PhpStorm is provided by the Test Automation plugin, and most of the features described in this section rely on it. However, basic functionality like running and debugging Playwright tests works without the plugin.
Playwright is an open-source test automation framework. It provides a high-level API for automating web browsers such as Chrome, Firefox, and Safari.
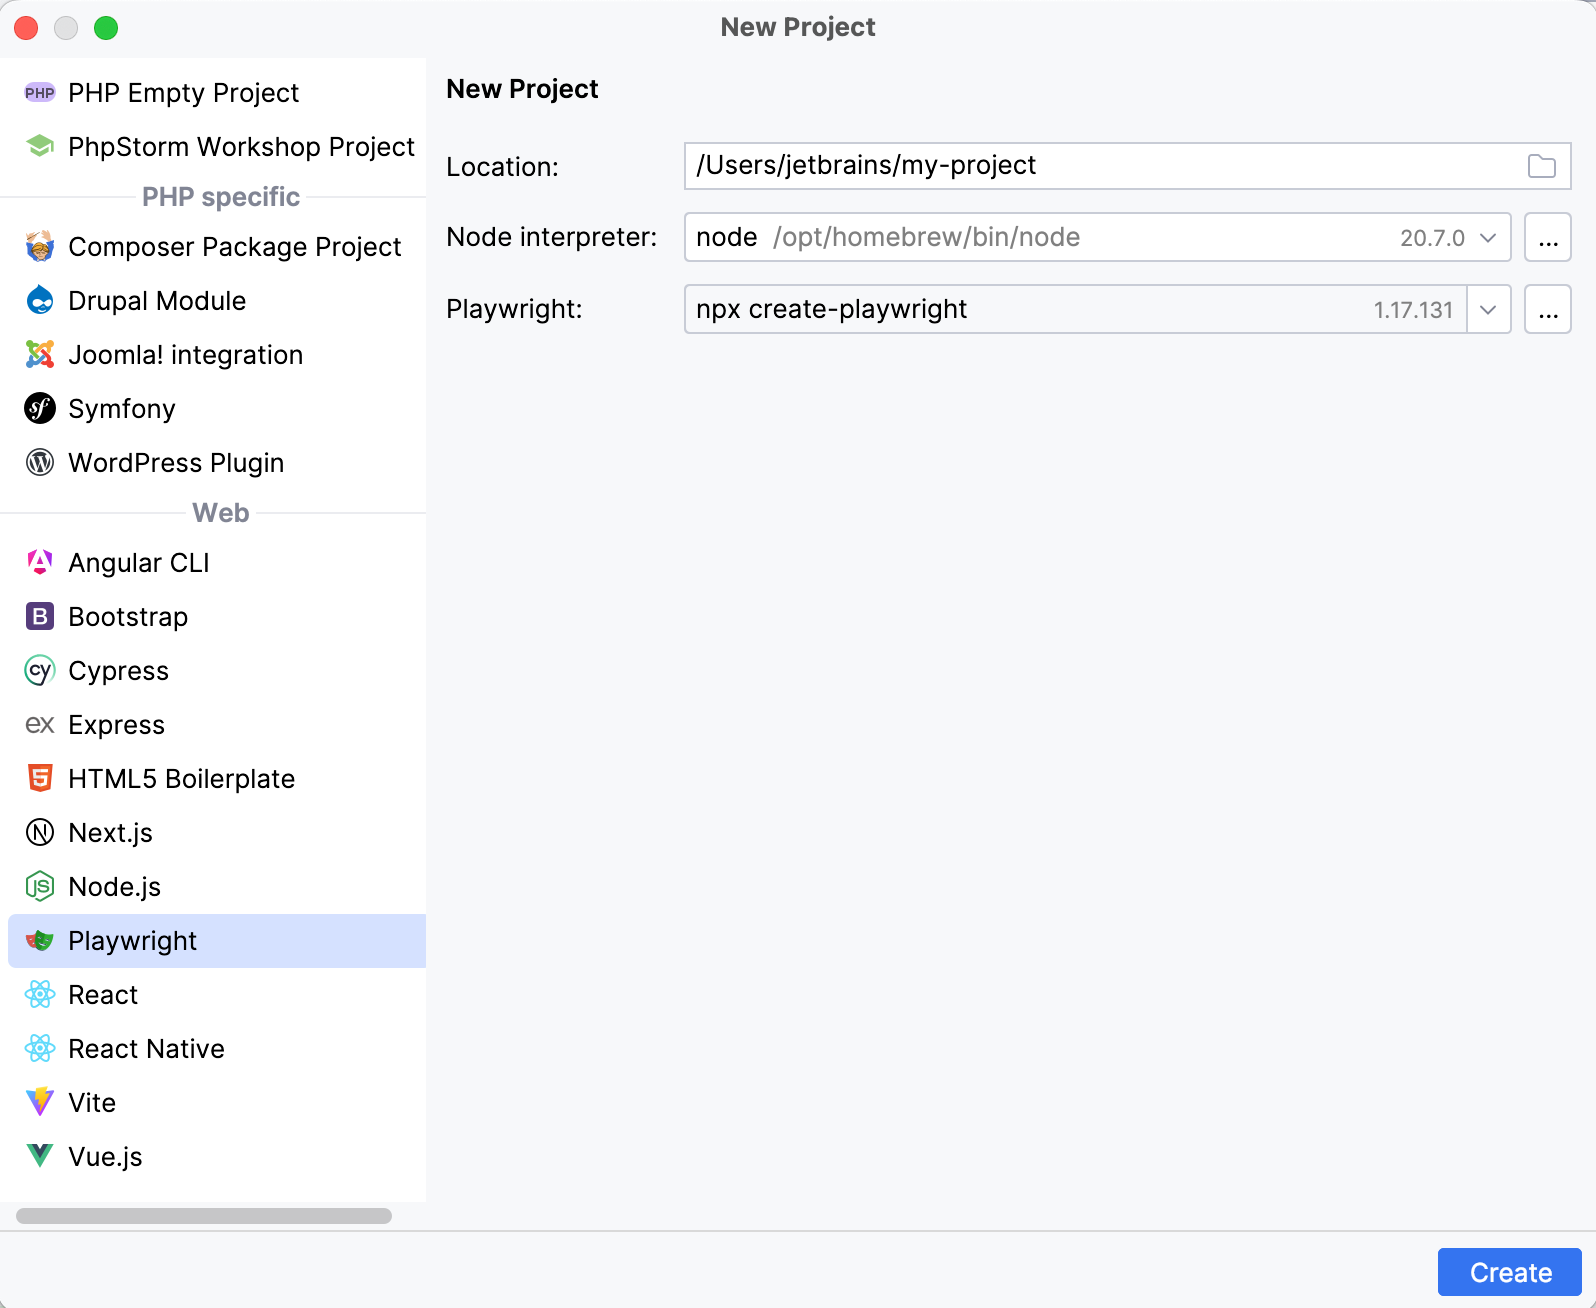
In the main menu, go to File | New Project.
Alternatively, if you're on the Welcome screen, click New Project.
From the list on the left, select Playwright.

Name the new project and change its location if necessary.
Specify the Node interpreter.
Specify the command to install Playwright.
Click Create.
A new project is created according to the options that you have selected.
Once the project is created, you need to initialize it. During this procedure, you will select the desired language, install Playwright browsers, and specify other settings.

To start the project initialization:
In the Run tool window Alt04, press the up/down arrow buttons on your keyboard to select the language that you want to use in the project.
Type the name of the folder where you want to put your end-to-end tests.
Specify if you want to add a GitHub Actions workflow.
Specify if you want to install Playwright browsers.
When you specify all the parameters, the initialization starts. The system will notify you once the process is completed:

In Playwright, you can locate an element by its role. This helps to pinpoint a specific element on the page, be it a button, checkbox, heading, link, or other elements.
PhpStorm can generate such locators and add them to your code, so you can use them in your tests.

Open the file where you want to add an element.
Click
on the right-hand sidebar to open the Web Inspector toolbar window.
Specify the URL of the page in the address bar.

Click
and select the element that you want to add in the Web Inspector.

Once the element is selected, click
to add the element to the code.

To add a specific type of the selector (ID, Name, Tag with classes, and so on), click
and select the required option.

tip
Here, you can also add the element to code by its role.
If you want to switch specifically between CSS and XPath locators, click
and select the required locator type.

As a result, a piece of code is generated and added to the code editor.
To run your tests, click the
gutter icon next to the test class or test method, then select the Run option from the list.

Alternatively, place the caret at the test class to run all tests in that class, or at the test method, and press CtrlShiftF10.
You can run tests in a more customizable way using the run/debug configurations. For more information, refer to Run tests.
Running tests in headed mode allows you to get a visual representation of how Playwright interacts with the website.
To run tests in headed mode:
Click the current configuration in the run/debug configuration switcher, then click
and select the Edit option.

In the Playwright options field, specify the
--headedcommand:
Apply changes and run your tests.
As a result, a browser is opened to reproduce the steps from the tests.
When the tests finish running, the results are displayed on the Test Runner tab of the Run tool window. On this tab, you can rerun tests, export and import test results, see how much time it took to run each test, and perform other actions.

For more information, refer to Explore test results.
In general, the debugging procedure includes the following steps:
Set breakpoints for the lines of code where the execution must be suspended.
Run your code in debug mode.
Use the Debug tool window to analyze the code and locate potential issues.
Fix the issues.
To reproduce these steps in the IDE, do the following:
In the gutter, hover over the executable line of code where you want to suspend the execution and click
.

Click
in the gutter and select Debug. This starts the debugger session and runs your code.

Once the program hits the breakpoint, the execution becomes suspended, and you can review the results of the debugger session on the Debug tool window.

Playwright reporters provide detailed information about failed tests, allowing you to perform a more thorough analysis of what happened during the test execution.
By default, an html report is generated, but you can switch to an alternative format using run/debug configurations. To do this:
Click the current configuration in the run/debug configuration switcher, then click
and select the Edit option.

In the Playwright options field, specify the desired reporter. For example:
--reporter=lineApply changes and run your tests.
As a result, a detailed report is generated.

If you want to modify the startup properties for your tests, edit the run/debug configuration:
Click the current configuration in the run/debug configuration switcher and select the Edit Configurations option.

In the Run/Debug Configurations dialog, select the configuration that you want to edit.
Configure the required startup properties.

Apply changes and click OK.
For more information on run/debug configurations, refer to Run/debug configurations.
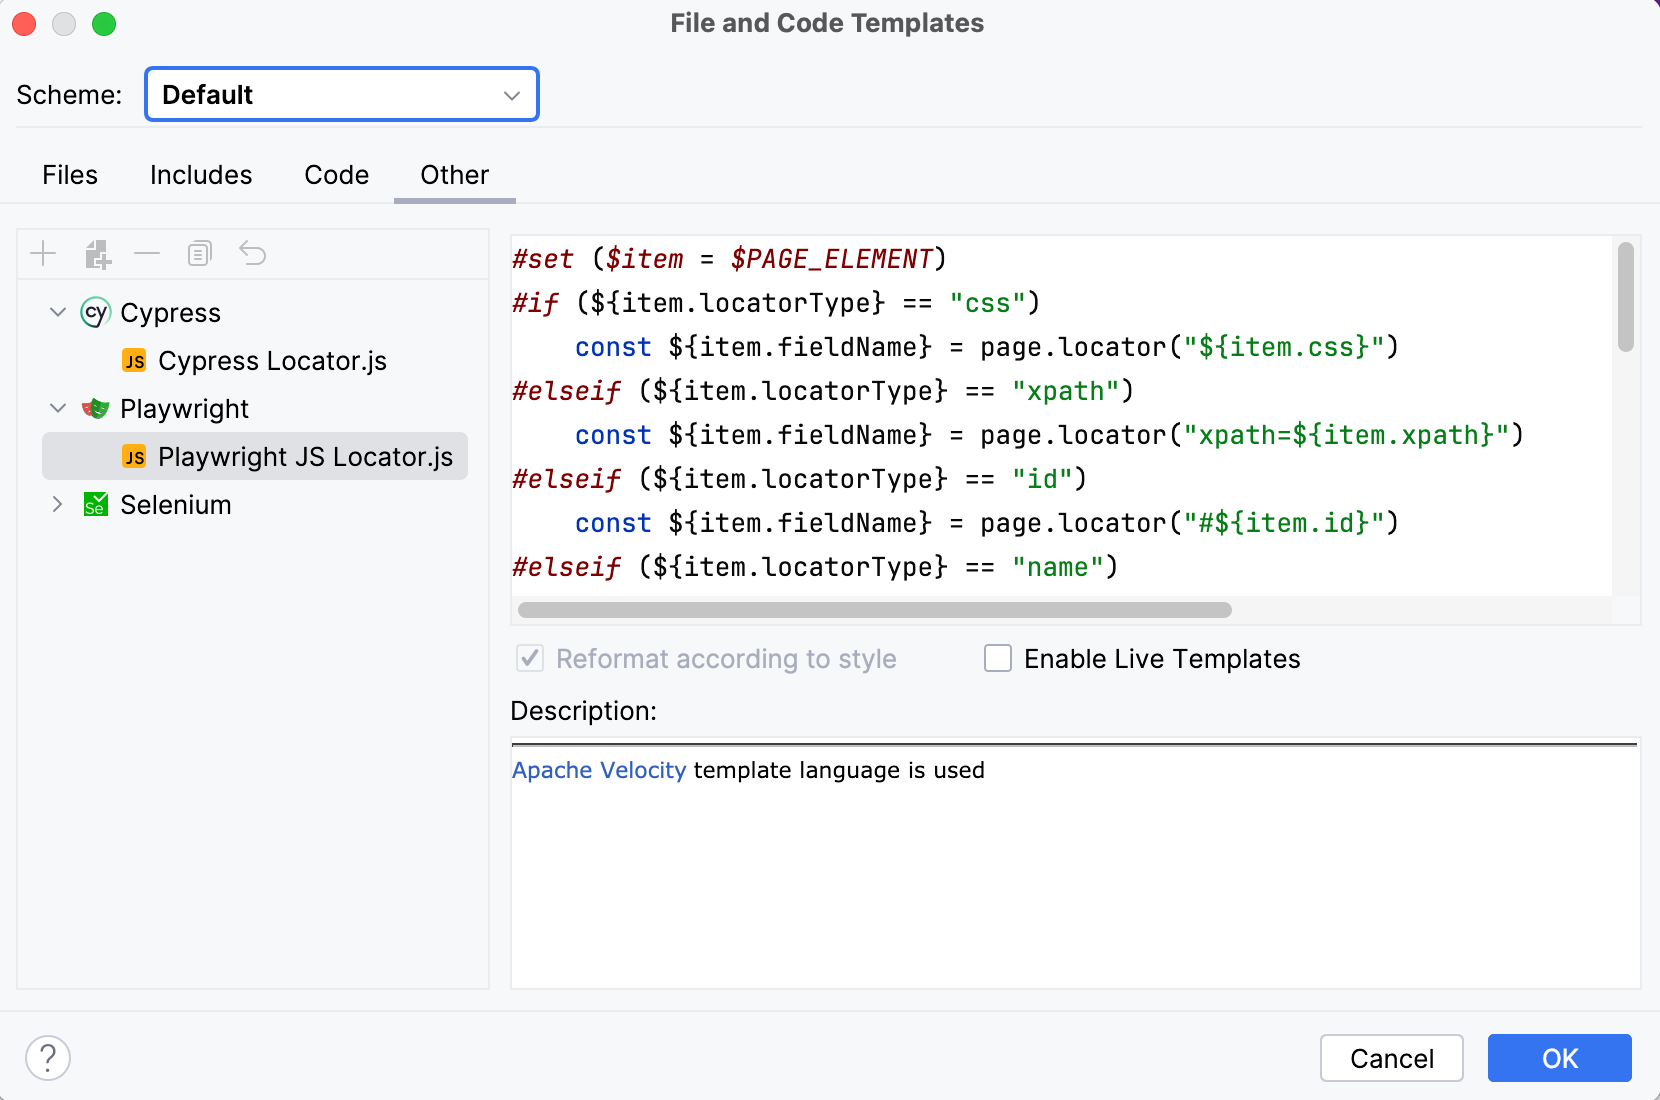
If you want to customize how selected elements are added to your code, you can modify the template:
Click the framework name on the Status bar. The UI Automation Framework menu opens.

Select the Customize Template option.
In the File and Code Templates dialog, select the required framework from the list.

Rewrite the code generation algorithms for the web element locator.
tip
Apache Velocity template language is used.
Click OK to save changes.
As a result, the locators will be added to the code according to the updated code generation algorithms.
Thanks for your feedback!