Step through the program
Stepping is the process of controlling step-by-step execution of the program.
PhpStorm provides a set of stepping actions, which are used depending on your strategy, such as whether you need to go directly to the next line or inspect the intermediate method calls as well.
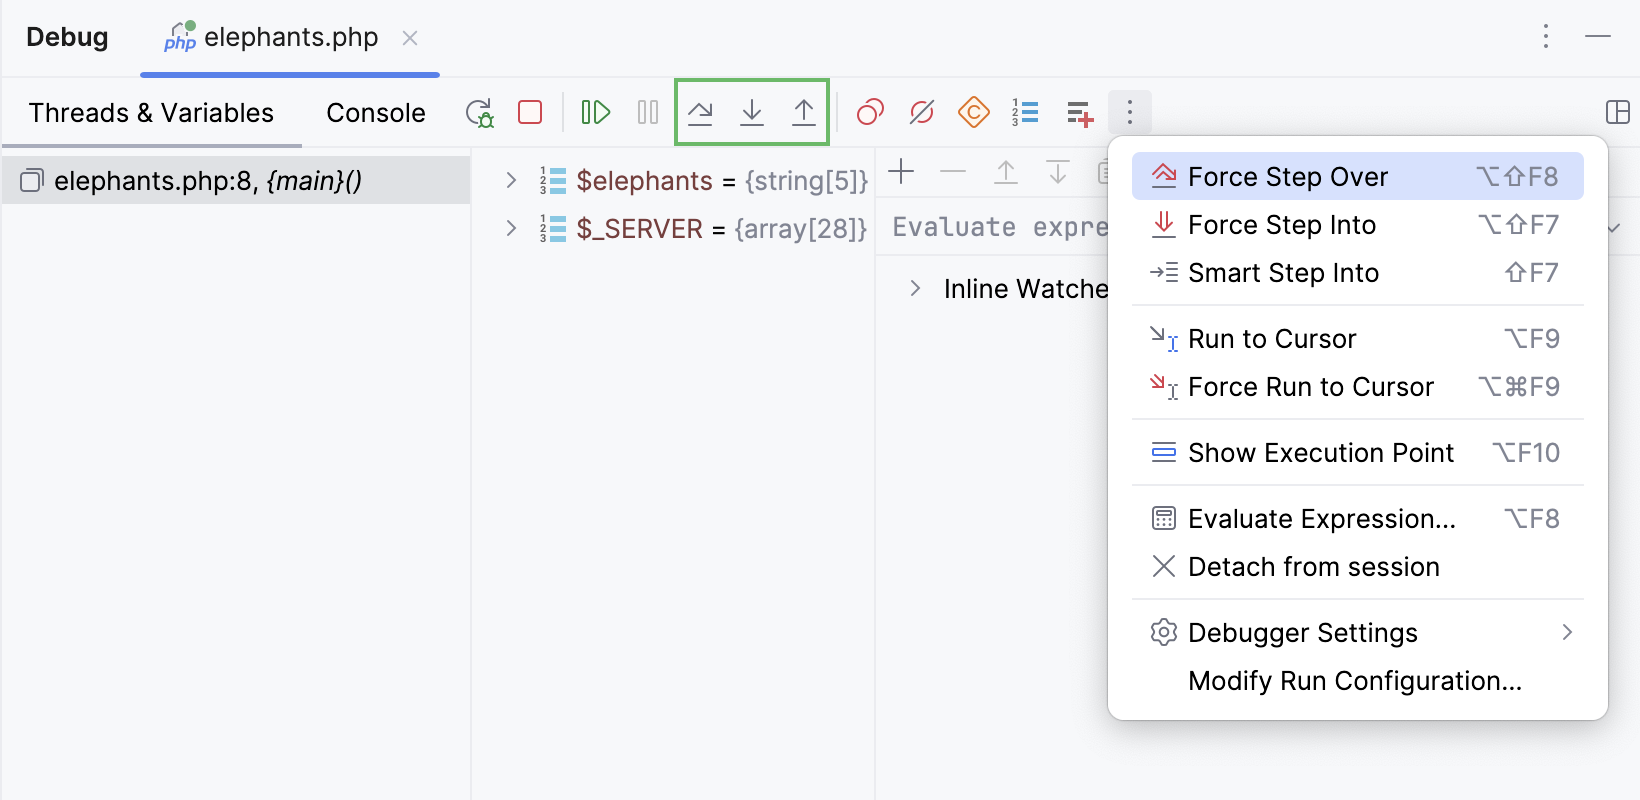
The stepping buttons are located on the Debug window toolbar.

Steps over the current line of code and takes you to the next line even if the highlighted line has method calls in it. The implementation of the methods is skipped, and you move straight to the next line of the caller method.
Click the Step Over button
or press F8.
If there are breakpoints inside the skipped methods, the debugger will stop at them. To skip any breakpoints on the way, use Force step over.
Enters the method to show what happens inside it. Use this option when you are not sure the method is returning a correct result.
Click the Step Into button
or press F7.
If there are several method calls on the line, PhpStorm asks you which method to enter. This feature is called Smart step into.
You can configure Smart Step Into to be automatically used every time when there are multiple method calls on the line. Alternatively, it can be invoked only when you expressly do so.
Some scripts, methods, and functions are skipped by Step into as you normally might not need to debug them.
In the Settings dialog (CtrlAlt0S) , go to Build, Execution, Deployment | Debugger | Stepping. The Debugger. Stepping page opens.
To skip all library scripts, select the Do not step into library scripts checkbox.
To suppress stepping into some specific scripts, select the Do not step into scripts checkbox and create a list of such scripts using the toolbar buttons.
In the Settings dialog (CtrlAlt0S) , go to PHP | Debug | Step Filters. The Step Filters page opens.
Select the checkboxes next to the relevant Magic methods and Constructors method types.
If necessary, add specific methods to the Skipped Methods list manually by using the
toolbar button.
Smart step into is helpful when there are several method calls on a line, and you want to be specific about which method to enter. This feature allows you to select the method call you are interested in.
Select Smart Step Into from the
menu or press ShiftF7.
Click the method. Alternatively, select the method using the arrow keys or the tab key, and then confirm the selection by pressing either Enter or F7.

Steps out of the current method and takes you to the caller method.
Click the Step Out button
or press ShiftF8.
Continues the execution until the position of the caret is reached.
Place the caret at the line where you want the program to pause.
Select Run to Cursor from the
menu or press AltF9.
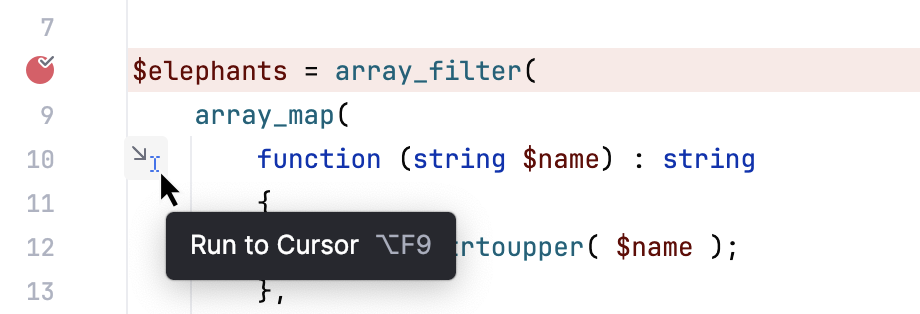
Also, you can Run to Cursor by hovering over the line and clicking the Run to Cursor icon.

You can configure whether you want Run to Cursor to work on clicking a line number in Settings | Build, Execution, Deployment | Debugger.
To skip any breakpoints on the way, use Force run to cursor.
Steps in the method even if this method is skipped by the regular Step Into.
Go to Run | Debugging Actions | Force step into or press AltShiftF7.
static void count(int to) {
    for (int i = 0; i < to; i++) {
        // the program is suspended here
            System.out.println(i);
        }
    System.out.println("Complete!");
}
public void println(String x) {
// Force Step Into enters the implementation of PrintStream.println()
if (getClass() == PrintStream.class) {
writeln(String.valueOf(x));
} else {
synchronized (this) {
print(x);
newLine();
}
}
}Continues the execution until the position of the caret is reached. All breakpoints on the way are ignored.
Place the caret at the line where you want the program to pause.
Select Force Run to Cursor from the
menu or press CtrlAltF9.
Steps over the current line of code and takes you to the next line even if the current line has method calls in it. If there are breakpoints in the called methods, they are ignored.
Select Force Step Over from the
menu or press AltShiftF8.
Stops the debugger, but leaves the script running with no debugger attached to it. The action is available with Xdebug version 3.0 and later.
Go to Run | Debugging Actions | Detach from session.
Alternatively, click
on the Debug window toolbar and select
Detach from session.
Debugger features consume resources and may impact stepping performance. If the performance is not satisfactory, follow the recommendations provided in this chapter to optimize it.
Disable or minimize the use of the following features if they are not required for your project:
If the number of user-defined constants is significant, the stepping performance might decrease. You can disable fetching such constants and thus improve stepping performance by clicking
on the Debug tool window toolbar. The Constants node will be hidden.
Simplify the conditions for breakpoints and watchpoints, especially frequently hit ones.
During the debugging session, switch to a view with fewer elements.
When a breakpoint is reached or your program is suspended, the Debug tool window becomes active and enables you to get control over the program's execution. For this purpose, you can use the Run menu commands, or the icons on the stepping toolbar of in the Debug tool window.
Each stepping action advances the execution point to the next execution location, depending on the action you choose.
You can create a list of scripts, methods, and functions that you want the debugger skip while stepping through the program.
In the Settings dialog (CtrlAlt0S) , click Debugger under Build, Execution, Deployment, and then click Stepping. The Debugger. Stepping page opens.
To skip all library scripts, select the Do not step into library scripts checkbox.
To suppress stepping into some specific scripts, select the Do not step into scripts checkbox and create a list of such scripts using the toolbar buttons.
In the Settings dialog (CtrlAlt0S) , go to PHP, and then click Step Filters under Debug. The Step Filters page opens.
Select the checkboxes next to the relevant method types: Magic methods and Constructors.
If necessary, add specific methods to the Skipped Methods list using the
toolbar button.
note
Step filters are not applied when debugging PHP CLI scripts.
The Force Step Into command
enables you to step into a method of a class not to be stepped into .
The classes, stepping into which is suppressed, are specified on the Debugger. Stepping page of the Settings dialog.
The Force Step Over command
enables you to jump over the method call ignoring the breakpoints on the way.
The Force Run to Cursor command
enables you to jump to the caret position ignoring existing breakpoints on the way.
Thanks for your feedback!