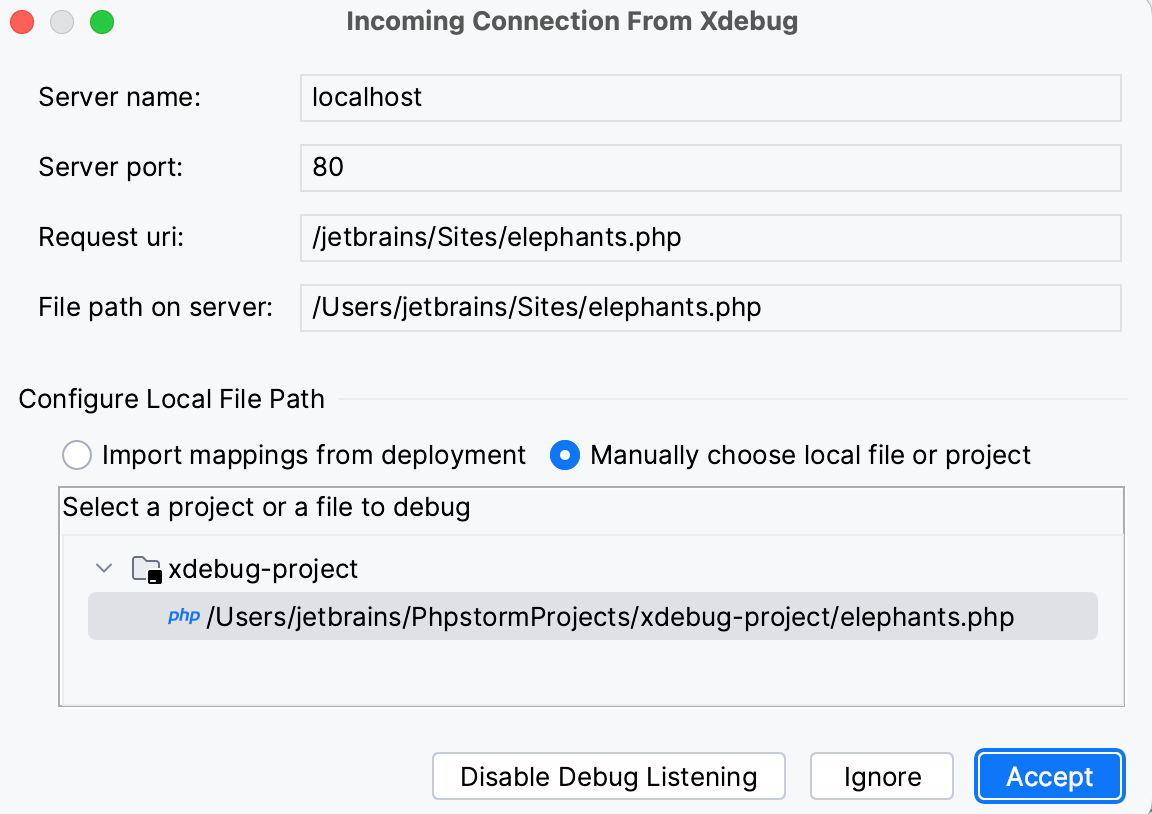
Incoming Connection dialog
The dialog opens when you initiate a zero-configuration debugging session.

The upper part of the dialog is read-only and shows the host and port where the script is executed, the path to the script relative to the server document root, and the absolute path to the script on the server.
In this dialog, either specify the path mappings manually or import them from the relevant deployment configuration.
To continue debugging with the imported or manually specified configuration settings, click Accept.
Item | Description |
|---|---|
Import mappings from deployment | Choose this option to use the mappings specified in a deployment configuration.
|
Manually choose local file or project | When you select this option, PhpStorm displays the project tree view where you can select a project file and map the currently executed script to it. You can also select and map the entire project. |